

EphA2 phosphorylates NLRP3 and inhibits inflammasomes in airway epithelial cells
- PMID: 32352641
- PMCID: PMC7332978
- DOI: 10.15252/embr.201949666
EphA2 phosphorylates NLRP3 and inhibits inflammasomes in airway epithelial cells
Abstract
Inflammasomes are intracellular complexes that form in the cytosol of inflammatory cells. NLRP3 is one of the sensor proteins in the complex that can recognize a wide variety of stimuli ranging from microbial components to environmental particulates. Here, we report that in mouse airway epithelial cells (AECs), inflammasome activation is inhibited by EphA2, a member of the transmembrane tyrosine kinase receptor family, via tyrosine phosphorylation of NLRP3 in a model of reovirus infection. We find that EphA2 depletion markedly enhances interleukin-1β (IL-1β) and interleukin-18 (IL-18) production in response to the virus. EphA2-/- mice show stronger inflammatory infiltration and enhanced inflammasome activation upon viral infection, and aggravated asthma symptoms upon ovalbumin (ova) induction. Mechanistically, EphA2 binds to NLRP3 and induces its phosphorylation at Tyr132, thereby interfering with ASC speck formation and blocking the activation of the NLRP3-inflammasome. These data demonstrate that reovirus employs EphA2 to suppress inflammasome activation in AECs and that EphA2 deficiency causes a pathological exacerbation of asthma in an ova-induced asthma model.
Keywords: EphA2; NLRP3; asthma; inflammasome; reovirus.
© 2020 The Authors.
Conflict of interest statement
The authors declare that they have no conflict of interest.
Figures
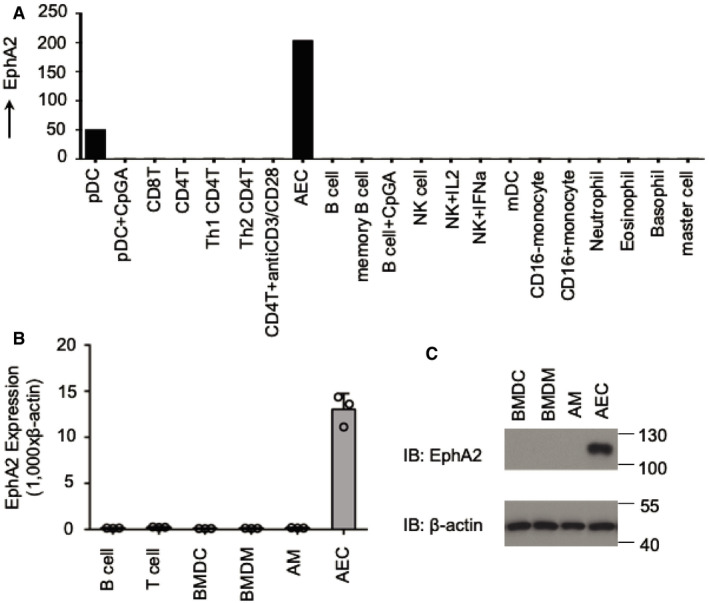
- A
Human myeloid cells and lymphoid cells were purified from PBMCs using a cell sorter. Total RNA was isolated from these primary cells and primary AECs to perform chip hybridization and microarray analysis.
- B, C
The profile of EphA2 expression in different cells is indicated. (B) Murine B cells and T cells were purified from spleens using a cell sorter, and total RNA was isolated from murine B cells, T cells, BMDCs, BMDMs, AMs, and AECs. Shown is mean ± SD. Data represent three independent biological replicates. (C) Immunoblot analysis of EphA2 and β‐actin in BMDCs, BMDMs, AMs, and AECs.
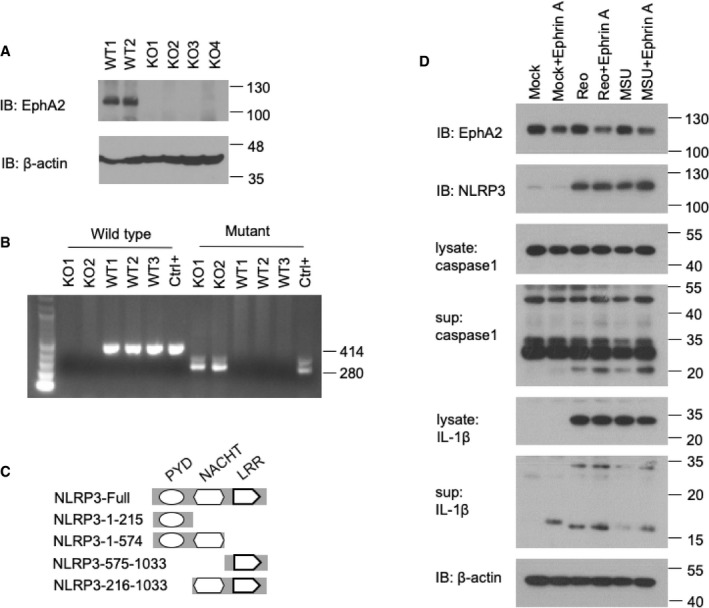
- A, B
Genotyping graph of wild‐type and EphA2‐knockout mice. (A) Immunoblot analysis of EphA2 and β‐actin in lung homogenates from wild‐type (WT) and EphA2‐knockout (KO) mice. (B) PCR analysis of wild‐type (WT) and EphA2‐knockout (KO) mice. 414 bp represents wild‐type, and 280 bp represents EphA2‐knockout.
- C
Full‐length NLRP3 and serial truncations of NLRP3 with deletion of various domains.
- D
Immunoblot analysis of EphA2, NLRP3, IL‐1β, and caspase‐1 in lysates or supernatant of AECs; β‐actin served as a loading control throughout. Mock indicates unstimulated cells. MSU was added for 8 h after 200 ng/ml LPS priming for 12 h. Reovirus was added for 8 h. Ephrin A1–Fc was added 0.4 μg/ml for 4 h before harvest.
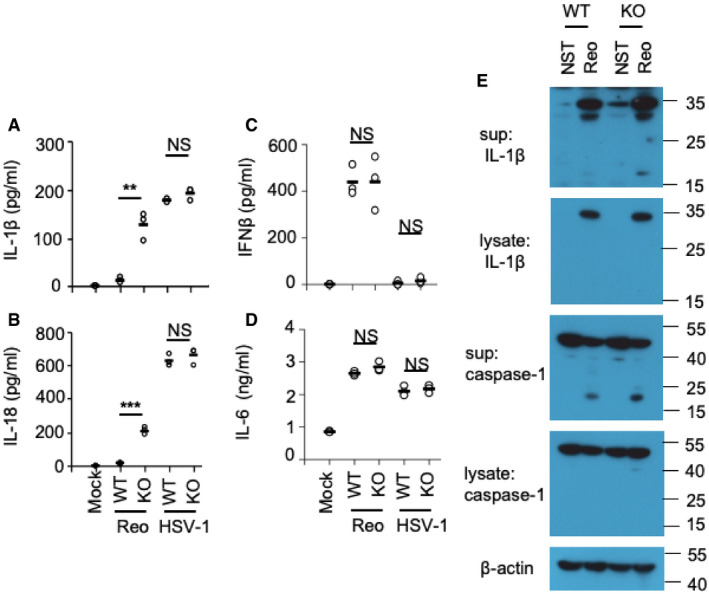
- A–D
ELISA of IL‐1β, IL‐18, IFN‐β, and IL‐6 in the supernatant of AECs, which were stimulated for 16 h with the RNA virus reovirus (MOI = 5) or the DNA virus HSV‐1 (MOI = 5). n = 3 primary samples.
- E
Immunoblot analysis of IL‐1β and caspase‐1 in AEC lysate or supernatant; β‐actin served as a loading control throughout.
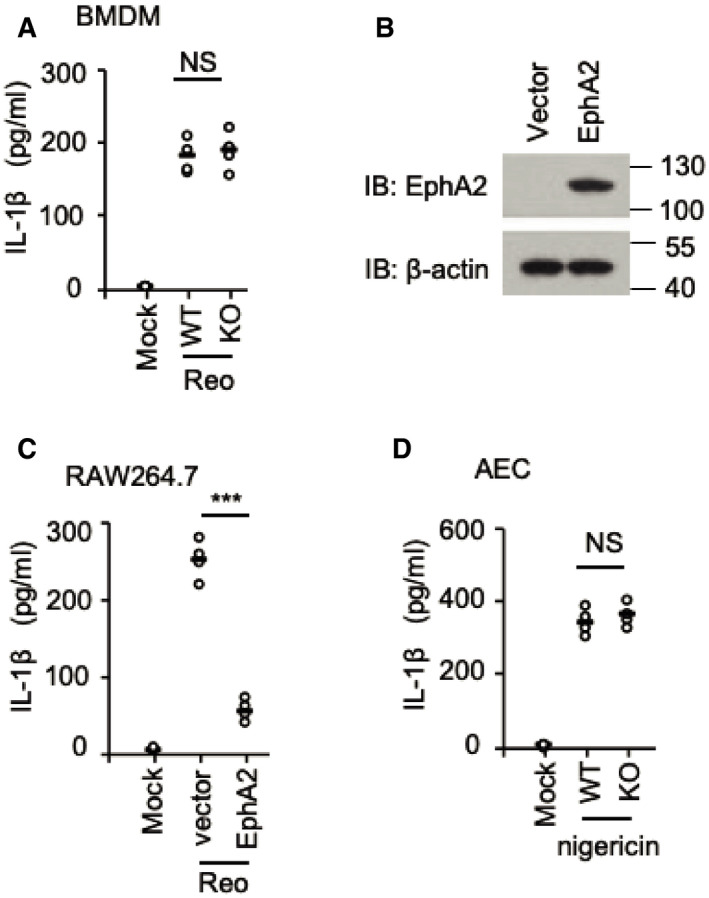
ELISA of IL‐1β in the supernatant of BMDM cells from wild‐type (WT) and EphA2‐knockout (KO) mice (n = 4 per strain) stimulated for 16 h with the RNA virus reovirus (MOI = 5).
Immunoblot analysis of EphA2 in lysates of the RAW264.7 cell line; β‐actin served as a loading control throughout. Cells were transfected with HA vector or HA‐EphA2 plasmid.
ELISA of IL‐1β in the supernatant of the RAW264.7 cells transfected with HA vector or HA‐EphA2 plasmid and stimulated for 16 h with the RNA virus reovirus (MOI = 5).
ELISA of IL‐1β in the supernatant of AECs from wild‐type (WT) and EphA2‐knockout (KO) mice (n = 4 per strain) treated with LPS (200 ng/ml, 4 h) and nigericin (7.5 mM, 1 h).
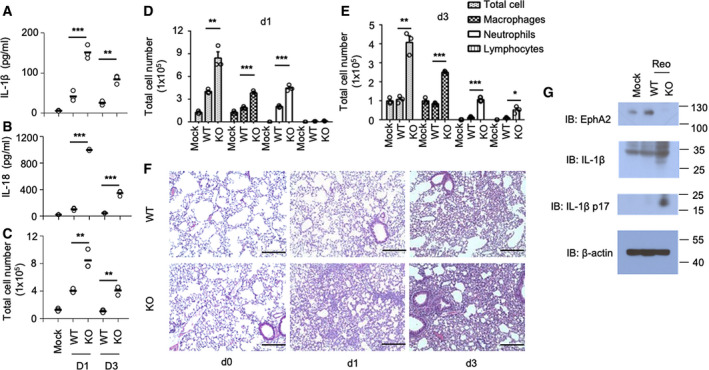
- A, B
ELISA of IL‐1β and IL‐18 in BALF samples from wild‐type (WT) and EphA2‐knockout (KO) mice (n = 3 per strain) on day 1 and day 3 after intranasal infection with reovirus (4 × 10⁴ PFU per mouse).
- C–E
Cell number and category of BALF samples from wild‐type (WT) and EphA2‐knockout (KO) mice (n = 3 per strain) on day 1 and day 3 after intranasal infection with reovirus (4 × 10⁴ PFU per mouse). Shown is mean ± SD.
- F
Hematoxylin and eosin (H&E) staining of lung sections from EphA2 +/+ and EphA2 −/− mice intranasally infected with reovirus (4 × 10⁴ PFU per mouse) on day 0, day 1, and day 3. Scale bars represent 200 μm.
- G
Immunoblot analysis of EphA2 and IL‐1β in lung homogenates from wild‐type (WT) and EphA2‐knockout (KO) mice on day 1 and day 3 of intranasal infection with reovirus (4 × 10⁴ PFU per mouse); β‐actin served as a loading control throughout.
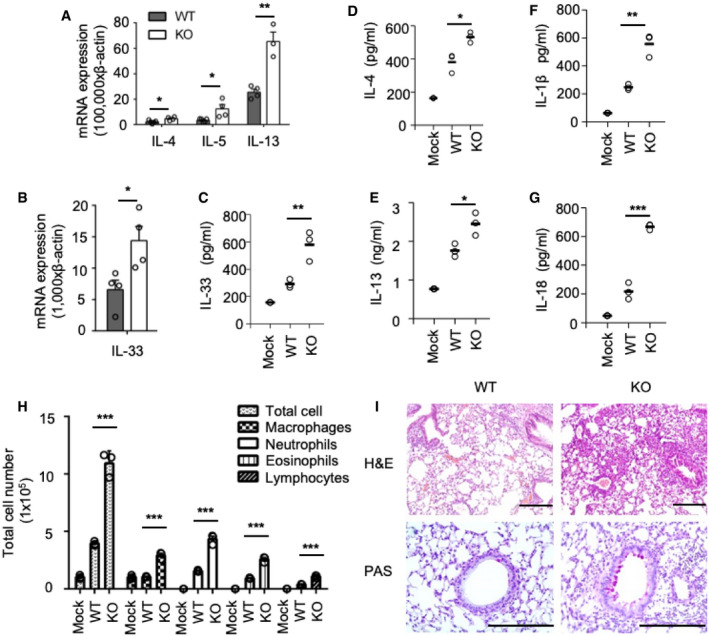
- A, B
Quantitative RT–PCR analysis of mRNA encoding various cytokines (IL‐4, IL‐5, IL‐13, IL‐33) in lung samples from wild‐type (WT) and EphA2‐knockout (KO) mice (n = 4 per strain) sensitized with ova; results presented relative to β‐actin. Shown is mean ± SD.
- C
ELISA of IL‐33 in lung tissue homogenate samples from wild‐type (WT) and EphA2‐knockout (KO) mice (n = 3 per strain) sensitized with ova.
- D–G
ELISA of IL‐4, IL‐13, IL‐1β, and IL‐18 in lung tissue homogenate samples from wild‐type (WT) and EphA2‐knockout (KO) mice (n = 3 per strain) sensitized with ova.
- H
Cell number and category of BALF samples from wild‐type (WT) and EphA2‐knockout (KO) mice (n = 3 per strain) sensitized with ova. Shown is mean ± SD.
- I
H&E staining and PAS staining of lung sections from wild‐type (WT) and EphA2‐knockout (KO) mice sensitized with ova. Scale bars represent 200 μm.
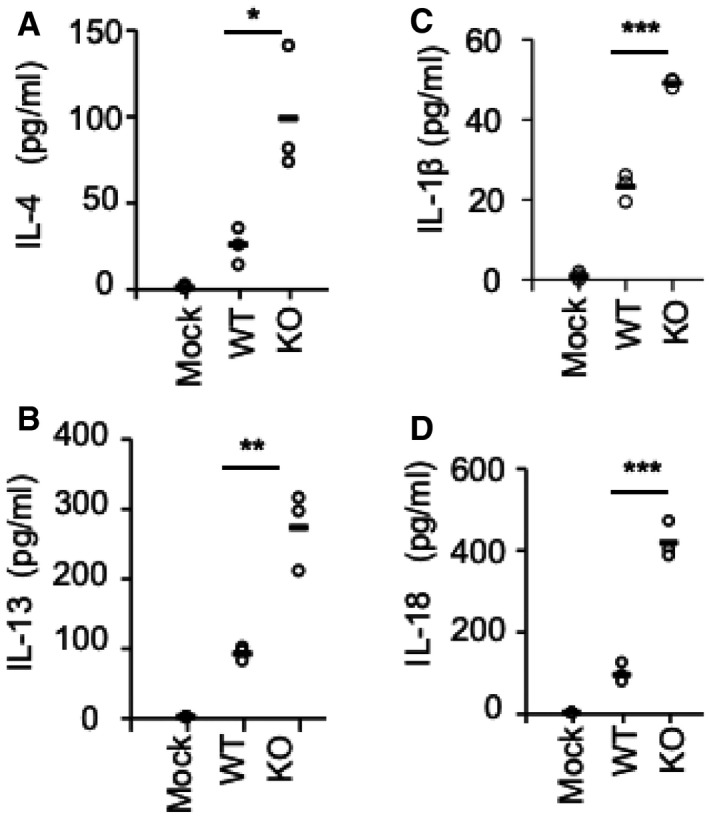
- A–D
ELISA of IL‐4, IL‐13, IL‐1β, and IL‐18 in BALF samples from wild‐type (WT) and EphA2‐knockout (KO) mice (n = 3 per strain) sensitized with ova. Each symbol represents an independent experiment; small horizontal lines indicate the average of triplicates. *P < 0.05, **P < 0.01, and ***P < 0.001 (unpaired t‐test). Data represent three independent biological replicates.
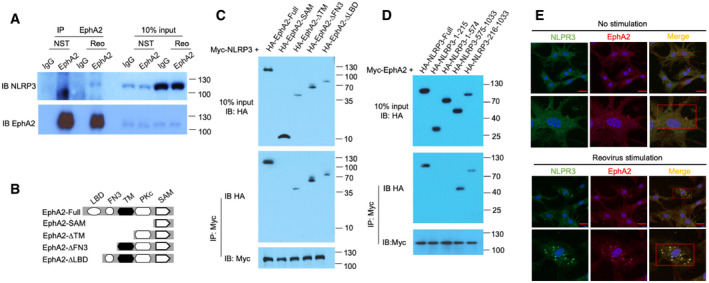
Immunoblot analysis of proteins precipitated with anti‐EphA2 or IgG (control) from whole‐cell lysates of AECs from wild‐type mice stimulated with reovirus (MOI = 5) for 3 h. Input, 10% of the AEC lysate.
Full‐length EphA2 and serial truncations of EphA2 with deletion of various domains.
The indicated plasmids of HA‐tagged full‐length EphA2 and EphA2 truncation mutants were respectively transfected into HEK293T cells along with Myc‐tagged NLRP3, and then, cell lysates were immunoprecipitated with anti‐Myc antibody, followed by Western blot analysis with anti‐HA antibody and anti‐Myc antibody.
The indicated plasmids of HA‐tagged full‐length NLRP3 and NLRP3 truncation mutants were respectively transfected into HEK293T cells along with Myc‐tagged EphA2, and then, cell lysates were immunoprecipitated with anti‐Myc antibody, followed by Western blot analysis with anti‐HA antibody and anti‐Myc antibody.
Colocalization of endogenous EphA2 and NLRP3 in AECs. AECs were unstimulated or stimulated with reovirus for 2 h before confocal microscopy analysis. EphA2 was stained with rabbit anti‐EphA2 (1:500), followed by Alexa Fluor 594 goat anti‐rabbit secondary antibody (red), while NLRP3 was stained with mouse anti‐NLRP3 (1:500), followed by Alexa Fluor 488 goat anti‐mouse secondary antibody (green). DAPI (4′,6‐diamidino‐2‐phenylindole) served as the nuclei marker (blue). Scale bars represent 20 μm. The Pearson correlation coefficient and the Mander overlap coefficient in the upper red box are 0.5, and 0.95, respectively, and in the lower red box are 0.78 and 0.94, respectively.
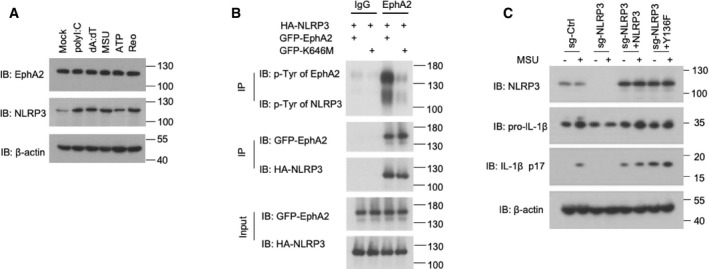
Immunoblot analysis of EphA2 and NLRP3 in AEC lysate; β‐actin served as a loading control throughout. Mock indicates unstimulated cells. 1 μg/ml polyI:C, 1 μg/ml dA:dT, and 500 ng/ml MSU were added for 10 h after 200 ng/ml LPS priming for 12 h. 5 mM ATP was added for 30 min. Reovirus was added for 10 h.
Proteins were eluted and analyzed by immunoblot analysis with anti‐p‐Tyr antibody, anti‐HA antibody, and anti‐GFP antibody after in vitro kinase assay.
Immunoblot analysis of NLRP3, IL‐1β, and cleaved IL‐1β p17 in lysates of the 16HBE cell line; β‐actin served as a loading control throughout. Cells were treated with a CRISPR vector control (sg‐Ctrl) or sgRNA targeting NLRP3 (sg‐NLRP3) with or without overexpression of Myc‐tagged NLRP3 or NLRP3 Y136. 500 ng/ml MSU was added for 3 h after 200 ng/ml LPS priming for 12 h.
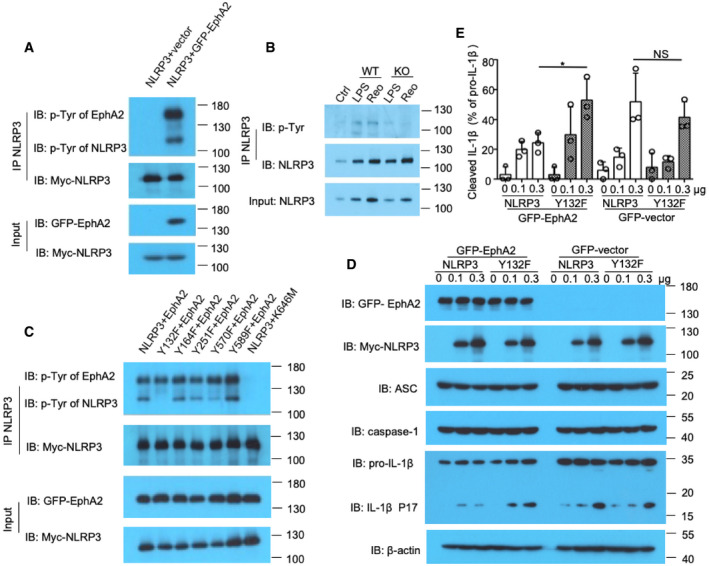
The indicated plasmids of Myc‐tagged NLRP3 and GFP‐tagged EphA2 were transfected into HEK293T cells, and then, cell lysates were immunoprecipitated with the anti‐Myc antibody, followed by Western blot analysis with anti‐p‐Tyr, anti‐GFP, and anti‐Myc antibodies.
Immunoblot analysis of p‐Tyr of NLRP3 precipitated with anti‐NLRP3 antibody in AECs without (Ctrl) or with LPS stimulation or reovirus (Reo) infection.
The indicated plasmids of Myc‐tagged wild‐type NLRP3 or its mutants Y132F, Y164F, Y251F, Y570F, and Y589F were respectively transfected into HEK293T cells along with GFP‐tagged EphA2, and then, cell lysates were immunoprecipitated with the anti‐Myc antibody, followed by Western blot analysis with the anti‐p‐Tyr antibody, anti‐HA antibody, and anti‐Myc antibody.
Immunoblot analysis of EphA2, ASC, NLRP3, caspase‐1, and IL‐1β in HEK293T cells co‐transfected with 200 ng EphA2, 40 ng ASC, 40 ng caspase‐1, and 200 ng IL‐1β, vector, or wild‐type NLRP3 or Y132F as indicated. The position of protein markers (shown in kDa) is indicated on the right‐hand side.
Densitometry analysis of (D). *P < 0.05 (unpaired t‐test). NS means no statistical difference. Shown is mean ± SD. Data represent three independent biological replicates.
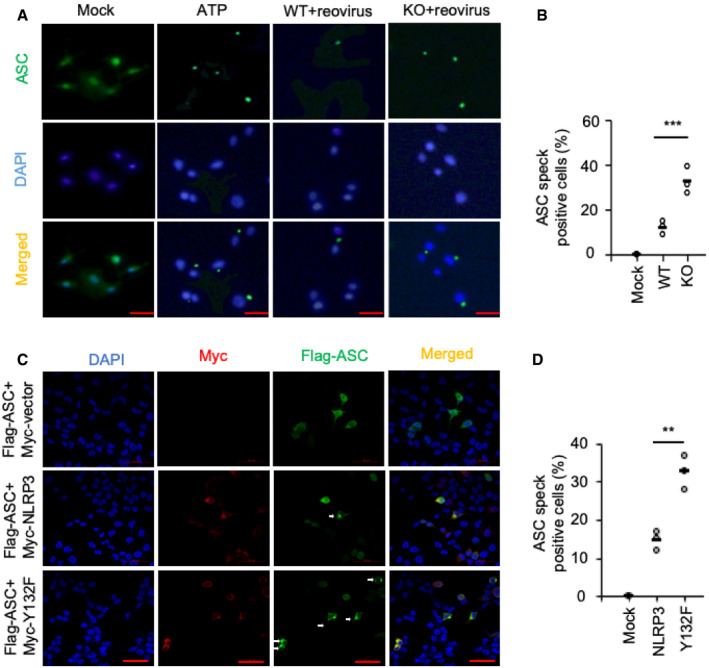
- A, B
Confocal microscopy analysis of AECs uninfected or infected with reovirus (MOI = 20) for 3 h. AECs primed with LPS and stimulated with ATP for 30 min severed as a positive control. ASC was stained with mouse anti‐ASC (1:200), followed by Alexa Fluor 488 goat anti‐mouse secondary antibody (green). DAPI served as the nuclei marker (blue).
- C, D
Confocal microscopy analysis of HEK293T cells transfected with Flag‐ASC and Myc‐tagged vector or Myc‐tagged NLRP3 or Myc‐tagged NLRP3 Y132F. Cells were stained with anti‐FLAG (1:200) and anti‐Myc (1:200), followed by Alexa Fluor 488 goat anti‐rabbit secondary antibody (green) or Alexa Fluor 594 goat anti‐mouse secondary antibody (red). DAPI served as the nuclei marker (blue).
Comment in
-
Hijacking the NLRP3 inflammasome: a mechanism underlying viral respiratory disease?EMBO Rep. 2020 Jul 3;21(7):e50645. doi: 10.15252/embr.202050645. Epub 2020 May 17. EMBO Rep. 2020. PMID: 32419206 Free PMC article.
References
-
- Proud D, Leigh R (2011) Epithelial cells and airway diseases. Immunol Rev 242: 186–204 - PubMed
-
- Holgate ST (2011) The sentinel role of the airway epithelium in asthma pathogenesis. Immunol Rev 242: 205–219 - PubMed
-
- Chung KF, Adcock IM (2008) Multifaceted mechanisms in COPD: inflammation, immunity, and tissue repair and destruction. Eur Respir J 31: 1334–1356 - PubMed
-
- Guarda G, Dostert C, Staehli F, Cabalzar K, Castillo R, Tardivel A, Schneider P, Tschopp J (2009) T cells dampen innate immune responses through inhibition of NLRP1 and NLRP3 inflammasomes. Nature 460: 269–273 - PubMed
Publication types
MeSH terms
Substances
Associated data
- Actions
Grants and funding
- 519418/Lupus Research Alliance (LRA)/International
- 81621004/National Natural Science Foundation of China (NSF)/International
- R01 AI080779/AI/NIAID NIH HHS/United States
- 2019B020226002/Guangdong Province Key Research and Development Program/International
- 81830090/National Natural Science Foundation of China (NSF)/International
- R01AI080779/HHS | NIH | National Institute of Allergy and Infectious Diseases (NIAID)/International
- 2016YFA0502100/National Key Research and Development Program of China/International
- 81520108022/National Natural Science Foundation of China (NSF)/International
- 2017YFA0505600/National Key Research and Development Program of China/International
- 2017YFC0908503/National Key Research and Development Program of China/International
LinkOut - more resources
Full Text Sources
Other Literature Sources
Miscellaneous
