. 2020 Jun;28(6):1129-1140.
doi: 10.1002/oby.22804. Epub 2020 Apr 30.

Thigh Adipocyte Size is Inversely Related to Energy Intake and Respiratory Quotient in Healthy Women

Affiliations

Thigh Adipocyte Size is Inversely Related to Energy Intake and Respiratory Quotient in Healthy Women

Alessio Basolo et al. Obesity (Silver Spring). 2020 Jun.

Abstract

Objective: The relationship between adipocyte size and ad libitum energy intake has not been previously examined. This study hypothesized an inverse relationship between adipocyte size and daily energy intake (DEI).

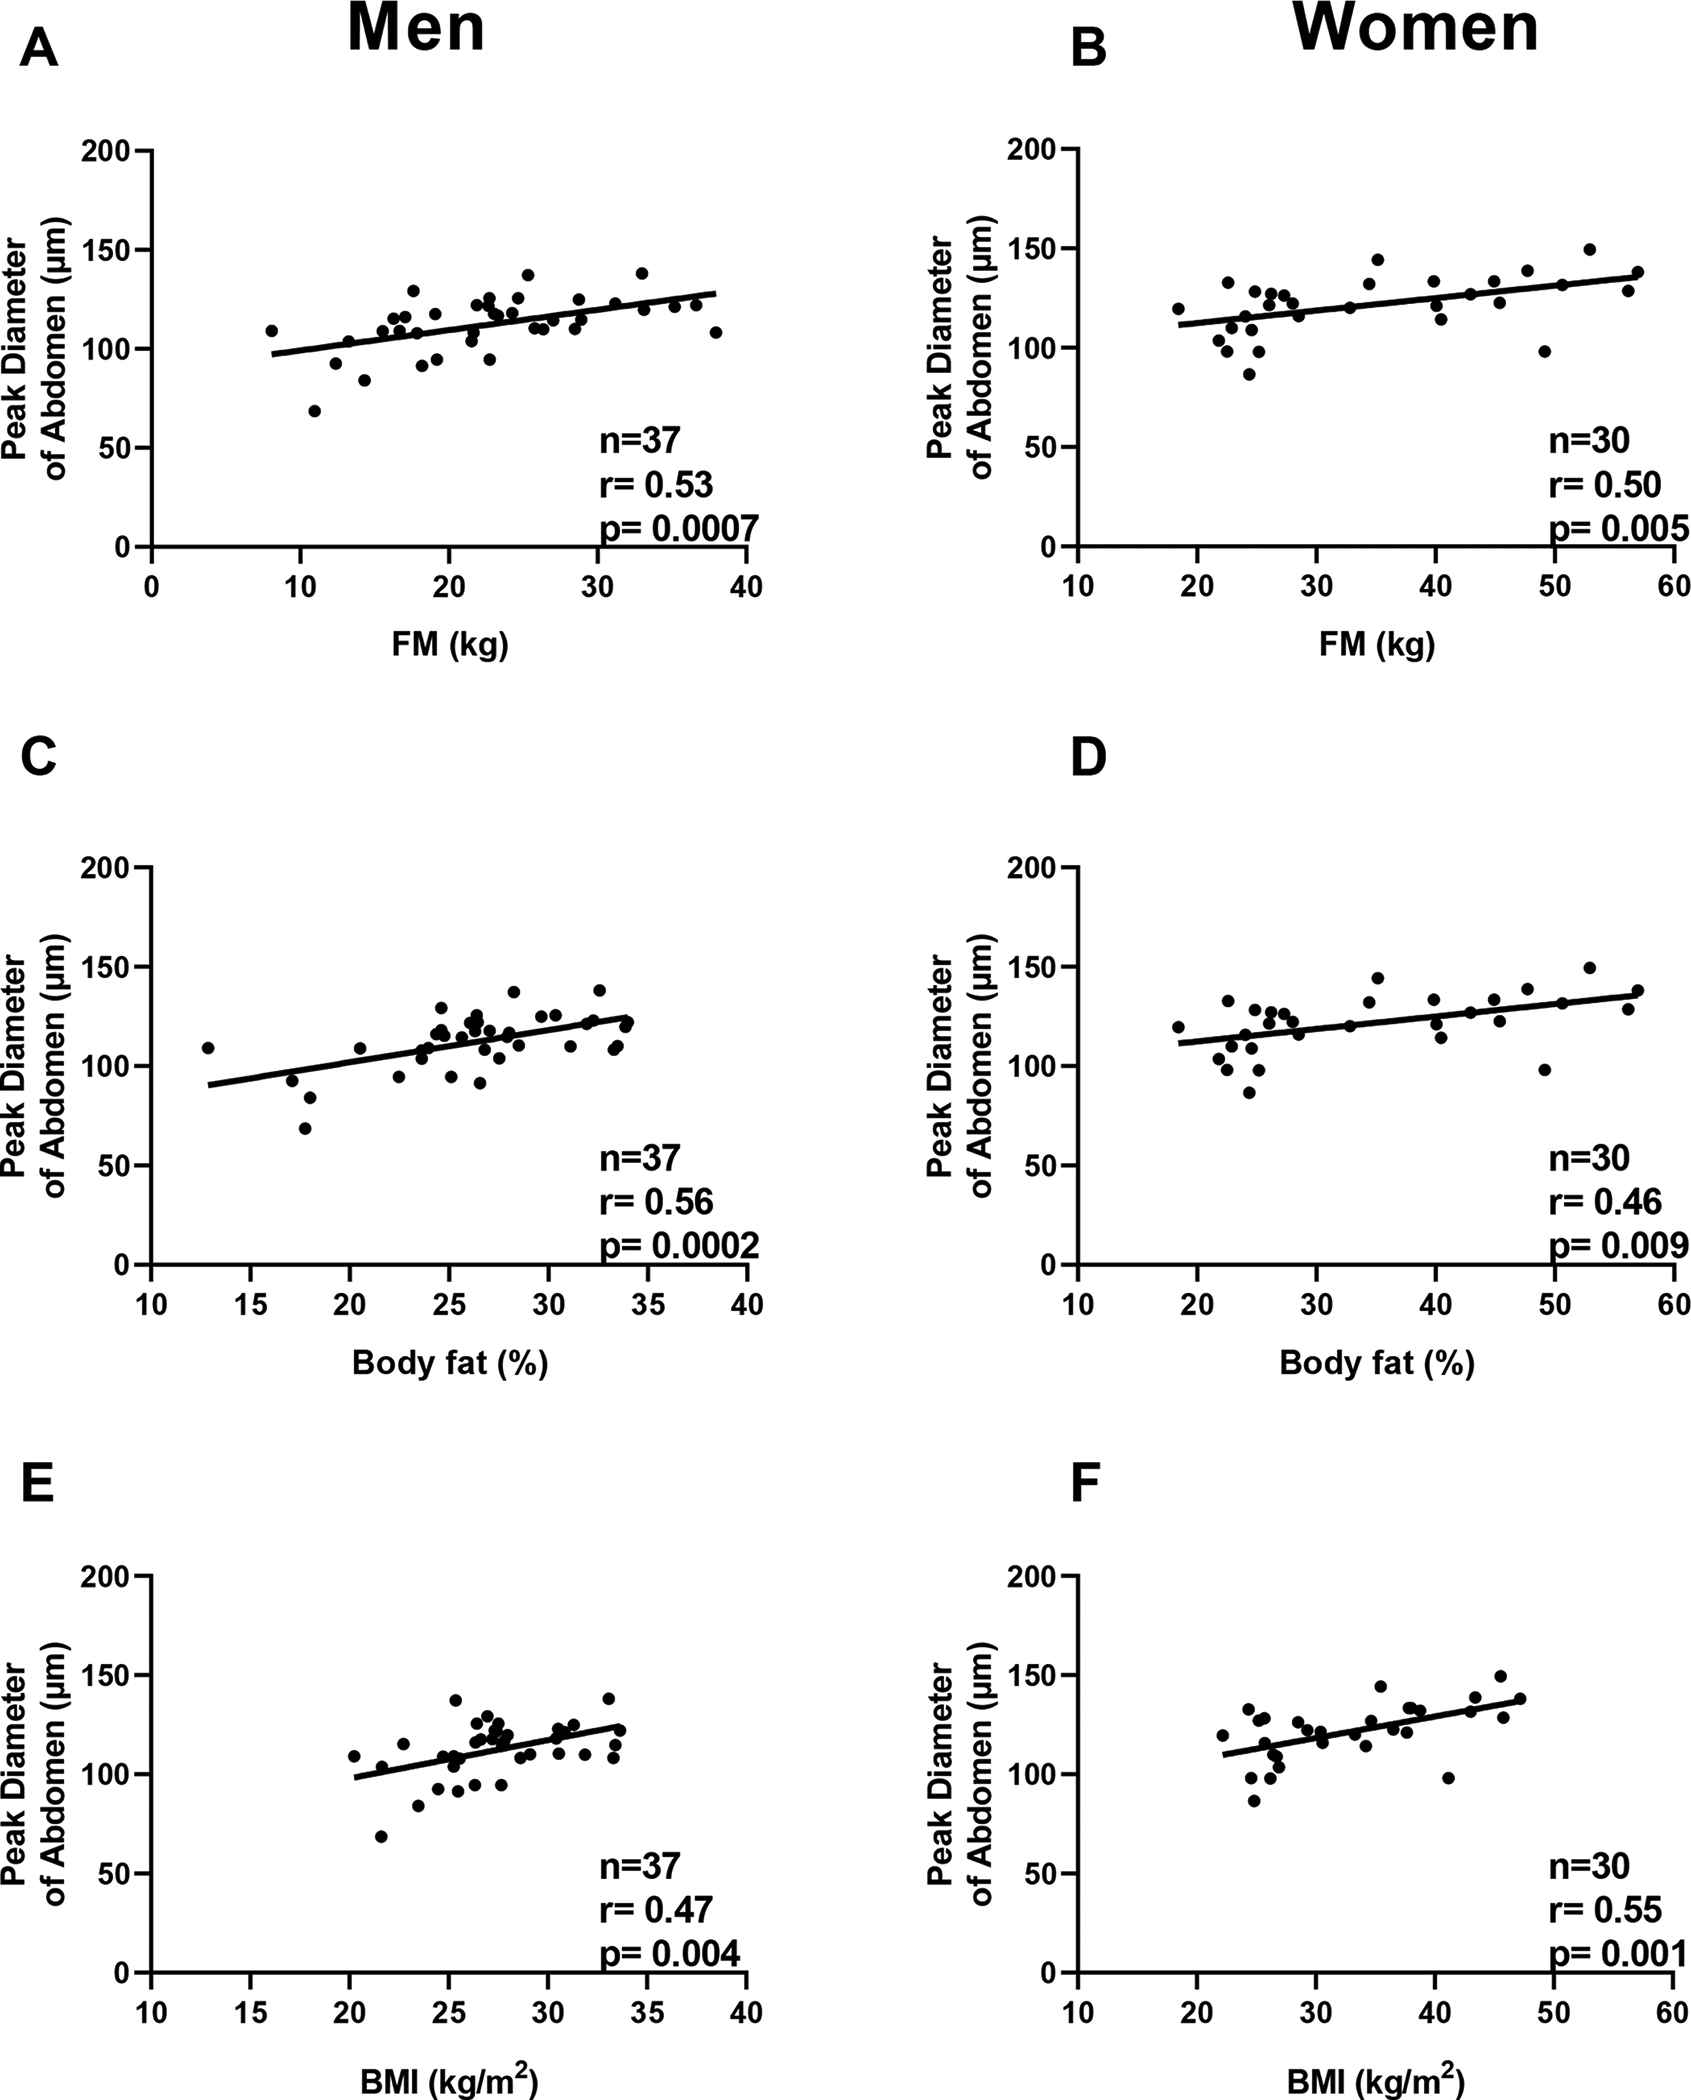
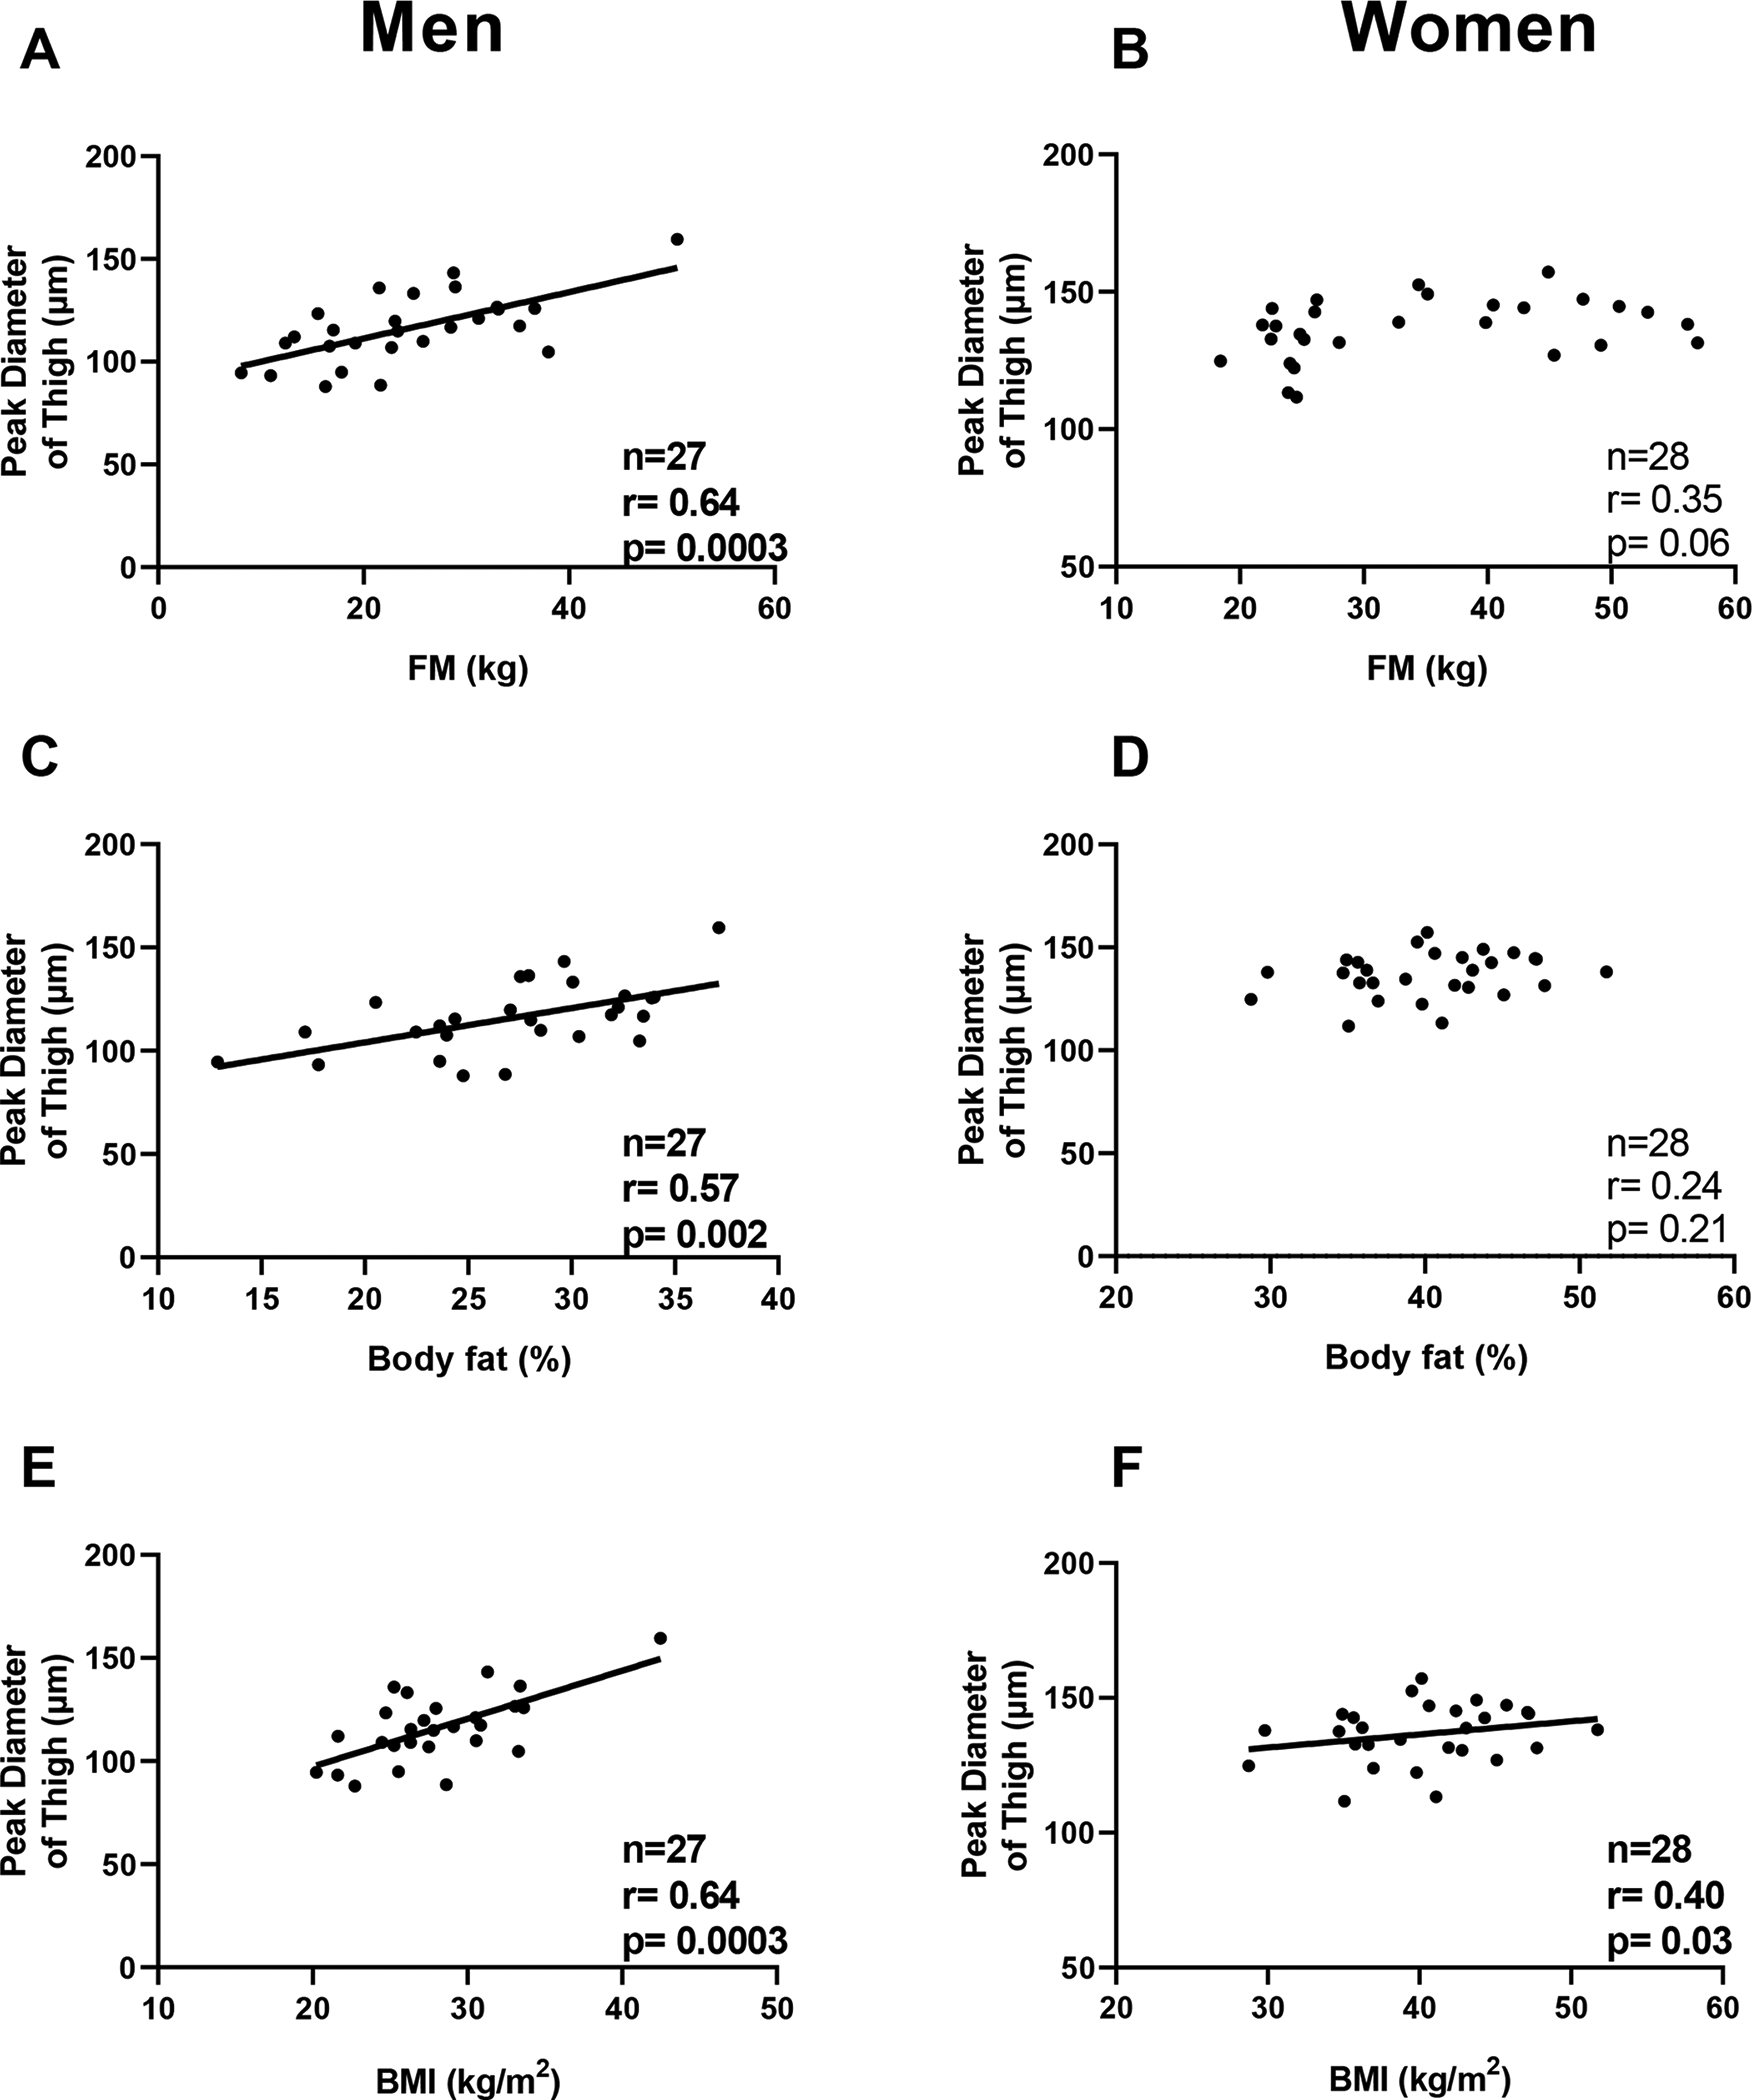
Methods: Seventy healthy adults (39 men and 31 women; BMI 30.0 [SD 6.3]) underwent dual-energy x-ray absorptiometry and subcutaneous fat biopsies from the abdomen and thigh. Osmium-fixed adipocytes were sized with a Coulter counter. Volunteers self-selected food from a vending machine paradigm as the only source of energy intake over 3 days as inpatients. Volunteers also had 24-hour respiratory quotient (RQ) measured in a whole-room indirect calorimeter.

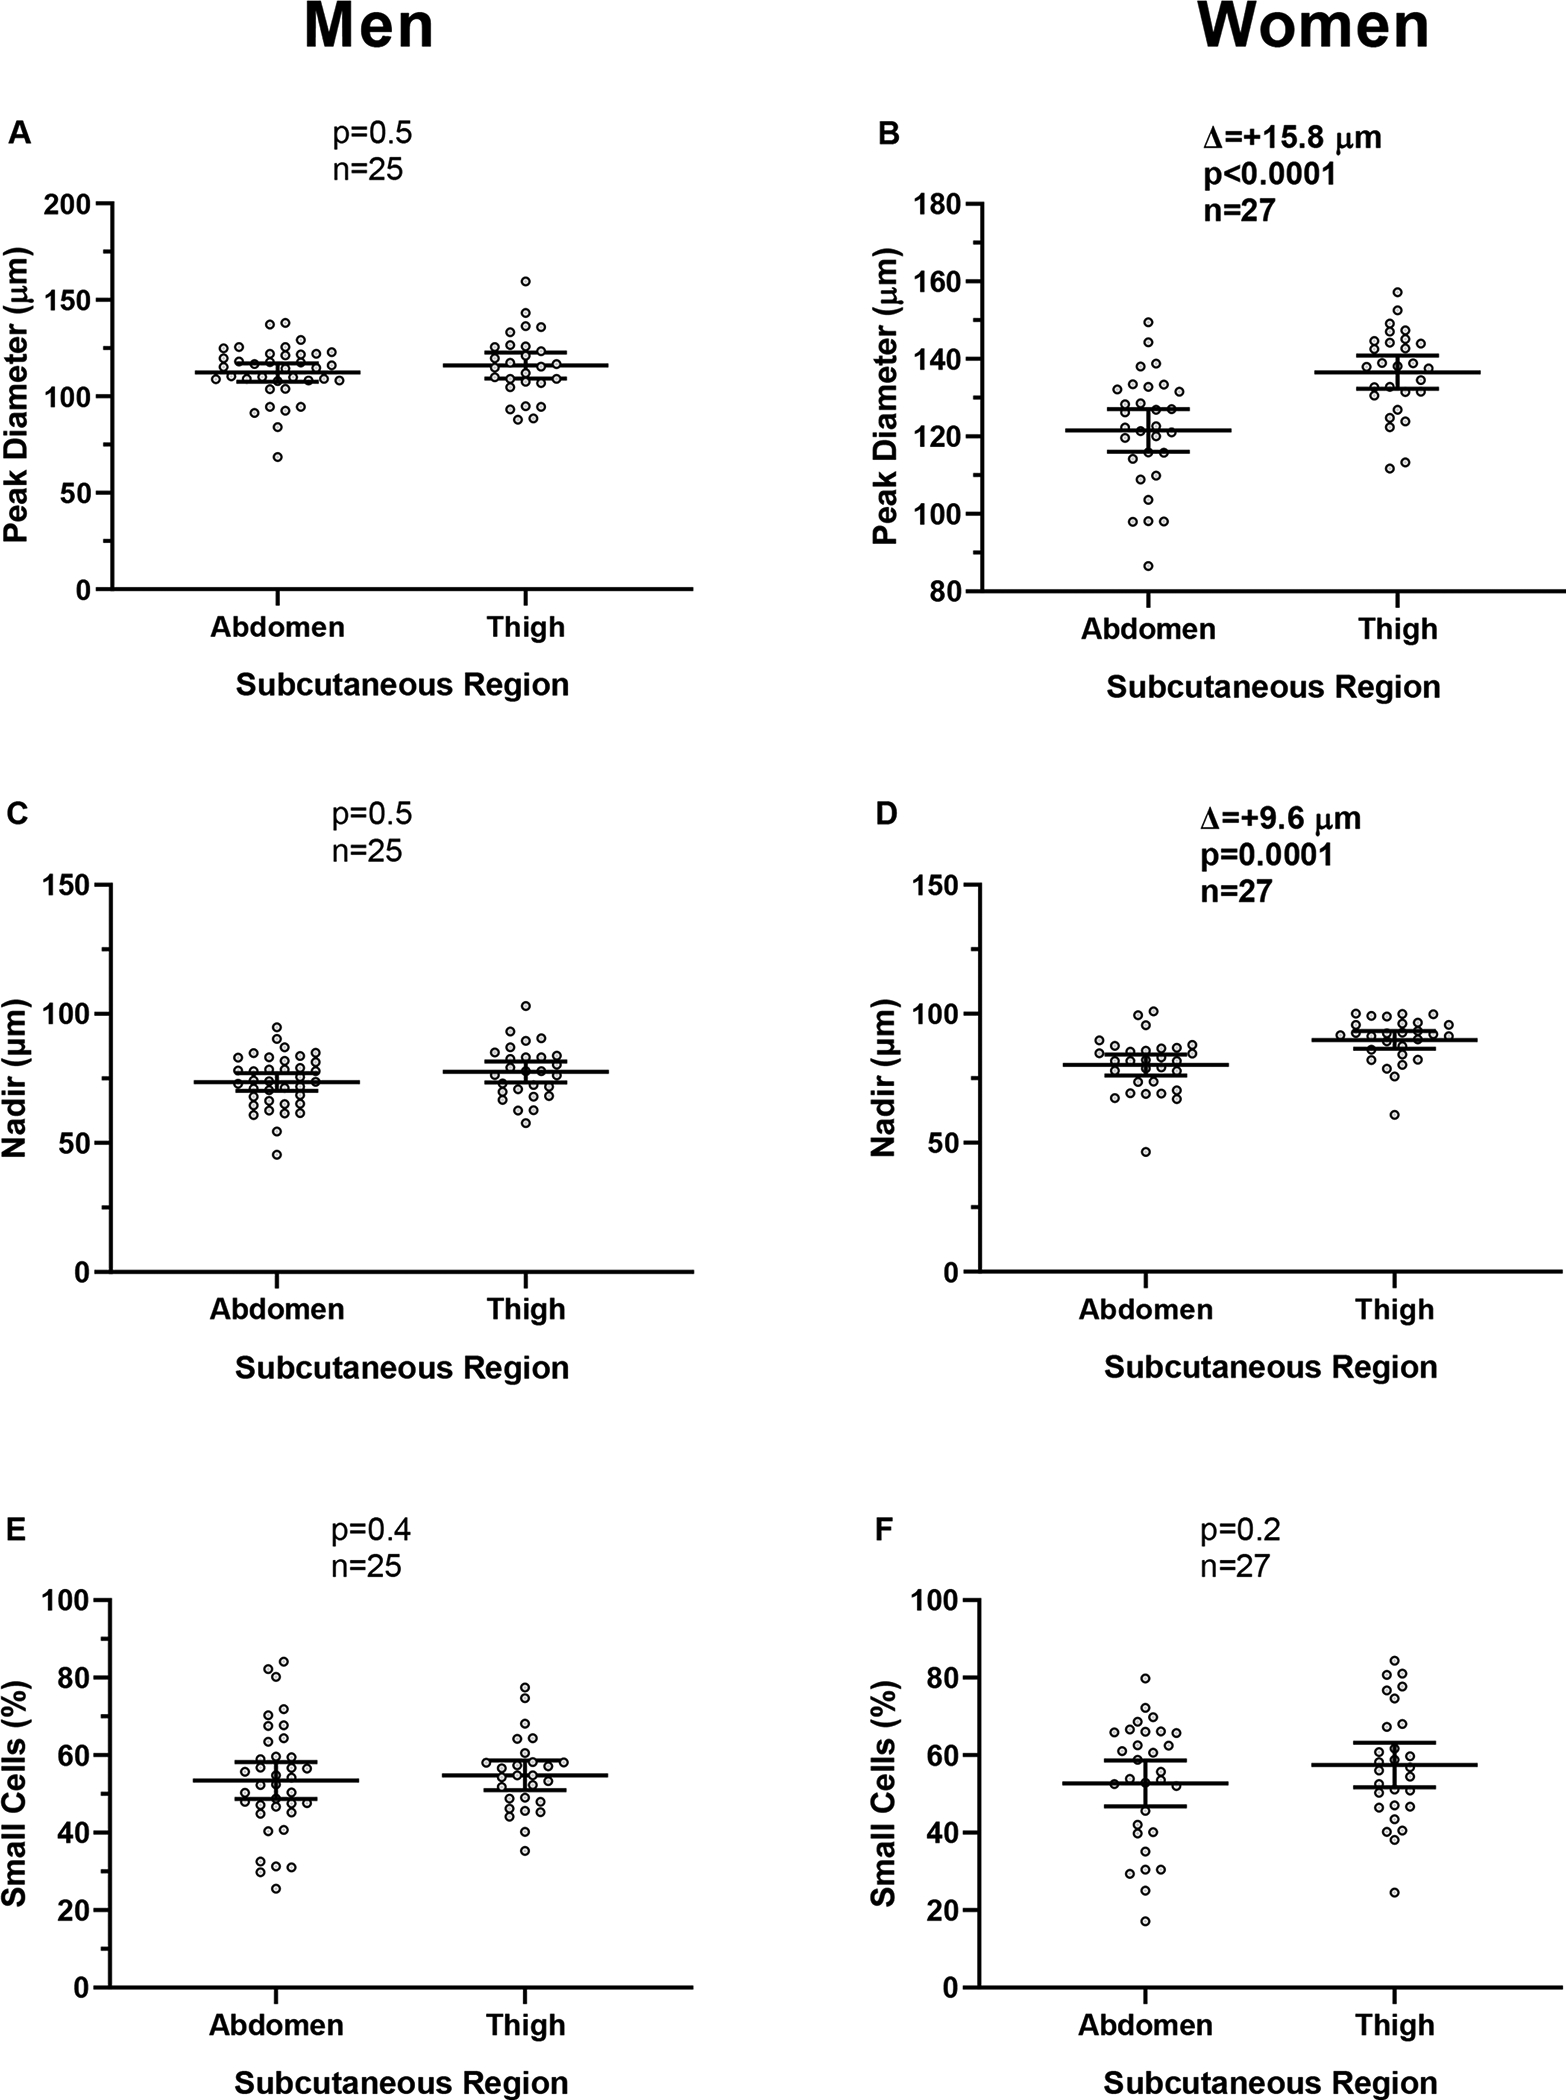
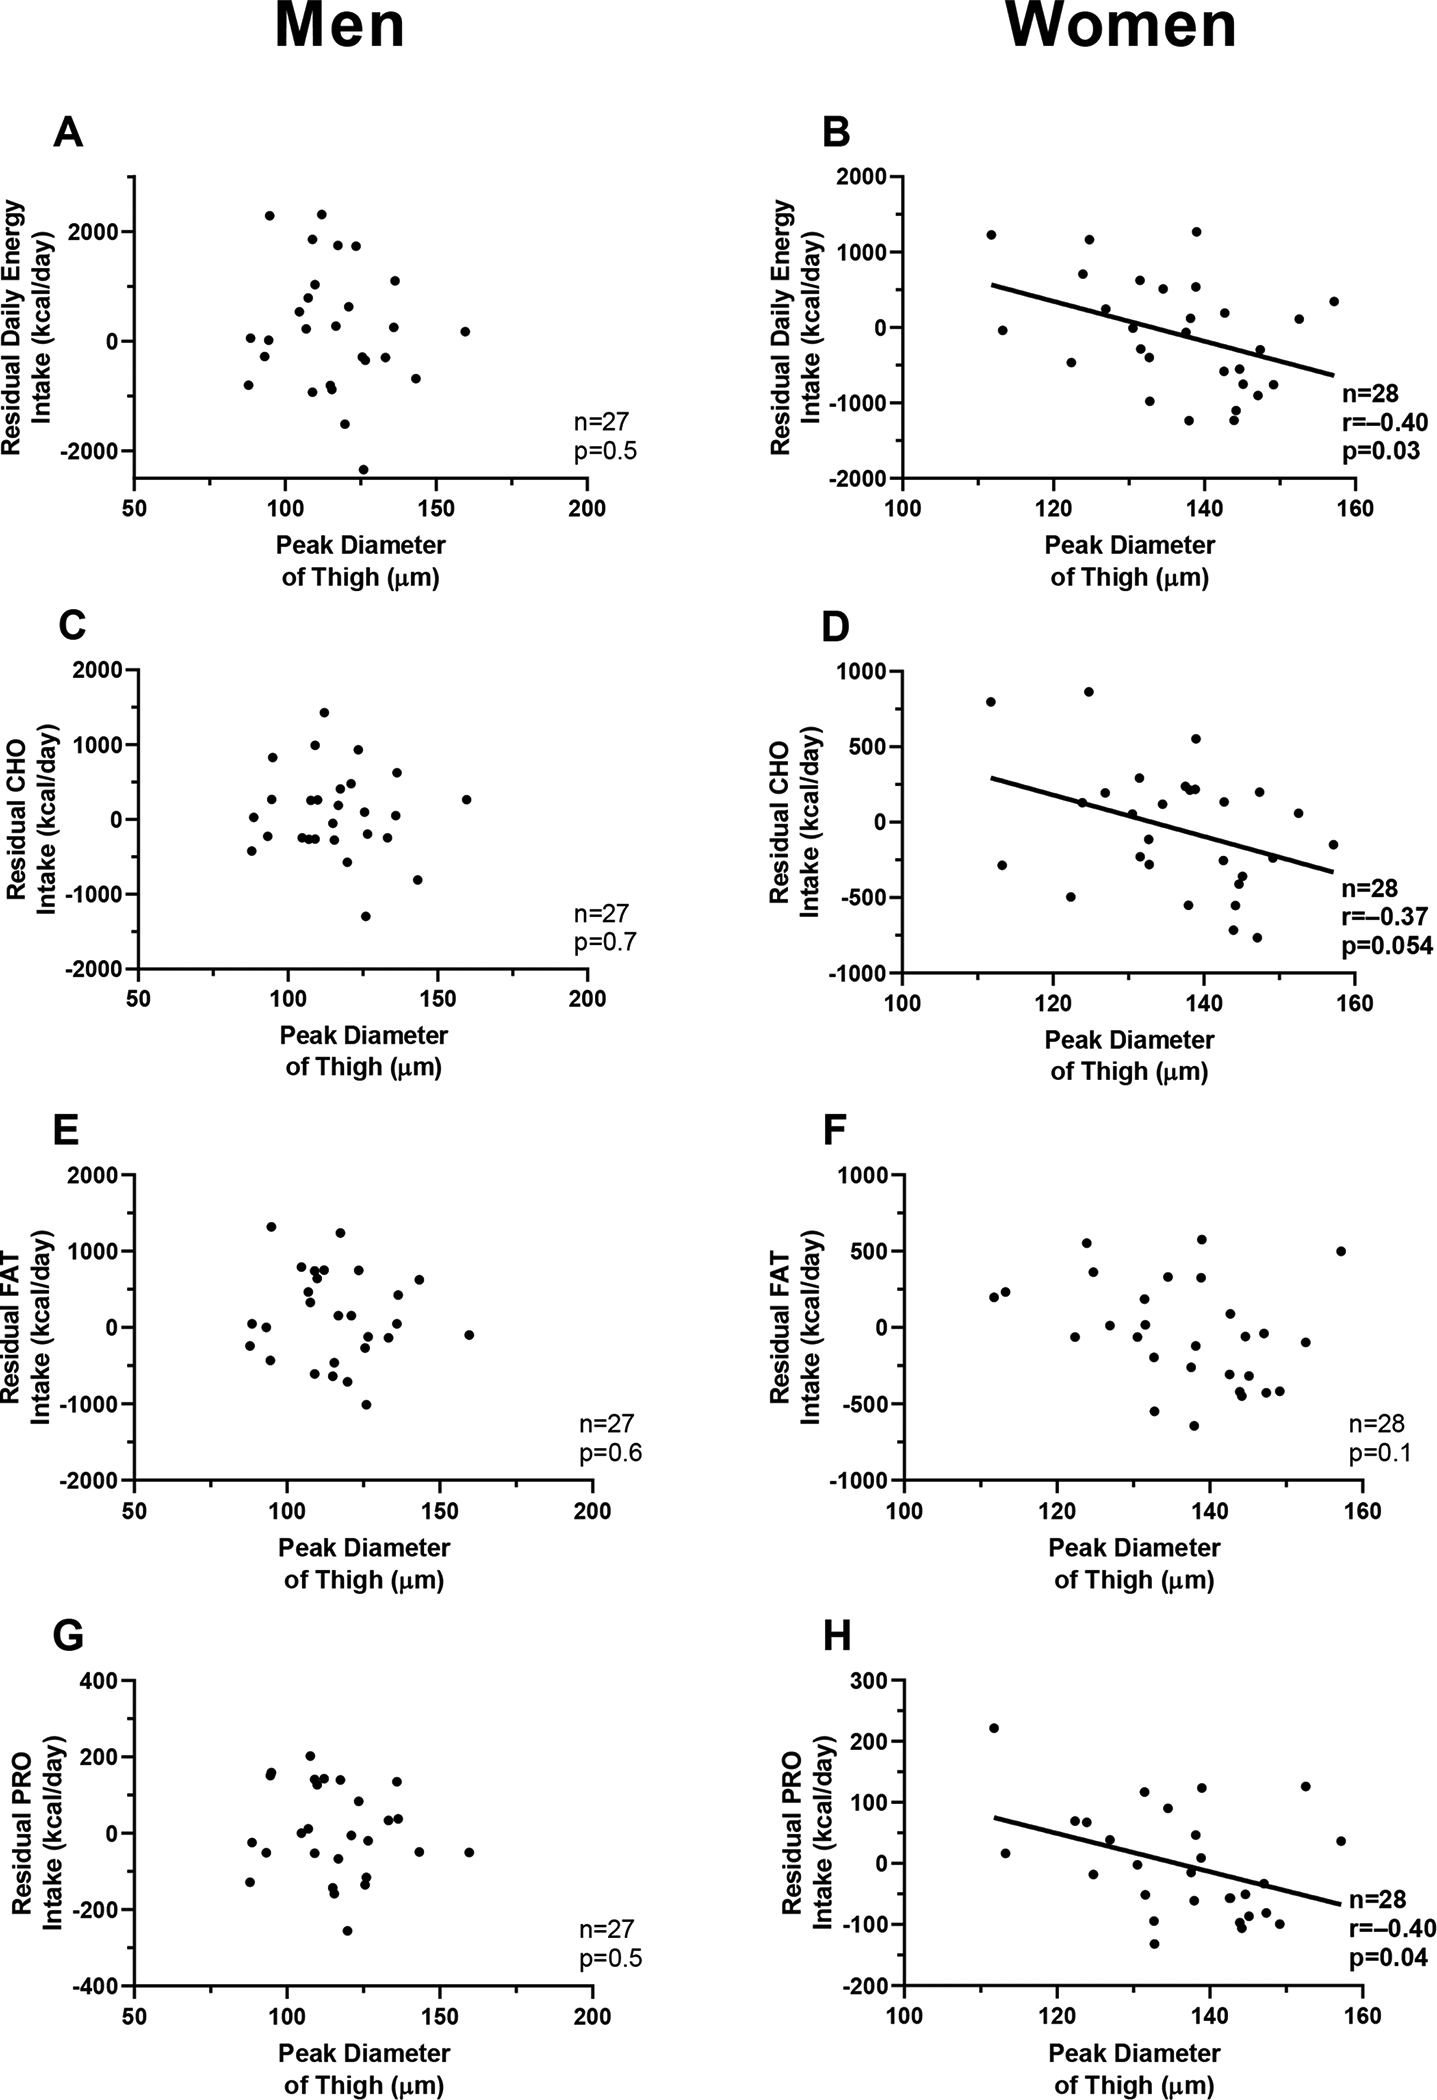
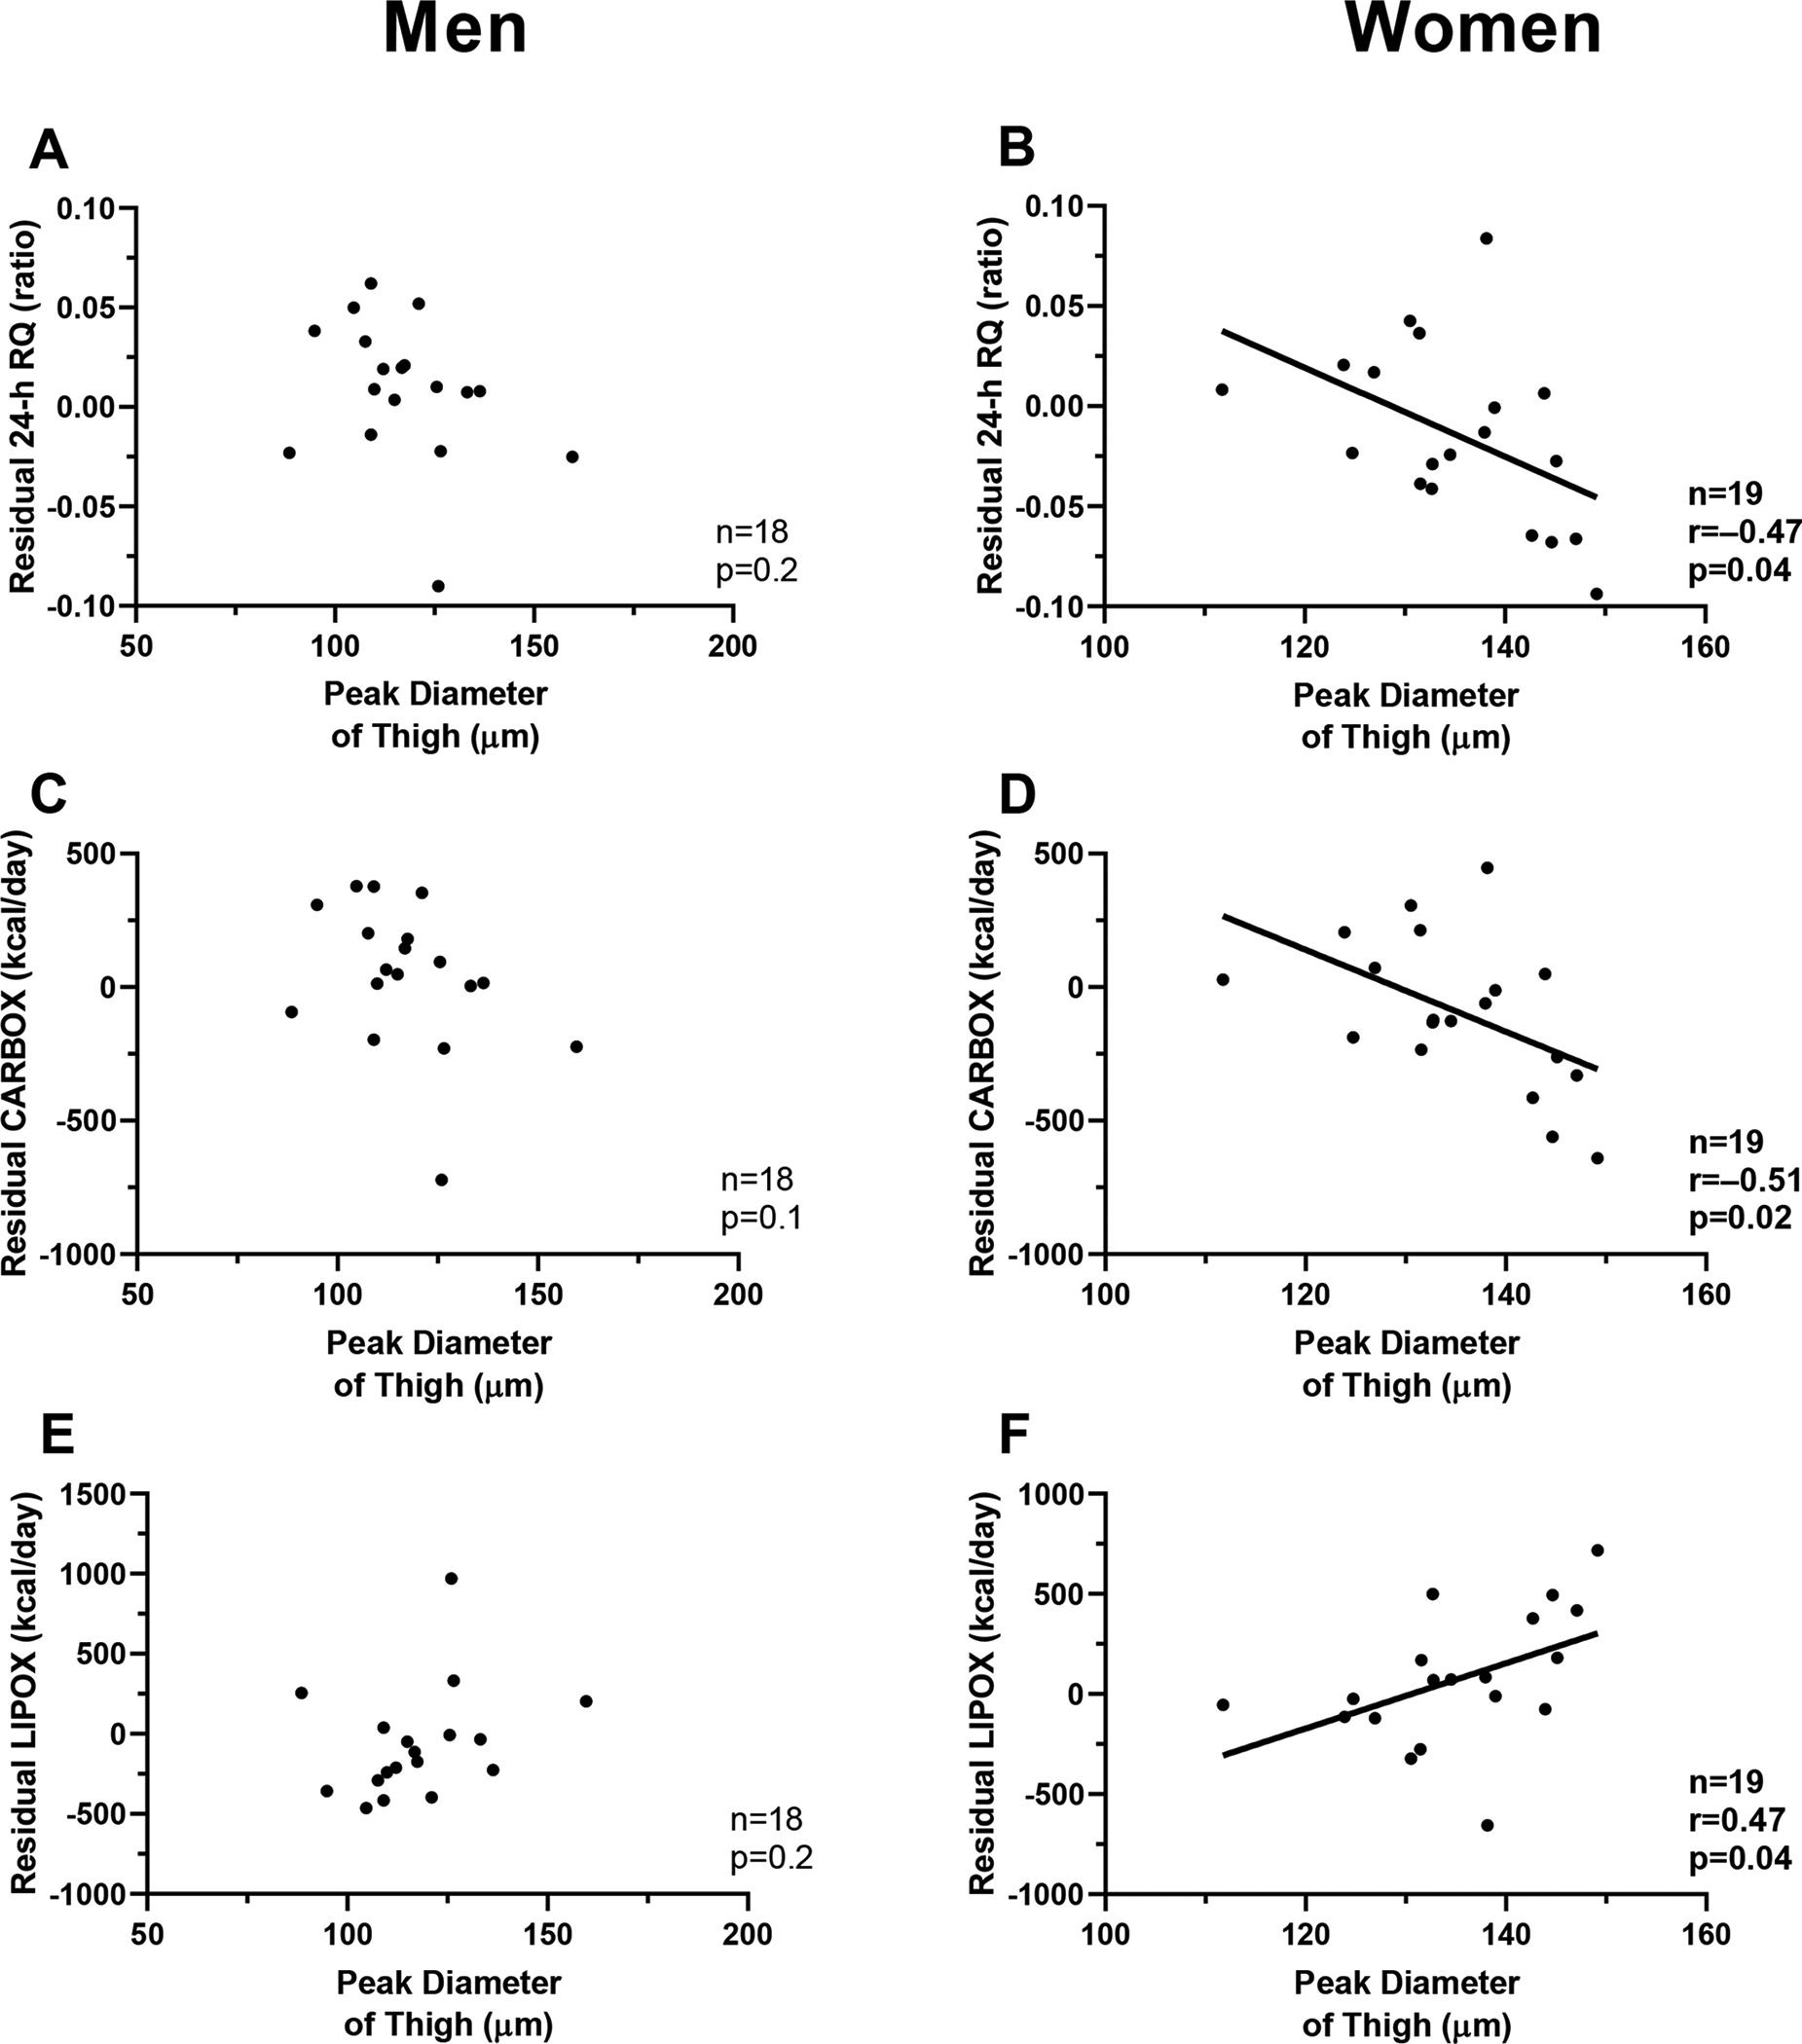
Results: In women, the large cell peak diameter of the thigh depot was greater than that of the abdominal depot (Δ = +15.8 μm; P < 0.0001). In women, thigh peak diameter was inversely associated with DEI (β = -264.7 kcal/d per 10-μm difference; P = 0.03) after adjusting for demographics and body composition. The thigh peak diameter in women was associated with 24-hour RQ (r = -0.47, P = 0.04) after adjusting for demographics, body composition, and 24-hour energy balance. These associations did not extend to men or the abdominal depot.

Conclusions: In women, thigh adipocyte size was associated with reduced DEI and 24-hour RQ, indicating a special role for thigh fat in women. This depot-specific sexual dimorphism indicates common regulation of energy intake and adipocyte size in the thigh region of women.


Conflict of interest statement

Disclosure Statement: The authors declared no conflict of interest.

Figures

Fig. 1.
Fig. 1.. Adipocyte size by sex
Panel A-C-E. Average difference (Δ) between abdominal and thigh regions for peak diameter (panel A), nadir diameter (panel C), and percent small cells (panel E) in men. Panel B-D-F. Average difference (Δ) between abdominal and thigh regions for peak diameter (panel B), nadir diameter (panel D) and percent small cells (panel F) in women. Paired t-test was used to assess differences between regions.
Fig. 2.
Fig. 2.. Relationships between peak diameter of adipocytes (abdomen) and adiposity measures in men and women.
Panel A-C-E. Relationships between peak diameter of adipocyte size in the abdomen and fat mass (panel A), body fat percentage (panel C), and body mass index (panel E) in men. Panel B-D-F. Relationships between peak diameter of the thigh adipocyte size and fat mass (panel B), body fat percentage (panel D), and body mass index (panel F) in women. Pearson’s correlation coefficient (r) is reported along with its significance (p).
Fig. 3.
Fig. 3.. Relationships between peak diameter of adipocytes (thigh) and adiposity measures in men and women
Panel A-C-E. Relationships between peak diameter of adipocyte size in the thigh and fat mass (panel A), body fat percentage (panel C), and body mass index (panel E) in men. Panel B-D-F. Relationships between peak diameter of the thigh adipocyte size and fat mass (panel B), body fat percentage (panel D), and body mass index (panel F) in women. Pearson’s correlation coefficient (r) is reported along with its significance (p).
Fig. 4.
Fig. 4.. Relationships between peak diameter of thigh adipocytes and ad libitum food intake, by sex
Panel A-C-E-G. Relationships between peak diameter of the thigh adipocytes and residuals of daily energy intake (panel A), carbohydrate intake (panel C), fat intake (panel E), and protein intake (panel G) in men. Panel B-D-F-H. Relationships between peak diameter of the thigh adipocytes and residuals of daily energy intake (panel B), carbohydrate intake (panel D), fat intake (panel F) and protein intake (panel H) in women. Pearson’s correlation coefficient (r) is reported along with its significance (p). Residuals of food intake were calculated using linear regression adjusting for age, race, fat mass, and fat-free mass. Linear regression analysis was used to calculate residuals of CARBOX and LIPOX after adjustment for age, sex, race, fat mass, and fat-free mass. RQ: respiratory quotient; CARBOX: carbohydrate oxidation; LIPOX: lipid oxidation The results in panels 4B, 4D, and 4H were not significant when considering a Bonferroni-corrected threshold for significance.
Fig. 5.
Fig. 5.. Relationships between peak diameter of thigh adipocytes and metabolic fuel selection near energy balance, by sex
Panel A-C-E. Relationships between peak diameter of the thigh adipocytes and residuals of 24-h respiratory quotient (panel A), carbohydrate oxidation (panel C), and lipid oxidation (panel E) in men. Panel B-D-F. Relationships between peak diameter of the thigh adipocytes and residuals of 24-h respiratory quotient (panel B), carbohydrate oxidation (panel D), and lipid oxidation (panel F) in women. Pearson’s correlation coefficient (r) is reported along with its significance (p). Linear regression analysis was used to calculate residuals of 24-h RQ after adjustment for age, race, body fat percentage and energy balance. Linear regression analysis was used to calculate residuals of CARBOX and LIPOX after adjustment for age, race, fat mass, and fat-free mass. RQ: respiratory quotient; CARBOX: carbohydrate oxidation; LIPOX: lipid oxidationThe results in panels 5B, 5D, and 5F were not significant when considering a Bonferroni-corrected threshold for significance.

References

    1. Finucane MM, Stevens GA, Cowan MJ, Danaei G, Lin JK, Paciorek CJ, et al. National, regional, and global trends in body-mass index since 1980: systematic analysis of health examination surveys and epidemiological studies with 960 country-years and 9· 1 million participants. The Lancet. 2011;377:557–67. - PMC - PubMed
    1. Wang YC, McPherson K, Marsh T, Gortmaker SL, Brown M. Health and economic burden of the projected obesity trends in the USA and the UK. The Lancet. 2011;378:815–25. - PubMed
    1. Blundell J Biology of the drive to eat. Implications for un derstanding human appetite and obesity. Ernahrungs Umschau. 2018;65:126–33.
    1. Schwartz MW, Woods SC, Porte D Jr, Seeley RJ, Baskin DG. Central nervous system control of food intake. Nature. 2000;404:661. - PubMed
    1. Stubbs RJ, Hopkins M, Finlayson GS, Duarte C, Gibbons C, Blundell JE. Potential effects of fat mass and fat-free mass on energy intake in different states of energy balance. Eur J Clin Nutr. 2018;72:698–709. - PubMed

Publication types

LinkOut - more resources