. 2020 Sep 2;11(5):1268-1286.
doi: 10.1080/19490976.2020.1747335. Epub 2020 Apr 30.

Gut microbiota derived metabolites contribute to intestinal barrier maturation at the suckling-to-weaning transition

Affiliations

Gut microbiota derived metabolites contribute to intestinal barrier maturation at the suckling-to-weaning transition

Martin Beaumont et al. Gut Microbes. .

Abstract

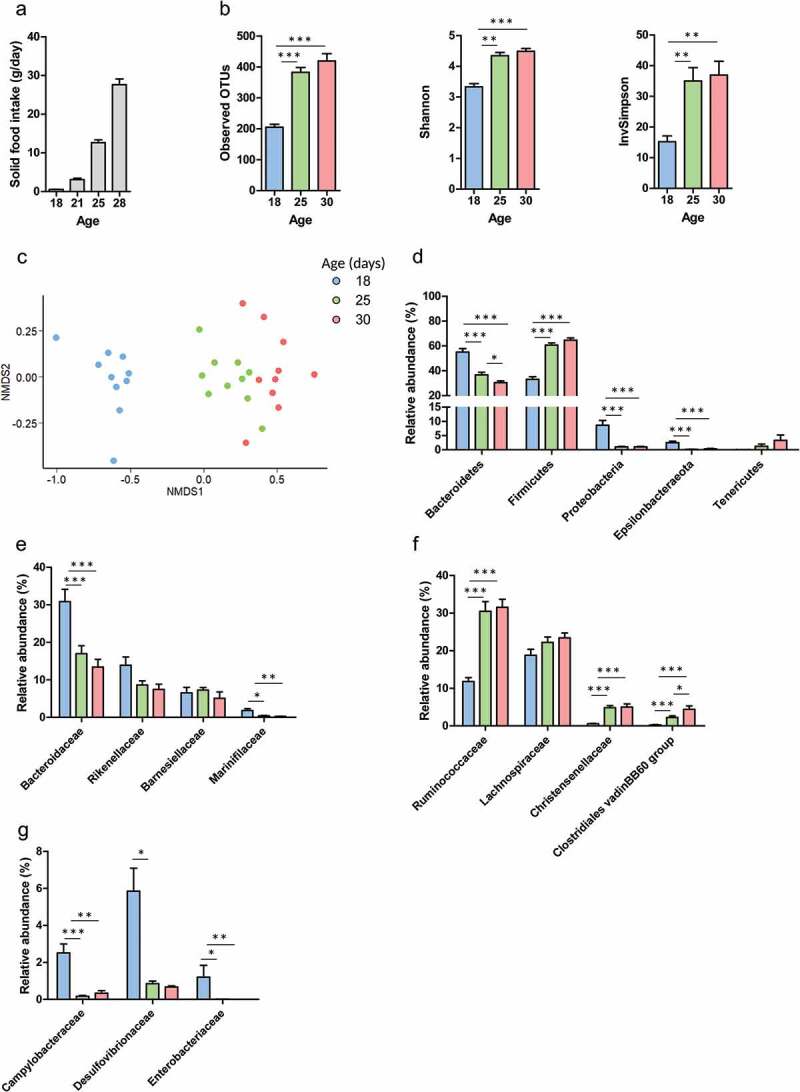
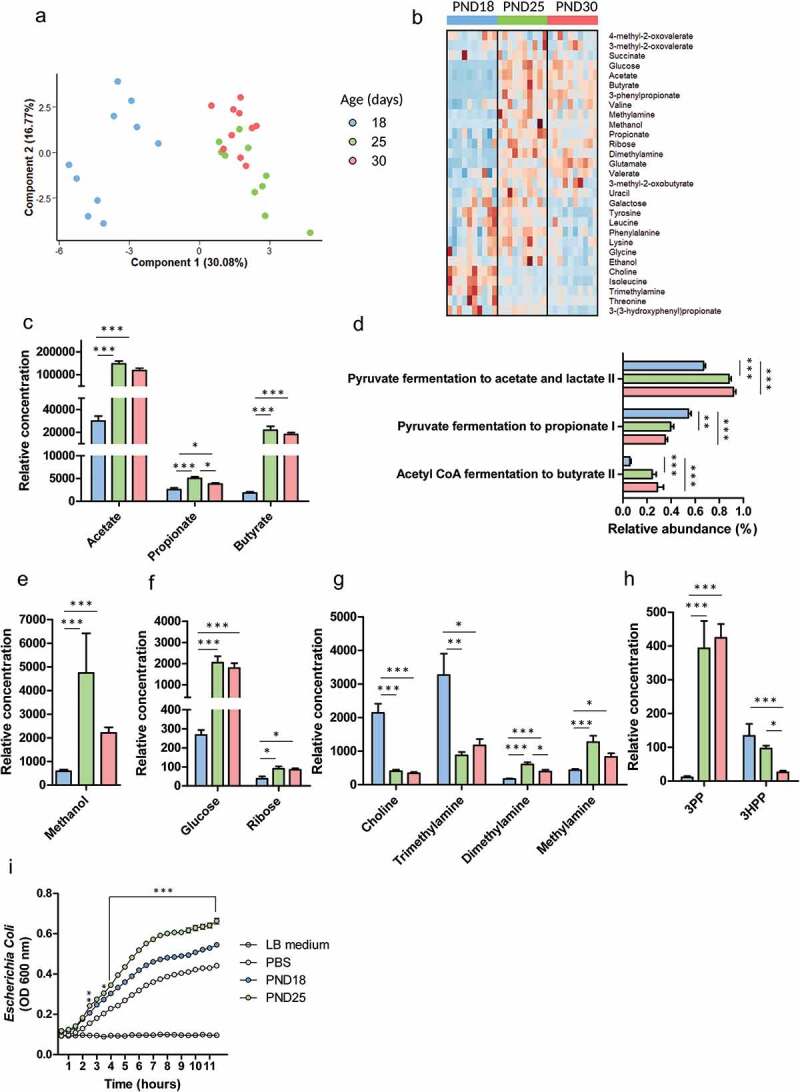
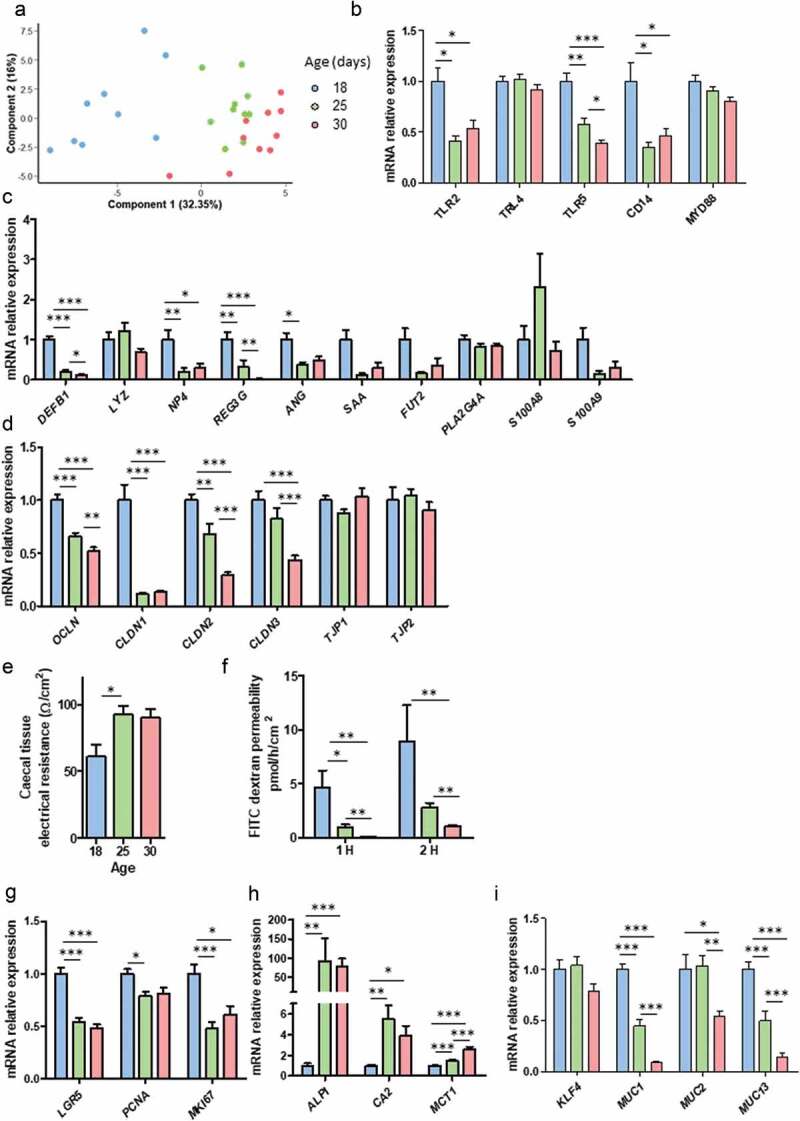
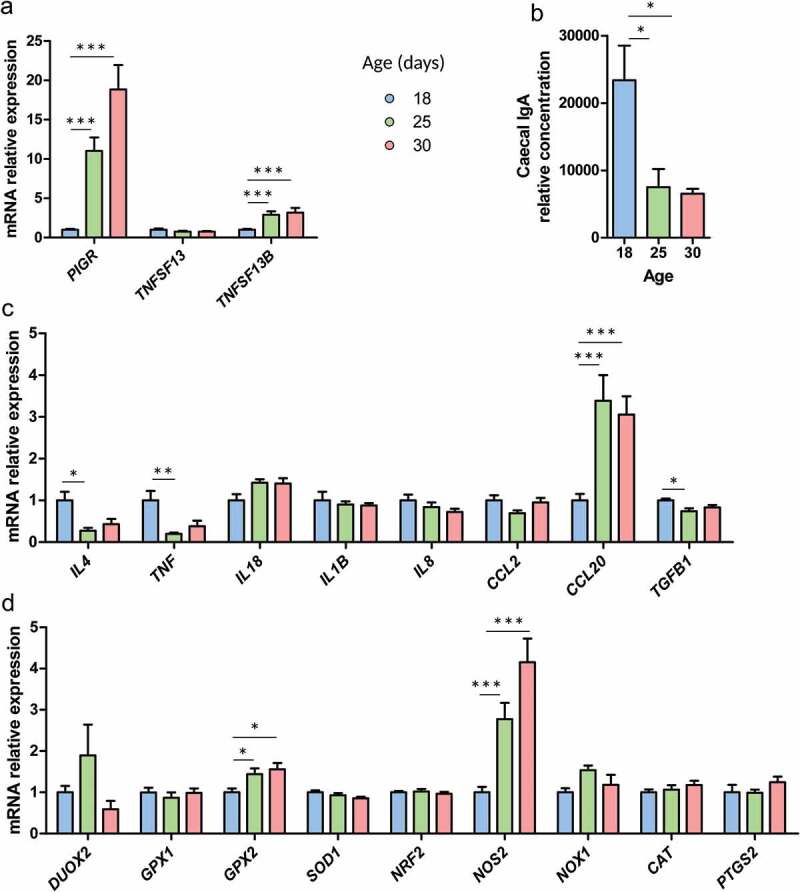
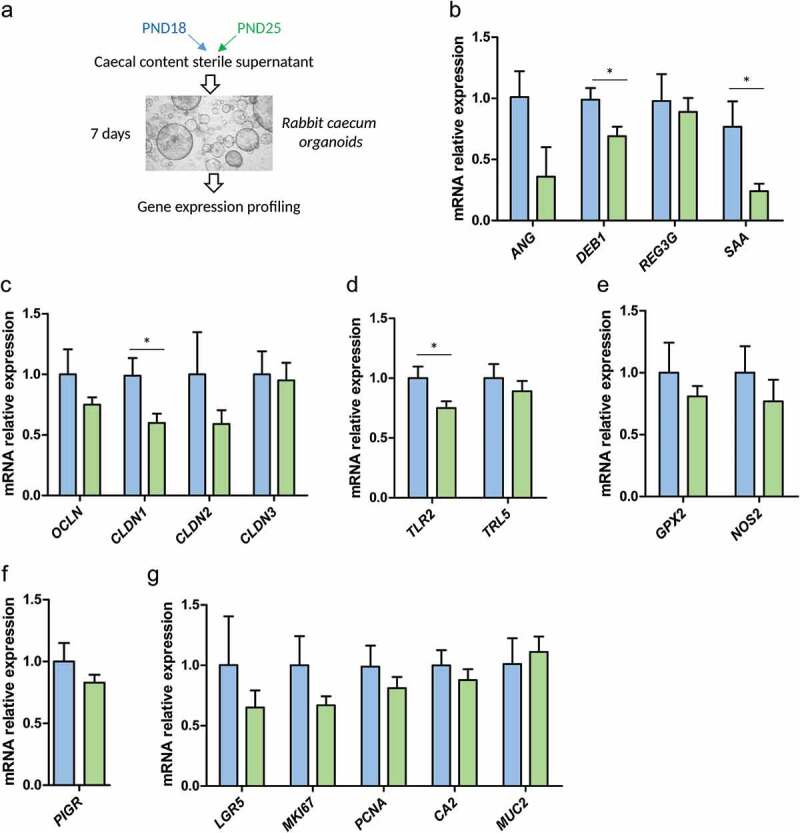
In suckling mammals, the onset of solid food ingestion is coincident with the maturation of the gut barrier. This ontogenic process is driven by the colonization of the intestine by the microbiota. However, the mechanisms underlying the microbial regulation of the intestinal development in early life are not fully understood. Here, we studied the co-maturation of the microbiota (composition and metabolic activity) and of the gut barrier at the suckling-to-weaning transition by using a combination of experiments in vivo (suckling rabbit model), ex vivo (Ussing chambers) and in vitro (epithelial cell lines and organoids). The microbiota composition, its metabolic activity, para-cellular epithelial permeability and the gene expression of key components of the gut barrier shifted sharply at the onset of solid food ingestion in vivo, despite milk was still predominant in the diet at that time. We found that cecal content sterile supernatant (i.e. containing a mixture of metabolites) obtained after the onset of solid food ingestion accelerated the formation of the epithelial barrier in Caco-2 cells in vitro and our results suggested that these effects were driven by the bacterial metabolite butyrate. Moreover, the treatment of organoids with cecal content sterile supernatant partially replicated in vitro the effects of solid food ingestion on the epithelial barrier in vivo. Altogether, our results show that the metabolites produced by the microbiota at the onset of solid food ingestion contribute to the maturation of the gut barrier at the suckling-to-weaning transition. Targeting the gut microbiota metabolic activity during this key developmental window might therefore be a promising strategy to promote intestinal homeostasis.

Keywords: Early life; epithelium; intestinal barrier development; maternal milk; metabolome; organoids; solid food.


Figures

Figure 1.
Figure 1.
The microbiota composition shifts at the onset of solid food ingestion. (a): Solid food intake by rabbit pups per day. The microbiota composition was analyzed by 16S rRNA amplicons sequencing in cecal content of rabbits at postnatal day 18, 25 and 30. (b): α-diversity indices. (c): Non Metric Dimensional Scaling (nMDS) two-dimensional representation of the microbiota β-diversity using Bray Curtis distance calculation (stress = 11.29). (d): Relative abundance of the main phyla. (e–g): Relative abundance of families in the phylum Bacteroidetes (e), Firmicutes (f), Proteobacteria and Epsilonbacteraeota (g). Data are presented as means ± SEM, n = 10/group. Kruskal-Wallis test was used to analyze age effect, followed by pairwise Wilcoxon test to compare the mean values of each group. *: P < .05, **: P < .01, ***: P < .001.
Figure 2.
Figure 2.
The metabolic activity of the gut microbiota is altered at the onset of solid food ingestion. The metabolome was analyzed by NMR metabolomics in cecal content of rabbits at postnatal day (PND) 18, 25 and 30. (a): Individual plot of principal component analysis (PCA). (b): Heatmap representing the relative concentration of all identified metabolites (rows) in individual samples (columns). The color represent the Z-scores (row-scaled relative concentration) from low (blue) to high values (red). Metabolites (rows) were clustered by the average method. (c): Relative concentration of the main short chain fatty acids. (d): PICRUSt2 predicted relative abundance of pathways involved in short chain fatty acids production. (e–h): Relative concentration of methanol (e), sugars (f), choline and its microbial derivatives (g), aromatic bacterial metabolites (h). 3PP:3-phenylpropionate, 3HPP: 3-(3-hydroxyphenyl)propionate. Data are presented as means ± SEM, n = 10/group. Kruskal-Wallis test was used to analyze age effect, followed by pairwise Wilcoxon test to compare the mean values of each group. (i): Growth of Escherichia coli in LB medium diluted 1:2 (v/v) in PBS or in a pool of sterile supernatant of cecal contents collected from rabbits at PND18 or PND25. The experiment was repeated 4 times. Data are presented as means ± SEM. Mean OD values of PND18 and PND25 were compared pairwise at each time point. *: P < .05, **: P < .01, ***: P < .001.
Figure 3.
Figure 3.
Epithelial components of the gut barrier are regulated at the onset of solid food ingestion. Gene expression was analyzed by high throughput microfluidic qPCR in the cecal mucosa of rabbits at postnatal day 18, 25 and 30. (a): Individual plot of principal component analysis (PCA). (b–d): Relative expression of genes involved in the toll-like receptors signaling pathway (b), antimicrobial defenses (c), tight junctions (d). (e): Cecal tissue electrical resistance was measured ex vivo in Ussing chambers. (f): Epithelial para-cellular permeability to FITC-dextran 4kDa was measured after 1 and 2 h in cecal tissue fragments mounted in Ussing chambers. (g–i): Relative expression of genes involved in epithelial proliferation (g), epithelial differentiation (h) and mucus secretion (i). Data are presented as means ± SEM, n = 9-10/group for gene expression analysis and n = 5–6 for Ussing chamber experiments. Kruskal-Wallis test was used to analyze age effect, followed by pairwise Wilcoxon test to compare the mean values of each group. *: P < .05, **: P < .01, ***: P < .001.
Figure 4.
Figure 4.
Immune and redox intestinal defenses are regulated at the onset of solid food ingestion. Gene expression was analyzed by high throughput microfluidic qPCR and immunoglobulin A (IgA) were quantified in the cecum of rabbits at postnatal day 18, 25 and 30. (a): Relative expression of genes involved in the IgA secretion pathway. (b): IgA relative concentration in the cecal content. (c–d): Relative gene expression of cytokines (c) and redox signaling proteins (d). Data are presented as relative expression means ± SEM, n = 9-10/group. Kruskal-Wallis test was used to analyze age effect, followed by pairwise Wilcoxon test to compare the mean values of each group. *: P < .05, **: P < .01, ***: P < .001.
Figure 5.
Figure 5.
Cecum metabolites produced at the onset of solid food ingestion promote the formation of the epithelial barrier in vitro. (a): The epithelial cell line Caco-2 was treated for 48 hours with 10% (v/v) cecum sterile supernatant of rabbits at postnatal day (PND) 18 or 25. (b): Transepithelial electrical resistance (TEER) was measured before and after the treatment with cecal content sterile supernatants (n = 9-10/condition). (c): Caco-2 cells were treated for 48 hours with bacterial metabolites alone or in combination (1 mM). (d): TEER was measured before and after the treatment with DMSO (negative control, 0.1%), butyrate (But), 3-phenylpropionte (3PP), trimethylamine (TMA), butyrate and 3-phenylpropionte (But + 3PP), butyrate and trimethylamine (But + TMA) (n = 6-8/condition). Data are presented as means of TEER change over 48 h ± SEM. Kruskal-Wallis test was used to analyze treatment effect, followed by pairwise Wilcoxon test to compare the mean values of each group. *: P < .05, **: P < .01, ***: P < .001.
Figure 6.
Figure 6.
Cecum metabolites produced at the onset of solid regulate epithelial gene expression in organoids. (a) – Gene expression was analyzed by high throughput microfluidic qPCR in rabbit cecum organoids treated for 7 days with 10% (v/v) cecal content sterile supernatant of rabbits at postnatal day (PND) 18 or 25. (b–g): relative expression of genes involved in antimicrobial defenses (b), tight junctions (c), toll-like receptors signaling pathway (d), redox signaling (e), immunoglobulin A secretion (f) and epithelial cell proliferation and differentiation (g). Data are presented as means ± SEM, n = 9-10/group. Kruskal-Wallis test was used to analyze treatment effect. *: P < .05, **: P < .01, ***: P < .001.

References

    1. Peterson LW, Artis D.. Intestinal epithelial cells: regulators of barrier function and immune homeostasis. Nat Rev Immunol. 2014;14:141–153. doi:10.1038/nri3608. - DOI - PubMed
    1. Goto Y. Epithelial cells as a transmitter of signals from commensal bacteria and host immune cells. Front Immunol. 2019;10:2057. doi:10.3389/fimmu.2019.02057. - DOI - PMC - PubMed
    1. Allaire JM, Crowley SM, Law HT, Chang S-Y, Ko H-J, Vallance BA. The intestinal epithelium: central coordinator of mucosal immunity. Trends Immunol. 2018;39:677–696. doi:10.1016/j.it.2018.04.002. - DOI - PubMed
    1. Jain N, Walker WA. Diet and host-microbial crosstalk in postnatal intestinal immune homeostasis. Nat Rev Gastroenterol Hepatol. 2015;12:14–25. doi:10.1038/nrgastro.2014.153. - DOI - PMC - PubMed
    1. Tamburini S, Shen N, Wu HC, Clemente JC. The microbiome in early life: implications for health outcomes. Nat Med. 2016;22:713–722. doi:10.1038/nm.4142. - DOI - PubMed

Publication types

MeSH terms

Substances