Randomized Controlled Trial
. 2020 Apr 30;15(4):e0232152.
doi: 10.1371/journal.pone.0232152. eCollection 2020.

Weekly, seasonal and holiday body weight fluctuation patterns among individuals engaged in a European multi-centre behavioural weight loss maintenance intervention

Affiliations
Randomized Controlled Trial

Weekly, seasonal and holiday body weight fluctuation patterns among individuals engaged in a European multi-centre behavioural weight loss maintenance intervention

Jake Turicchi et al. PLoS One. .

Abstract

Background: Technological advances in remote monitoring offer new opportunities to quantify body weight patterns in free-living populations. This paper describes body weight fluctuation patterns in response to weekly, holiday (Christmas) and seasonal time periods in a large group of individuals engaged in a weight loss maintenance intervention.

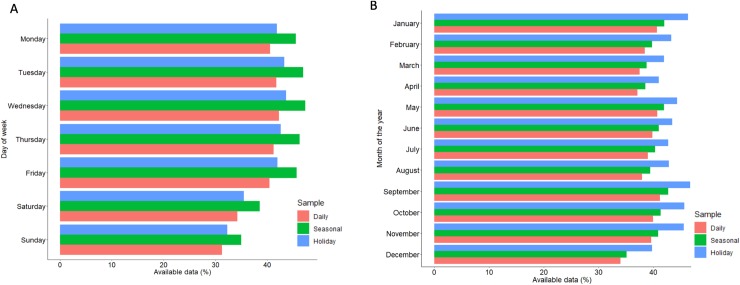
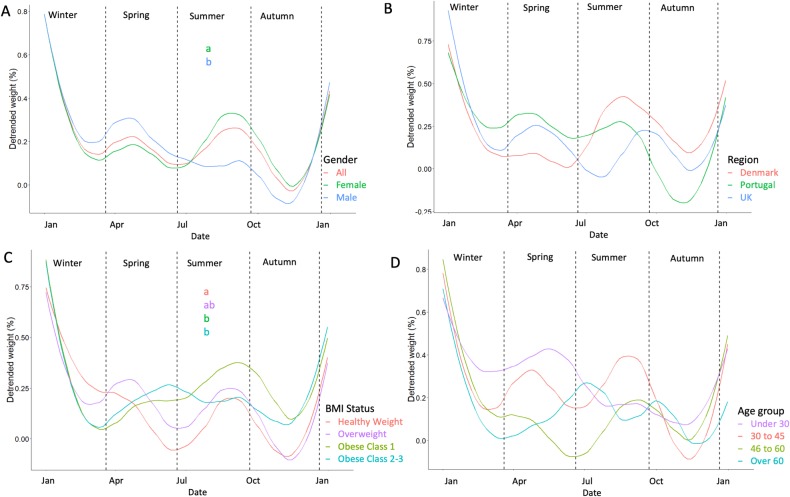
Methods: Data was collected as part The NoHoW Project which was a pan-European weight loss maintenance trial. Three eligible groups were defined for weekly, holiday and seasonal analyses, resulting in inclusion of 1,421, 1,062 and 1,242 participants, respectively. Relative weight patterns were modelled on a time series following removal of trends and grouped by gender, country, BMI and age.

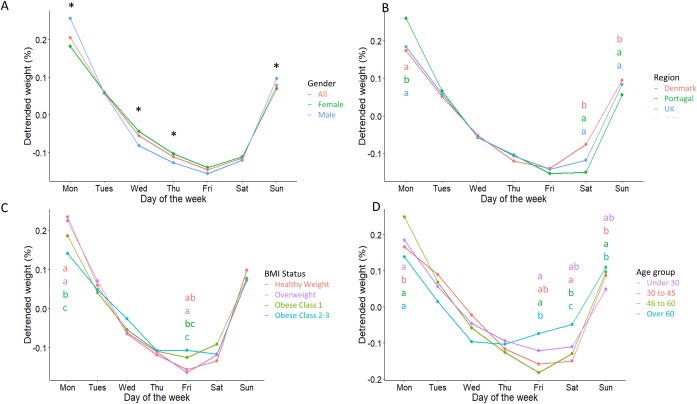
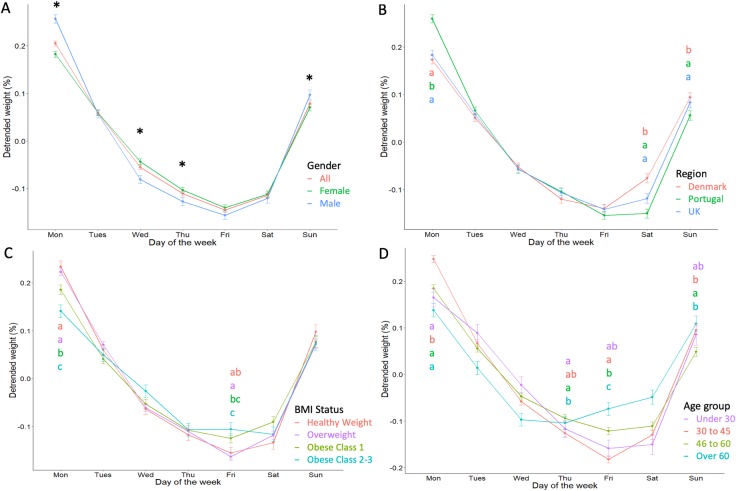
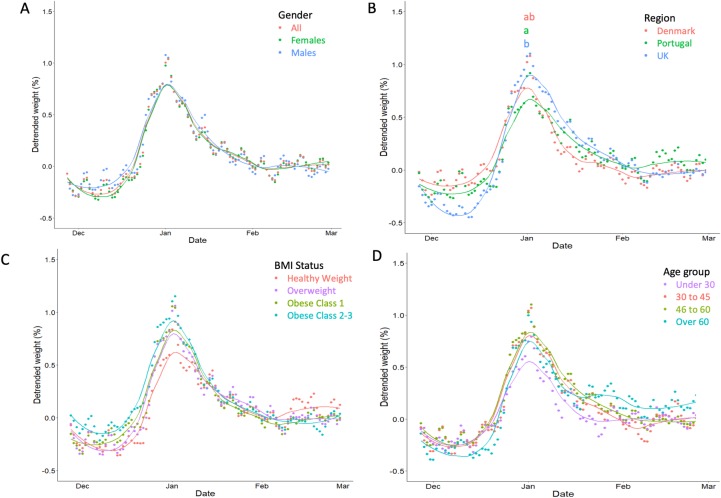
Results: Within-week fluctuations of 0.35% were observed, characterised by weekend weight gain and weekday reduction which differed between all groups. Over the Christmas period, weight increased by a mean 1.35% and was not fully compensated for in following months, with some differences between countries observed. Seasonal patterns were primarily characterised by the effect of Christmas weight gain and generally not different between groups.

Conclusions: This evidence may improve current understanding of regular body weight fluctuation patterns and help target future weight management interventions towards periods, and in groups, where weight gain is anticipated.


Conflict of interest statement

The authors have declared that no competing interests exist.

Figures

Fig 1
Fig 1. Participant flow diagram.
Participant flow diagram illustrating inclusion of participants into each of the 3 analyses.
Fig 2
Fig 2. Frequency of scale use by day of week and month of year.
Frequency of weight data collected, given for each analysis (daily, seasonal and holiday). Fig (A) shows completeness of data per day of the week relative to the total amount of data possible for the given day and fig (B) shows completeness of data per month of the year relative the amount of data possible for the given year.
Fig 3
Fig 3. Scale use over the duration of the trial.
Mean (standard error) scale use per week over 2 years for each week in all participants from the entire sample.
Fig 4
Fig 4. Weekly body weight fluctuations.
Weekly body weight fluctuations in all individuals and by gender (A), region (B), BMI status (C) and age group (D). Body weight has been detrended and detrended weight signifies the mean relative deviation from the body weight trend on a given day of the week. Groups are presented by colour, and groups without a letter in common for each given day were significantly different (p<0.05) as tested by multi-factor ANOVA and Tukey’s post hoc. Gender differences (p<0.05) are illustrated using an asterisk.
Fig 5
Fig 5. Body weight fluctuation around Christmas.
Christmas body weight fluctuations in all individuals and by gender (A), region (B), BMI status (C) and age group (D). Body weight has been detrended and detrended weight signifies the mean relative deviation from the body weight trend on a given day. Groups are presented by colour, and groups without a letter in common for each given day were significantly different as tested by multi-factor ANOVA and Tukey’s post hoc.
Fig 6
Fig 6. Seasonal body weight fluctuations.
Seasonal body weight fluctuations in all individuals and by gender (A), region (B), BMI status (C) and age group (D). Body weight has been detrended and detrended weight signifies the mean relative deviation from the body weight trend on a given day of the year which has been given as a line for each group. Groups are presented by colour, and groups without a letter in common for each given day were significantly different as tested by multi-factor ANOVA and Tukey’s post hoc.

References

    1. Hutfless S. et al. Strategies to Prevent Weight Gain Among Adults Strategies to Prevent Weight Gain Among Adults (Agency for Healthcare Research and Quality (US), 2013). - PubMed
    1. Drøyvold W. B. et al. Change in height, weight and body mass index: Longitudinal data from the HUNT Study in Norway. Int. J. Obes. 30, 935–939 (2006). - PubMed
    1. Deriaz O., Tremblay A. & Bouchard C. Non Linear Weight Gain with Long Term Overfeeding in Man. Obes. Res. 1, 179–185 (1993). 10.1002/j.1550-8528.1993.tb00609.x - DOI - PubMed
    1. St-Onge M. P. & Gallagher D. Body composition changes with aging: The cause or the result of alterations in metabolic rate and macronutrient oxidation? Nutrition vol. 26 152–155 (2010). 10.1016/j.nut.2009.07.004 - DOI - PMC - PubMed
    1. Arner P. et al. Adipose lipid turnover and long-term changes in body weight. Nature Medicine vol. 25 1385–1389 (2019). 10.1038/s41591-019-0565-5 - DOI - PubMed

Publication types