. 2020 Jul 8;107(1):38-51.e8.
doi: 10.1016/j.neuron.2020.03.032. Epub 2020 Apr 29.

An Ultra-Sensitive Step-Function Opsin for Minimally Invasive Optogenetic Stimulation in Mice and Macaques

Affiliations

An Ultra-Sensitive Step-Function Opsin for Minimally Invasive Optogenetic Stimulation in Mice and Macaques

Xin Gong et al. Neuron. .

Erratum in

Abstract

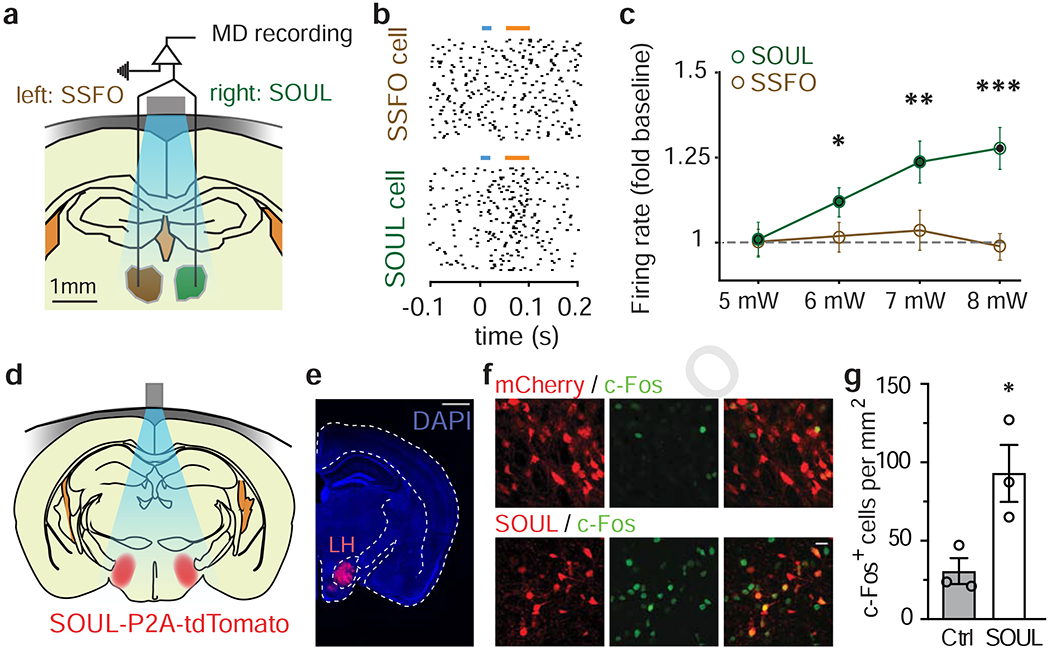
Optogenetics is among the most widely employed techniques to manipulate neuronal activity. However, a major drawback is the need for invasive implantation of optical fibers. To develop a minimally invasive optogenetic method that overcomes this challenge, we engineered a new step-function opsin with ultra-high light sensitivity (SOUL). We show that SOUL can activate neurons located in deep mouse brain regions via transcranial optical stimulation and elicit behavioral changes in SOUL knock-in mice. Moreover, SOUL can be used to modulate neuronal spiking and induce oscillations reversibly in macaque cortex via optical stimulation from outside the dura. By enabling external light delivery, our new opsin offers a minimally invasive tool for manipulating neuronal activity in rodent and primate models with fewer limitations on the depth and size of target brain regions and may further facilitate the development of minimally invasive optogenetic tools for the treatment of neurological disorders.


Conflict of interest statement

Declaration of Interests The Broad Institute of MIT and Harvard and the authors are submitting a patent application related to this work.

Figures

Figure 1.
Figure 1.. In-vitro characterization of SOUL
(a) Representative traces of primary cultured hippocampal neurons expressing SSFO (top) and SOUL (bottom) photocurrent responses to 470 nm light pulses of indicated power (3μW/mm2, 8μW/mm2, 20μW/mm2, 60μW/mm2, 1mW/mm2). (b) Summary data for the photocurrents in response to different levels of laser powers (Unpaired t-test with Holm-Sidak post-hoc analysis, *, P < 0.05; **, P < 0.01; P = 0.013, 0.019, 0.010, 0.002 and 0.004 from lowest to highest irradiance. SOUL, n = 17 neurons; SSFO, n = 15 neurons. Bar graph represents ± SEM). (c) Maximal photocurrent amplitude recorded from neurons expressing SSFO or SOUL (Unpaired t-test; **, P < 0.01, P = 0.0027; SOUL, n = 17 neurons; SSFO, n = 15 neurons. Bar graph represents ± SEM).
Figure 2.
Figure 2.. Ex-vivo characterization of SOUL
(a) Representative voltage trace over time for a SOUL-expressing PV+ neuron in acute brain slices upon blue-light activation (blue bar) and orange-light deactivation (orange bar). Scale bars: 8 mV and 15 s. (b) Membrane potentials of individual neurons’ (dashed lines) mean (±SEM, solid line) during baseline (BS), upon blue light activation (ON) and orange light deactivation (OFF). (c) Representative current trace over time for a SOUL-expressing PV neuron upon blue-light activation (blue bar) and orange-light deactivation (orange bar). Scale bars: 50 pA and 30 s. (d) Photocurrents of individual neurons (dots) and mean (±SEM, solid line). (e) Representative current trace over time for a SOUL-expressing D1 neuron upon SOUL activation (blue bar) and deactivation (orange bar). (f) Peak current-normalized activity of SOUL over time with mono-exponential fit (solid line; τ = 31.1 min).
Figure 3.
Figure 3.. Non-invasive transcranial stimulation of SOUL and SSFO in vivo
(a) Schematic of in vivo recording and transcranial stimulation of MD with SOUL (left) or SSFO (right) in awake mice. Scale bar, 1 mm. Gray bar, optical fiber; blue region, illumination. (b) Raster plot of the representative recording of the neuron from SSFO- (top panel) or SOUL-expressing (bottom panel) MD during blue and orange light illumination (colored bars). (c) Mean (± SEM) firing rate (normalized to baseline) across neurons in SOUL- (dark green circle) or SSFO-expressing (brown circle) MD transcranially stimulated with blue light of different intensities (*, P < 0.05; **, P < 0.01; ***, P < 0.001; two-tailed Wilcoxon Signed Rank Tests; SOUL, n = 36; SSFO, n = 31 neurons from 2 mice). (d) Schematic of transcranial optical stimulation (blue) of SOUL-expressing lateral hypothalamus (LH, red) through the intact skull (gray) of awake mice. (e) Coronal section of mice injected with SOUL-P2A-tdTomato in LH, expressing tdTomato (red) in LH and stained for DAPI (blue). Scale bar, 1 mm. (f) Representative confocal images of LH sections from mice expressing mCherry (red, top panel) or SOUL-P2A-tdTomato (red, bottom panel) and stained for c-Fos (green). Scale bar, 20 μm. (g) Mean cell counts of c-Fos+ cells in LH of mice injected with AAVs coding SOUL or mCherry (Cont.), as in (e). (Unpaired t-test; *, P < 0.05, P = 0.035; SOUL, n = 3 mice; mCherry, n = 3 mice; Bar graph represents ± SEM).
Figure 4.
Figure 4.. Transcranial stimulation of SOUL in lateral hypothalamus (LH) CaMKII+ neurons inhibits feeding behavior
(a) Schematic of transcranial stimulation of SOUL expressed in bilateral LH (red) in awake food-deprived mice. (b) Coronal section of SOUL knock-in mice injected with CaMKII-Cre in LH, expressing tdTomato (red) in LH and stained for DAPI (blue). Scale bar, 1 mm. (c) Confocal image of SOUL-P2A-tdTomato expression in LH neurons. Scale bar, 40 μm. (d) Mean (± SEM) food consumption during 10 minutes after SOUL activation (ON) and during 10 minutes after SOUL deactivation (OFF) of LH across SOUL-expressing mice and control mice (CaMKIIa::SOUL, n = 4 mice; Control, n = 4 mice, two-way ANOVA with Bonferroni post-hoc analysis; *, P < 0.05, F(1, 12) = 7.647).
Figure 5.
Figure 5.. Microglia activity in response to transcranial optical stimulation or fiber implantation
(a) Schematic of in vivo transcranial stimulation and the cortical area (black square) right underneath the stimulation site. The black squared area was used for lba-1 immunoactiviy quantifications. (b,c) Representative confocal images (b) and quantification (c, fluorescence intensity arbitrary units) of lba-1 immunoactivity of black squared area in (a) of mice with no treatment (NT), mice with blue and orange light transcranial illumination (Transcranial); mice with fiber implantation (Fiber); or corresponding cortical area contralateral to implant hemisphere of the fiber-implanted mice (Contralateral) (Scale bar, 20 μm; One way ANOVA with Tukey’s post-hoc analysis; ****, P < 0.0001; F(3, 16) = 60.51; NS, not significant; n = 5 mice for each group; bars and error bars represents mean ± SEM.).
Figure 6.
Figure 6.. SOUL-mediated modulation of spiking activity in macaque neurons by transdural optical stimulation
(a) Schematic illustration of a cross-section of the chamber and our minimally invasive optogenetic method. (b), (d) Raster plot (top panel) and mean firing rate over time (bottom pannel) for two example single neurons during multiple trials with blue and orange light illumination (color bars), BS: baseline; BL: blue-light; PB: post-blue; OL: orange light; PO: post-orange. (c), (e) Firing rate of the units in (b,d), respectively, during baseline (BS), post-blue (PB) and post-orange (PO) periods. ***, P < 0.001, paired t-test; NS, not significant. Spikes are downsampled in (b) and (d) for better visulization. (f) Percentage of units with significantly increased (←) or decreased (↓) firing rate after blue light stimulation (compared to baseline; paired t-tests, alpha < 0.05; see Methods), with (black) or without (grey) returning to baseline after orange light illumination (Paired t-tests, alpha < 0.05; n = 215). (g) Frequency histogram of firing rate modulation magnitudes (percent change from baseline, logarithmic scale) among modulated units (n = 128). (h) Frequency histogram of firing rate modulation latency (logarithmic scale) after blue light onset among modulated units. (i) Percentage of modulated units with a modulation duration of at least 40, 80 or 120 s (complete post-blue period) after blue light offset. (j) Recording depth and magnitude of all modulated units (circles). (k) Percent of modulated units at different recording depths.
Figure 7.
Figure 7.. Modulation of LFP oscillations in macaque cortex by transdural optical stimulation of SOUL
(a) Local field potential amplitude over time for an example recording channel before (top panel) and after (bottom panel) blue light stimulation in one representative trial. (b), (c) Spectrograms of two example recording channels showing mean LFP power across trials (% change from baseline, color scale) as a function of time and frequency. Colored bars, blue and orange light illumination periods. Time-frequency clusters with significant modulation compared to baseline are indicated by black outlines (see Methods). High and low frequencies are shown at different scales. (d) Percentage of channels (n = 176) with significant power modulation at each frequency. Color bars indicate frequency bands with significant peaks. (e-g) Mean (±SEM) power modulation magnitude (% change, e), latency (f) and duration (g) across all modulated channels.

Comment in

  • Light takes a deep dive.
    Lewis S. Lewis S. Nat Rev Neurosci. 2020 Jul;21(7):349. doi: 10.1038/s41583-020-0317-z. Nat Rev Neurosci. 2020. PMID: 32444774 No abstract available.

References

    1. Acker L, Pino EN, Boyden ES, and Desimone R (2016). FEF inactivation with improved optogenetic methods. P Natl Acad Sci USA 113, E7297–E7306. - PMC - PubMed
    1. Alexander GM, Rogan SC, Abbas AI, Armbruster BN, Pei Y, Allen JA, Nonneman RJ, Hartmann J, Moy SS, Nicolelis MA, et al. (2009). Remote Control of Neuronal Activity in Transgenic Mice Expressing Evolved G Protein-Coupled Receptors. Neuron 63, 27–39. - PMC - PubMed
    1. Anikeeva P, Andalman AS, Witten I, Warden M, Goshen I, Grosenick L, Gunaydin LA, Frank LM, and Deisseroth K (2012). Optetrode: a multichannel readout for optogenetic control in freely moving mice. Nature neuroscience 15, 163–U204. - PMC - PubMed
    1. Aravanis AM, Wang LP, Zhang F, Meltzer LA, Mogri MZ, Schneider MB, and Deisseroth K (2007). An optical neural interface: in vivo control of rodent motor cortex with integrated fiberoptic and optogenetic technology. Journal of Neural Engineering 4, S143–S156. - PubMed
    1. Armbruster BN, Li X, Pausch MH, Herlitze S, and Roth BL (2007). Evolving the lock to fit the key to create a family of G protein-coupled receptors potently activated by an inert ligand. P Natl Acad Sci USA 104, 5163–5168. - PMC - PubMed

Publication types