. 2020 Jul 8;28(7):1706-1716.
doi: 10.1016/j.ymthe.2020.04.007. Epub 2020 Apr 16.

RNAi-Based Gene Therapy Rescues Developmental and Epileptic Encephalopathy in a Genetic Mouse Model

Affiliations

RNAi-Based Gene Therapy Rescues Developmental and Epileptic Encephalopathy in a Genetic Mouse Model

Osasumwen V Aimiuwu et al. Mol Ther. .

Abstract

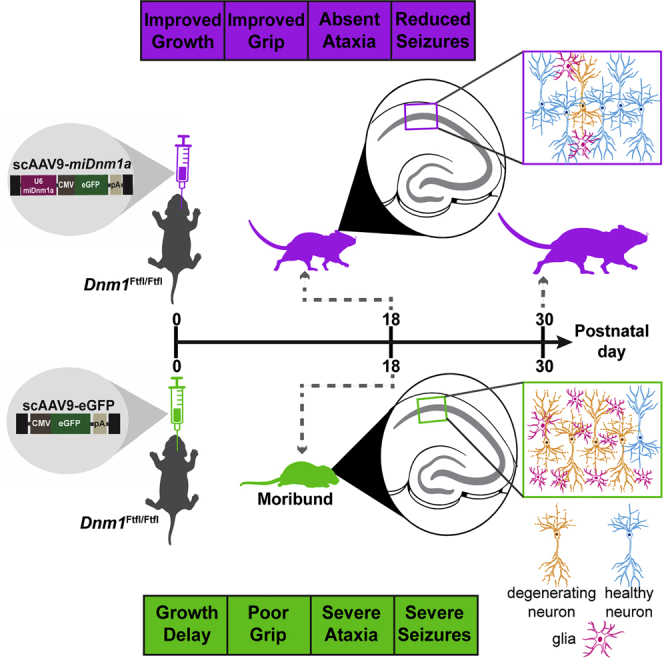
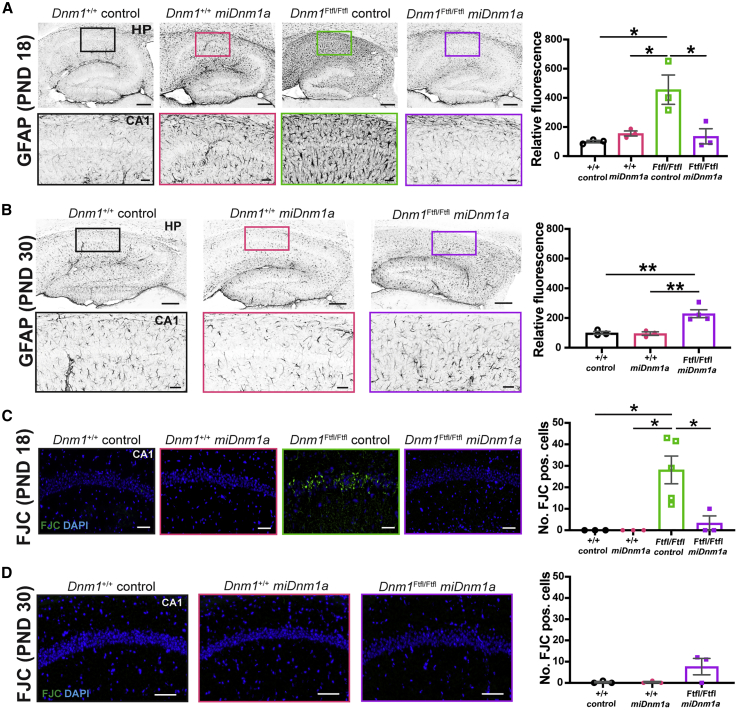
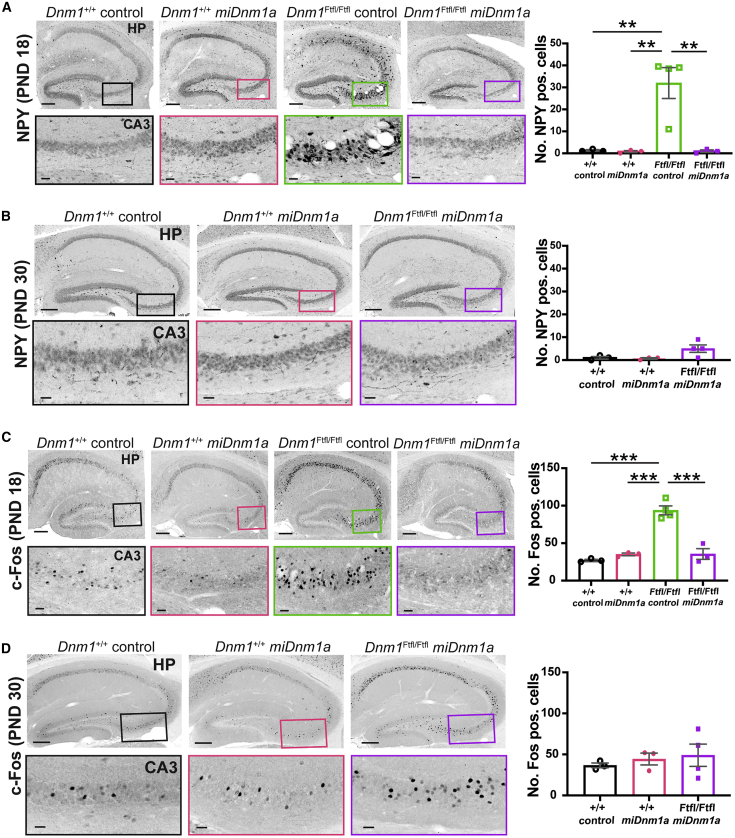
Developmental and epileptic encephalopathy (DEE) associated with de novo variants in the gene encoding dynamin-1 (DNM1) is a severe debilitating disease with no pharmacological remedy. Like most genetic DEEs, the majority of DNM1 patients suffer from therapy-resistant seizures and comorbidities such as intellectual disability, developmental delay, and hypotonia. We tested RNAi gene therapy in the Dnm1 fitful mouse model of DEE using a Dnm1-targeted therapeutic microRNA delivered by a self-complementary adeno-associated virus vector. Untreated or control-injected fitful mice have growth delay, severe ataxia, and lethal tonic-clonic seizures by 3 weeks of age. These major impairments are mitigated following a single treatment in newborn mice, along with key underlying cellular features including gliosis, cell death, and aberrant neuronal metabolic activity typically associated with recurrent seizures. Our results underscore the potential for RNAi gene therapy to treat DNM1 disease and other genetic DEEs where treatment would require inhibition of the pathogenic gene product.

Keywords: AAV9; DEE; DNM1; Lennox-Gastaut syndrome; RNA interferance; adeno-associated virus 9; developmental and epileptic encephalopathy; dynamin-1; epilepsy; gene therapy; infantile spasms.


Figures

None
Graphical abstract
Figure 1
Figure 1
scAAV9-miDnm1a Selectively Inhibits Dnm1a (A) Knockdown efficacy of Dnm1a in vitro by four different miRNA constructs. miDnm1a-4 was the most effective with 95% knockdown. (B) Experimental and control constructs delivered via i.c.v. injection at PND 0. The black boxes indicate the viral inverted terminal repeats, and pA indicates an SV40 polyadenylation signal. (C) Validation of Dnm1a knockdown efficacy in vivo by scAAV9-miDnm1a (n = 8) compared to scAAV9-EGFP control (n = 6) shows significant decrease of Dnm1a but not Dnm1b in whole-brain extracts from scAAV9-miDnm1a-treated mice (p < 0.0001 and p > 0.05 respectively; two-way ANOVA with Sidak’s correction for multiple comparisons). (D) Broad viral transduction of both Dnm1Ftfl/Ftfl and Dnm1+/+ scAAV9-miDnm1a-treated mice 30 days after i.c.v. injection. Images were taken at 10× magnification. Data reported as mean ± SEM. Scale bar on whole brain represents 500 μm, and scale bar of region of interest (ROI) represents 20 μm. n.s - not significant; ∗∗p < 0.0001.
Figure 2
Figure 2
scAAV9-miDnm1a Treatment Improves Survival, Growth, and Seizure Outcomes (A) Experimental design with i.c.v. injection administered at PND 0, developmental phenotyping executed between PND 4 and PND 11, survival, seizure, and growth measurement assessed from PND 4–PND 30 (the endpoint of the study) and cellular phenotyping performed at PND 18 and PND 30. (B) Treatment with miDnm1a led to 75% survival of Dnm1Ftfl/Ftfl mice (n = 25) to PND 30 compared to control-injected mice (EGFP or saline, n = 27), which were 100% lethal before PND 20 (p < 0.0001, log-rank Mantel-Cox test). Treated Dnm1Ftfl/Ftfl mice differed from treated Dnm1+/+ (n = 24) or control-injected Dnm1+/+ (n = 19) mice (p = 0.0239, p = 0.0097, respectively; log-rank Mantel-Cox test). (C) Although treated and control-injected Dnm1Ftfl/Ftfl mice were notably smaller as early as PND 8, miDnm1a-treated Dnm1Ftfl/Ftfl showed growth improvement beginning at PND 12. Repeated-measures ANOVA was performed until PND 18 when control-injected Dnm1Ftfl/Ftfl mice exited the study, including genotype-treatment effects (combining the two control treatments, EGFP and saline), plus other independent variables including sex, virus dose, and litter size. For treated versus control-injected Dnm1Ftfl/Ftfl, the effect of treatment was highly significant (p = 3.3 × 10−13), despite a significant effect of litter size (p = 1.4 × 10−7) but no significant impact of virus dose or sex. Growth differences at the PND 30 study endpoint between treated Dnm1Ftfl/Ftfl and treated wild-type were significant (p = 0.004), with a modest effect of litter size (p = 0.048). Using similar analysis, treated wild-type mice also showed growth delay compared to control wild-type (p = 0.004), with a modest effect of sex (p = 0.01) and litter size (p = 0.033). (D) Both miDnm1a-treated and control-injected Dnm1Ftfl/Ftfl mice show seizure-like behavior; however, control-injected Dnm1Ftfl/Ftfl mice had significantly more seizures at PND 14 and PND 18. Seizure behaviors of treated mice decreased over time. See Table 1 for sample numbers and analysis. Data reported as mean ± SEM. See also Figure S1.
Figure 3
Figure 3
scAAV9-miDnm1a Treatment Improves Developmental Outcomes (A) Treatment significantly improved the grip strength at PND 11 of Dnm1Ftfl/Ftfl mice (n = 30) compared to control-injected (n = 28) mice (p = 0.0009, least-squares regression using rank- and normal-quantile transformed data), with no effect of litter size, sex, or virus dose. Treated Dnm1Ftfl/Ftfl mice did not differ from treated (n = 24) or control-injected (n = 19) Dnm1+/+ mice (same test as above with Tukey’s HSD post hoc test, p > 0.05). (B and C) In an assay for sensorimotor development, at PND 9 and PND 11, control-injected Dnm1Ftfl/Ftfl mice had a higher latency, albeit not significant for the easier 90° turn (B) (p > 0.05, least-squares regression using rank- and normal-quantile transformed data, Dunnett’s post hoc test). However, for the more difficult 180° turn (C), control-injected Dnm1Ftfl/Ftfl mice showed a significantly higher latency at PND 11 compared to the other three groups (p < 0.001, Dunnett’s post hoc test). (D) Control-injected Dnm1Ftfl/Ftfl mice (n = 24) show severe ataxia; importantly, treatment with miDnm1a (n = 17) eliminates this phenotype (p = 6.9 × 10⁻¹⁷, log-Poisson test) and restores Dnm1Ftfl/Ftfl motor coordination back to the level of treated (n = 16) and control-injected (n = 23) Dnm1+/+ mice (p = 0.19 mixed model log-Poisson test). (E and F) Using locomotion (E) and velocity (F) as a proxy for possible hyperactivity, we observed that there was no significant difference between all groups (p > 0.05, one-way ANOVA). p < 0.01; ∗∗p < 0.001; ∗∗∗∗p < 0.00001.
Figure 4
Figure 4
miDnm1a Treatment Diminishes Gliosis and Cellular Degeneration at PND 18 until PND 30 (A) Control-injected Dnm1Ftfl/Ftfl mice showed strikingly increased gliosis specifically in the hippocampal CA1, as identified with the marker GFAP compared to treated Dnm1Ftfl/Ftfl mice (p = 0.018). Treated Dnm1Ftfl/Ftfl mice did not differ from treated and control-injected Dnm1+/+ mice (p > 0.05) at PND 18. (B) By PND 30, treated Dnm1Ftfl/Ftfl showed significantly more GFAP intensity compared to treated and control-injected Dnm1+/+ mice (p = 0.0052 and p = 0.0072, respectively). Images (A and B) were taken at 10× magnification, and analysis was done using an ordinary one-way ANOVA followed by Tukey’s multiple comparisons test. Scale bar of entire hippocampus represents 200 μm, and region of interest (ROI) scale bar represents 20 μm. (C and D) FJC labeling at PND 18 (C) showed significant cell death in the hippocampus of control-injected Dnm1Ftfl/Ftfl mice, specifically along the CA1, unlike treated Dnm1Ftfl/Ftfl mice (p = 0.015). Treated Dnm1Ftfl/Ftfl mice did not differ from treated and control-injected Dnm1+/+ mice (p > 0.05). By PND 30 (D), treated Dnm1Ftfl/Ftfl mice had little apparent cell death as identified by FJC labeling. However, they did not differ from treated and control-injected Dnm1+/+ mice (p > 0.05). Images were taken at 10× magnification, and scale bars correspond to 100 μm. Analyses were executed using the Poisson overdispersion option in the GMLJ module of Jamovi’s software. 3–5 mice were used in these analysis and data are reported as mean ± SEM. p < 0.05; ∗∗p < 0.01. See also Figure S2.
Figure 5
Figure 5
miDnm1a Treatment Improves Metabolic Cellular Activity at PND 18 until PND 30 (A) Aberrant NPY expression was observed in the hippocampus and specifically in the CA3 of control-injected Dnm1Ftfl/Ftfl mice at PND 18; treatment with miDnm1a reverted this phenotype (p = 0.0012). Treated Dnm1Ftfl/Ftfl mice did not differ from treated and control-injected Dnm1+/+ mice (p > 0.05). (B) NPY expression varied among treated Dnm1Ftfl/Ftfl mice at PND 30. However, treated Dnm1Ftfl/Ftfl mice trended toward significance compared to treated Dnm1+/+ mice (p = 0.057) and control-injected Dnm1+/+ mice (p = 0.074). (C) At PND18 c-Fos staining showed increased neuronal activation in the hippocampal CA3 of control-injected Dnm1Ftfl/Ftfl mice, which was significantly diminished in treated Dnm1Ftfl/Ftfl mice (p < 0.00001). Treated Dnm1Ftfl/Ftfl mice did not differ from Dnm1+/+ controls (p > 0.05). (D) By PND 30, there was a modest increase in neuronal activation in the hippocampus, specifically in the CA3 region, of treated Dnm1Ftfl/Ftfl mice compared to Dnm1+/+controls, but this increase was not significant (p > 0.05). All images (A–D) were taken at 10× magnification. Scale bar of entire hippocampus represents 200 μm and ROI scale bar represents 20 μm. Analyses were executed using the Poisson overdispersion option in the GMLJ module of Jamovi’s software. 3–5 mice were used in these analysis, and data are reported as mean ± SEM. ∗∗p < 0.01; ∗∗∗p < 0.0001. See also Figure S3.

References

    1. Ferguson S.M., Brasnjo G., Hayashi M., Wölfel M., Collesi C., Giovedi S., Raimondi A., Gong L.W., Ariel P., Paradise S. A selective activity-dependent requirement for dynamin 1 in synaptic vesicle endocytosis. Science. 2007;316:570–574. - PubMed
    1. Marks B., Stowell M.H., Vallis Y., Mills I.G., Gibson A., Hopkins C.R., McMahon H.T. GTPase activity of dynamin and resulting conformation change are essential for endocytosis. Nature. 2001;410:231–235. - PubMed
    1. Powell K.A., Robinson P.J. Dephosphin/dynamin is a neuronal phosphoprotein concentrated in nerve terminals: evidence from rat cerebellum. Neuroscience. 1995;64:821–833. - PubMed
    1. Dhindsa R.S., Bradrick S.S., Yao X., Heinzen E.L., Petrovski S., Krueger B.J., Johnson M.R., Frankel W.N., Petrou S., Boumil R.M., Goldstein D.B. Epileptic encephalopathy-causing mutations in DNM1 impair synaptic vesicle endocytosis. Neurol. Genet. 2015;1:e4. - PMC - PubMed
    1. EuroEPINOMICS-RES Consortium. Epilepsy Phenome/Genome Project, Epi4K Consortium De Novo Mutations in Synaptic Transmission Genes Including DNM1 Cause Epileptic Encephalopathies. Am. J. Hum. Genet. 2017;100:179. - PMC - PubMed

Publication types