. 2020 May 22;23(5):101062.
doi: 10.1016/j.isci.2020.101062. Epub 2020 Apr 13.

IP3-Dependent Ca2+ Oscillations Switch into a Dual Oscillator Mechanism in the Presence of PLC-Linked Hormones

Affiliations

IP3-Dependent Ca2+ Oscillations Switch into a Dual Oscillator Mechanism in the Presence of PLC-Linked Hormones

Paula J Bartlett et al. iScience. .

Abstract

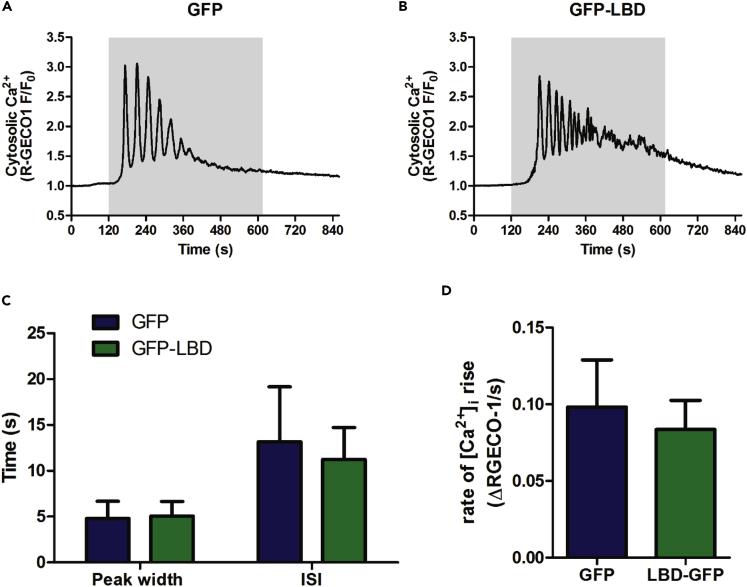
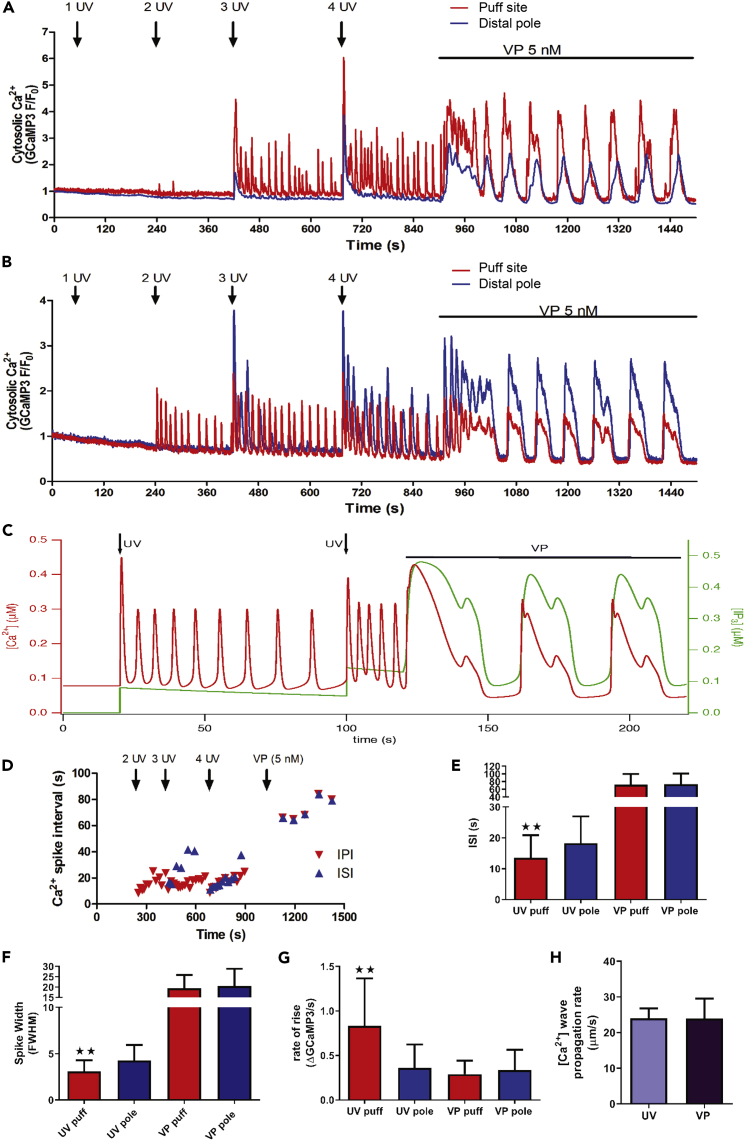
Ca2+ oscillations that depend on inositol-1,4,5-trisphosphate (IP3) have been ascribed to biphasic Ca2+ regulation of the IP3 receptor (IP3R) or feedback mechanisms controlling IP3 levels in different cell types. IP3 uncaging in hepatocytes elicits Ca2+ transients that are often localized at the subcellular level and increase in magnitude with stimulus strength. However, this does not reproduce the broad baseline-separated global Ca2+ oscillations elicited by vasopressin. Addition of hormone to cells activated by IP3 uncaging initiates a qualitative transition from high-frequency spatially disorganized Ca2+ transients, to low-frequency, oscillatory Ca2+ waves that propagate throughout the cell. A mathematical model with dual coupled oscillators that integrates Ca2+-induced Ca2+ release at the IP3R and mutual feedback mechanisms of cross-coupling between Ca2+ and IP3 reproduces this behavior. Thus, multiple Ca2+ oscillation modes can coexist in the same cell, and hormonal stimulation can switch from the simpler to the more complex to yield robust signaling.

Keywords: Cell Biology; Mathematical Biosciences; Specialized Functions of Cells.


Conflict of interest statement

Declaration of Interests The authors declare no competing interests.

Figures

None
Graphical abstract
Figure 1
Figure 1
Effect of Incremental Flash Photolysis of Caged IP3 on [Ca2+]c Oscillation Properties Isolated hepatocytes were transfected with GCaMP3, cultured overnight, and then loaded with caged IP3 (2 μM; 1 h). (A) Representative trace showing cytosolic Ca2+ responses to photolysis of caged IP3 elicited by rapid trains of 1, 2, 3, and 4 UV pulses (arrows). After a recovery period, the same cells were stimulated with 5 nM vasopressin (VP). (B–E) Summary data for the effect of increasing UV stimulation compared with VP for [Ca2+]c spike amplitude (B), peak width measured as full width at half maximum (FWHM) (C), rate of rise (D), and interspike interval (ISI) (E). Data are mean ± SEM of the second [Ca2+] transient for amplitude, width, and rate of rise, and 3 consecutive oscillations for ISI after UV pulse or 5 nM VP addition (11 cells from 6 independent experiments).
Figure 2
Figure 2
Buffering of Intracellular IP3 Has No Effect on Ca2+ Oscillations Elicited by Slow Release of Caged IP3 (A–D) Hepatocytes cotransfected with RGECO1 and either GFP (A) or GFP-LBD (B) were loaded with caged IP3 (2 μM; 1 h). The gray area shows the duration of slow IP3 uncaging elicited by low-intensity UV illumination (50-ms exposures from xenon lamp at 2 Hz). Expression of GFP-LBD had no effect on the peak width (FWHM) or ISI (C) or the rate of Ca2+ rise (D). Data are mean ± SEM of 10 cells from 4 independent experiments.
Figure 3
Figure 3
Spatial Properties of [Ca2+]c Responses Elicited by Flash Photolysis of caged IP3 Isolated hepatocytes were transfected with GCaMP3, cultured overnight, and then loaded with caged IP3 (2 μM; 1 h). (A) Single video frames showing focal [Ca2+]c release events. Scale bar, 10 μM. (B and C) Representative traces of changes in [Ca2+]c at the local puff site (red) and distal pole (blue) of two individual hepatocytes during IP3 uncaging. (D) Interpuff interval (IPI, red) and interspike interval (ISI, blue) during the 3 UV pulse response from (C). (E) Ordinal plot of the Ca2+ response pattern for cells with increasing UV pulse density (bursts of 1–4 flashes, as indicated). Response patterns of increasing strength are classified as follows: no response, local Ca2+ transients at a discrete puff site, partial propagation where Ca2+ waves only propagated across the cell intermittently, propagation where Ca2+ waves consistently propagated across the cell, and global for whole-cell Ca2+ responses that were not spatially resolved (summary of 59 cells from 6 independent experiments).
Figure 4
Figure 4
Effect of IP3 Uncaging on [Ca2+]c Responses Elicited by Vasopressin (A–D) Isolated hepatocytes were transfected with GCaMP3, cultured overnight and then loaded with caged IP3 (2 μM; 1h). Hepatocytes were stimulated with vasopressin (VP) and then IP3 uncaging was achieved by a brief (1-s) pulse of 340-nm light from the microscope fluorescence illuminator Xeon lamp. Representative traces showing (A) a slight slowing of Ca2+ oscillation frequency or (B) the temporary arrest of oscillations. Summary data showing a decrease in oscillation frequency (C) and an increase in peak width (D) after the IP3 uncaging event (data are mean ± SEM from ≥26 individual hepatocytes from 4 independent experiments, ∗∗p < 0.01, ∗∗∗p < 0.001 paired Student's t test). (E) Representative trace of hepatocyte stimulated with VP and then IP3 uncaging with 3 UV flashes from UV laser.
Figure 5
Figure 5
Fast [Ca2+]c Oscillations Elicited by IP3 Uncaging Transition to Broad Baseline-Separate [Ca2+]c Oscillations in the Presence of Hormone Isolated hepatocytes were transfected with GCaMP3, cultured overnight, and then loaded with caged IP3 (2 μM; 1 h). Rapid trains of 1, 2, 3, or 4 UV pulses were applied as indicated (arrows) followed by the addition of VP (5 nM). (A and B) Representative traces showing cytosolic [Ca2+]c oscillations at puff site (red) and distal pole (blue) of two cells in response to IP3 uncaging and VP (see also Videos S1 and S2). (C) Mathematical model combining class 1 and class 2 oscillation mechanisms predicts the observed behavior in this paradigm (red line [Ca2+]c, green line [IP3]). (D) IPI and ISI of cell shown in (B) in response to UV pulses and VP (transition period between UV and VP responses not shown). (E–G) Comparison of ISI (E), spike width (FWHM) (F), and rate of rise (G) at the puff site and distal pole of hepatocytes. (H) Comparison of [Ca2+]c wave propagation rate elicited by UV and VP. Data are mean ± SEM of 10 cells from 5 independent experiments. ∗∗p < 0.01, paired Student's t test.

References

    1. Akerboom J., Carreras Calderón N., Tian L., Wabnig S., Prigge M., Tolö J., Gordus A., Orger M.B., Severi K.E., Macklin J.J. Genetically encoded calcium indicators for multi-color neural activity imaging and combination with optogenetics. Front. Mol. Neurosci. 2013;6:2. - PMC - PubMed
    1. Amaya M.J., Nathanson M.H. John Wiley & Sons, Inc; 2013. Calcium Signaling in the Liver. Comprehensive Physiology. - PMC - PubMed
    1. Arguin G., Regimbald-Dumas Y., Fregeau M.-O., Caron A.Z., Guillemette G. Protein kinase C phosphorylates the inositol 1,4,5-trisphosphate receptor type 2 and decreases the mobilization of Ca2+in pancreatoma AR4-2J cells. J. Endocrinol. 2007;192:659–668. - PubMed
    1. Arruda A.P., Hotamisligil G.S. Calcium homeostasis and organelle function in the pathogenesis of obesity and diabetes. Cell Metab. 2015;22:381–397. - PMC - PubMed
    1. Baffy G., Yang L., Michalopoulos G.K., Williamson J.R. Hepatocyte growth factor induces calcium mobilization and inositol phosphate production in rat hepatocytes. J. Cell Physiol. 1992;153:332–339. - PubMed