. 2020 Jul;583(7816):459-468.
doi: 10.1038/s41586-020-2286-9. Epub 2020 Apr 30.

A SARS-CoV-2 protein interaction map reveals targets for drug repurposing

David E Gordon #  1   2   3   4 Gwendolyn M Jang #  1   2   3   4 Mehdi Bouhaddou #  1   2   3   4 Jiewei Xu #  1   2   3   4 Kirsten Obernier #  1   2   3   4 Kris M White #  5   6 Matthew J O'Meara #  7 Veronica V Rezelj #  8 Jeffrey Z Guo  1   2   3   4 Danielle L Swaney  1   2   3   4 Tia A Tummino  1   2   9 Ruth Hüttenhain  1   2   3   4 Robyn M Kaake  1   2   3   4 Alicia L Richards  1   2   3   4 Beril Tutuncuoglu  1   2   3   4 Helene Foussard  1   2   3   4 Jyoti Batra  1   2   3   4 Kelsey Haas  1   2   3   4 Maya Modak  1   2   3   4 Minkyu Kim  1   2   3   4 Paige Haas  1   2   3   4 Benjamin J Polacco  1   2   3   4 Hannes Braberg  1   2   3   4 Jacqueline M Fabius  1   2   3   4 Manon Eckhardt  1   2   3   4 Margaret Soucheray  1   2   3   4 Melanie J Bennett  1   2   3   4 Merve Cakir  1   2   3   4 Michael J McGregor  1   2   3   4 Qiongyu Li  1   2   3   4 Bjoern Meyer  8 Ferdinand Roesch  8 Thomas Vallet  8 Alice Mac Kain  8 Lisa Miorin  5   6 Elena Moreno  5   6 Zun Zar Chi Naing  1   2   3   4 Yuan Zhou  1   2   3   4 Shiming Peng  1   2   9 Ying Shi  1   2   4   10 Ziyang Zhang  1   2   4   10 Wenqi Shen  1   2   4   10 Ilsa T Kirby  1   2   4   10 James E Melnyk  1   2   4   10 John S Chorba  1   2   4   10 Kevin Lou  1   2   4   10 Shizhong A Dai  1   2   4   10 Inigo Barrio-Hernandez  11 Danish Memon  11 Claudia Hernandez-Armenta  11 Jiankun Lyu  1   2   9 Christopher J P Mathy  1   2   12   13 Tina Perica  1   2   12 Kala Bharath Pilla  1   2   12 Sai J Ganesan  1   2   12 Daniel J Saltzberg  1   2   12 Ramachandran Rakesh  1   2   12 Xi Liu  1   2   9 Sara B Rosenthal  14 Lorenzo Calviello  1   15 Srivats Venkataramanan  1   15 Jose Liboy-Lugo  1   15 Yizhu Lin  1   15 Xi-Ping Huang  16 YongFeng Liu  16 Stephanie A Wankowicz  1   2   12   17 Markus Bohn  1   2   9 Maliheh Safari  1   2   18 Fatima S Ugur  1   2   4   9 Cassandra Koh  8 Nastaran Sadat Savar  8 Quang Dinh Tran  8 Djoshkun Shengjuler  8 Sabrina J Fletcher  8 Michael C O'Neal  19 Yiming Cai  19 Jason C J Chang  19 David J Broadhurst  19 Saker Klippsten  19 Phillip P Sharp  4 Nicole A Wenzell  1   2   4 Duygu Kuzuoglu-Ozturk  1   20   21 Hao-Yuan Wang  1   2   4 Raphael Trenker  1   2   22 Janet M Young  23 Devin A Cavero  1   3   24 Joseph Hiatt  1   3   25 Theodore L Roth  1   3   24   25 Ujjwal Rathore  1   3   24 Advait Subramanian  1   2   24 Julia Noack  1   2   24 Mathieu Hubert  26 Robert M Stroud  1   2   18 Alan D Frankel  1   2   18 Oren S Rosenberg  1   2   18   27 Kliment A Verba  1   2   9 David A Agard  1   2   18 Melanie Ott  1   2   3   27 Michael Emerman  28 Natalia Jura  1   2   4   22 Mark von Zastrow  1   2   4   29 Eric Verdin  1   27   30 Alan Ashworth  1   2   20 Olivier Schwartz  26 Christophe d'Enfert  31 Shaeri Mukherjee  1   2   24 Matt Jacobson  1   2   9 Harmit S Malik  23 Danica G Fujimori  1   2   4   9 Trey Ideker  1   32 Charles S Craik  1   2   9   20 Stephen N Floor  1   15   20 James S Fraser  1   2   12 John D Gross  1   2   9 Andrej Sali  1   2   9   12 Bryan L Roth  16 Davide Ruggero  1   2   4   20   21 Jack Taunton  1   2   4 Tanja Kortemme  1   2   12   13 Pedro Beltrao  1   11 Marco Vignuzzi  33 Adolfo García-Sastre  34   35   36   37 Kevan M Shokat  38   39   40   41 Brian K Shoichet  42   43   44 Nevan J Krogan  45   46   47   48   49
Affiliations

A SARS-CoV-2 protein interaction map reveals targets for drug repurposing

David E Gordon et al. Nature. 2020 Jul.

Abstract

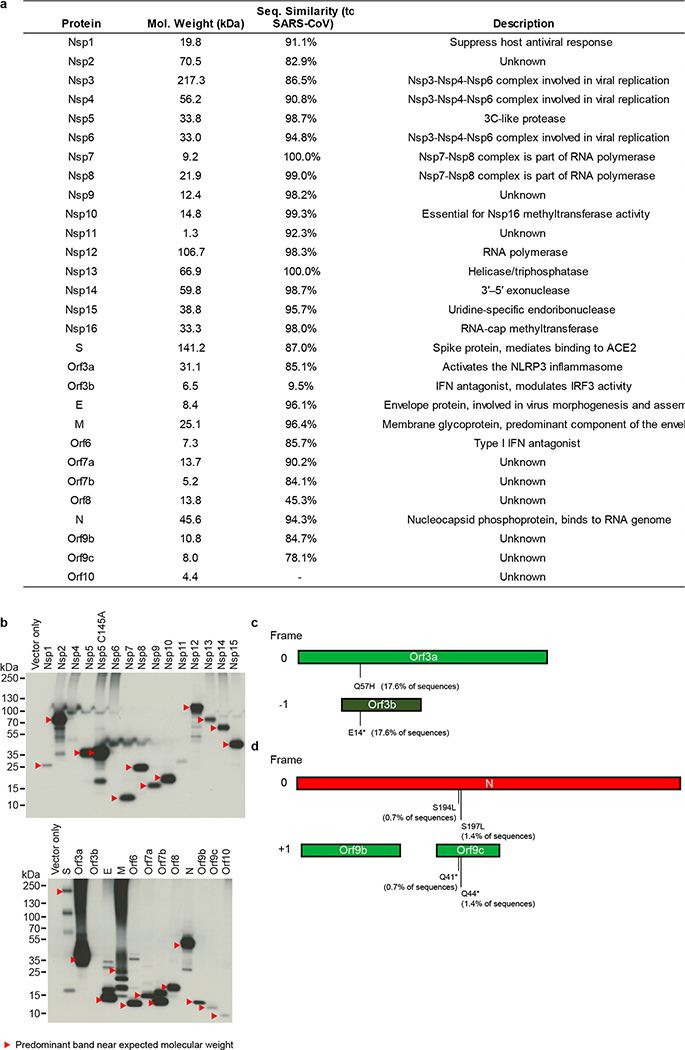
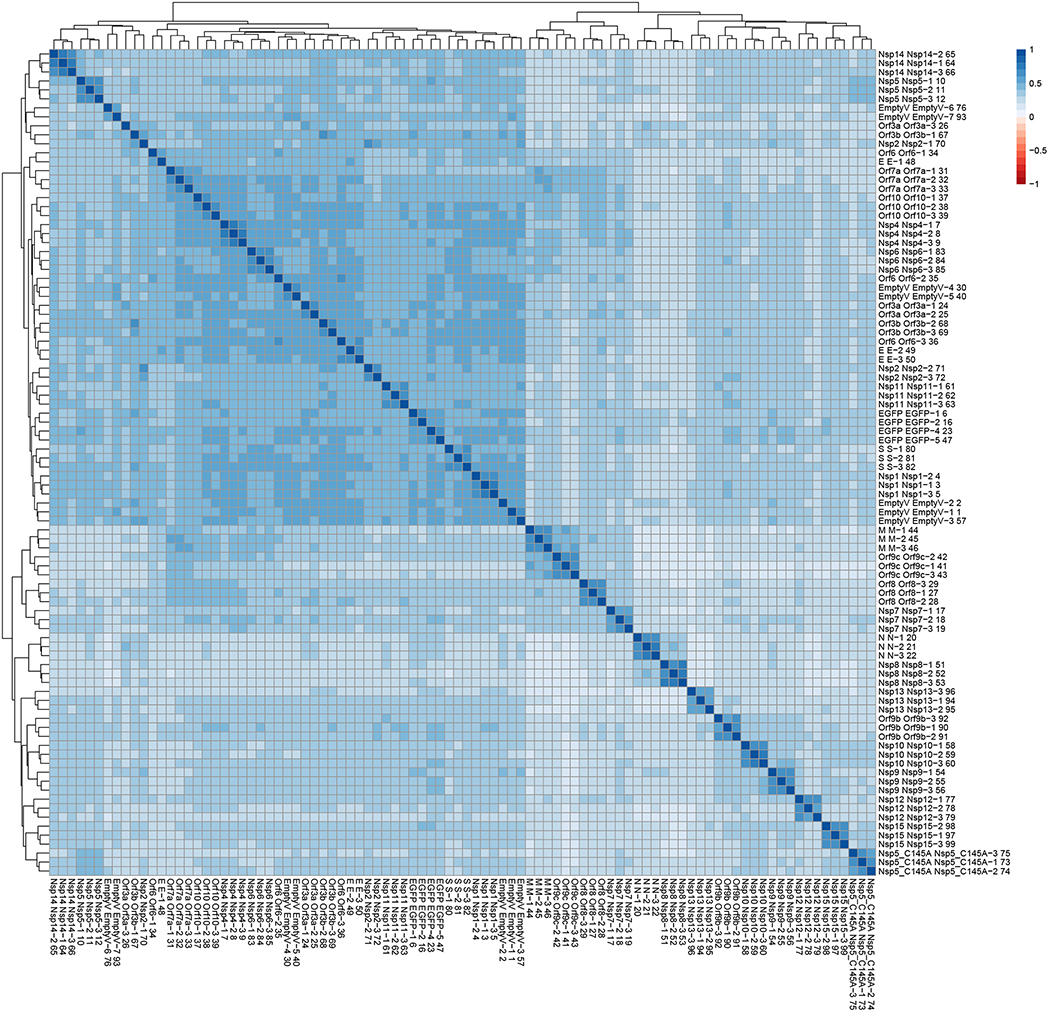
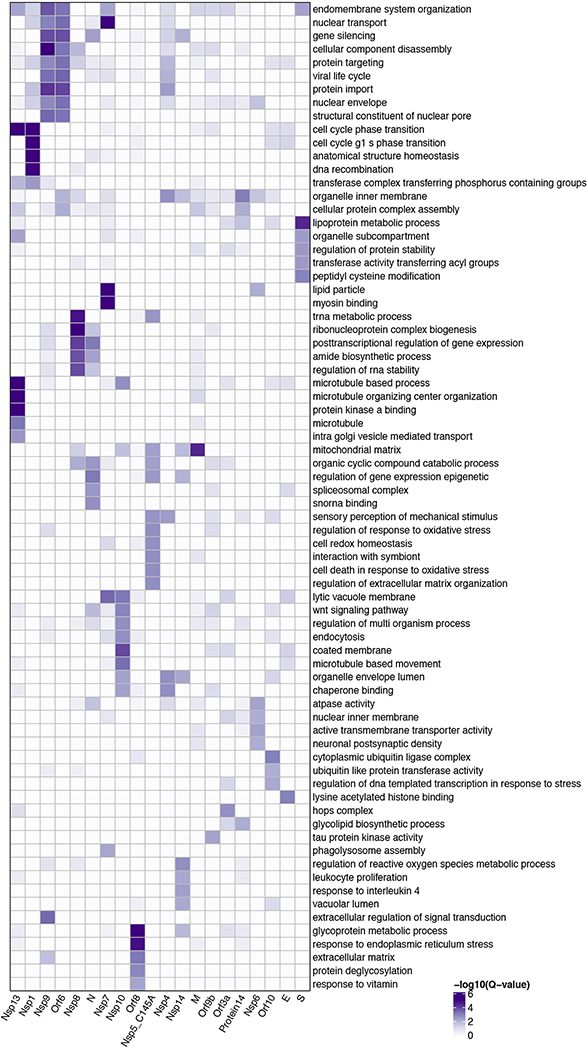
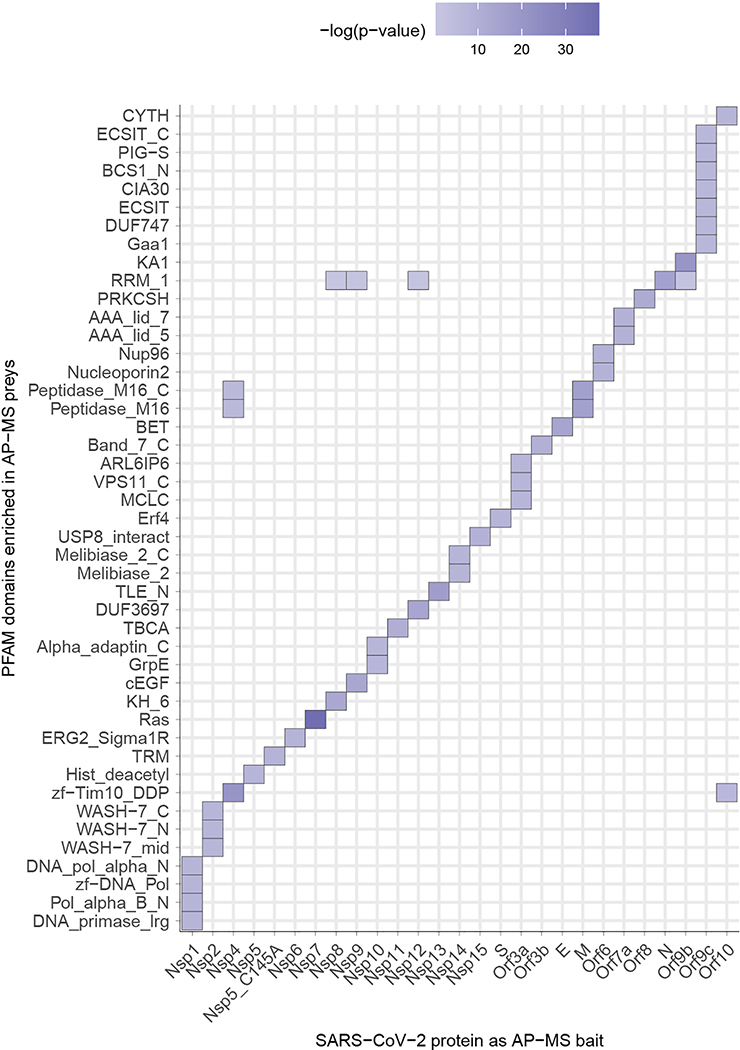
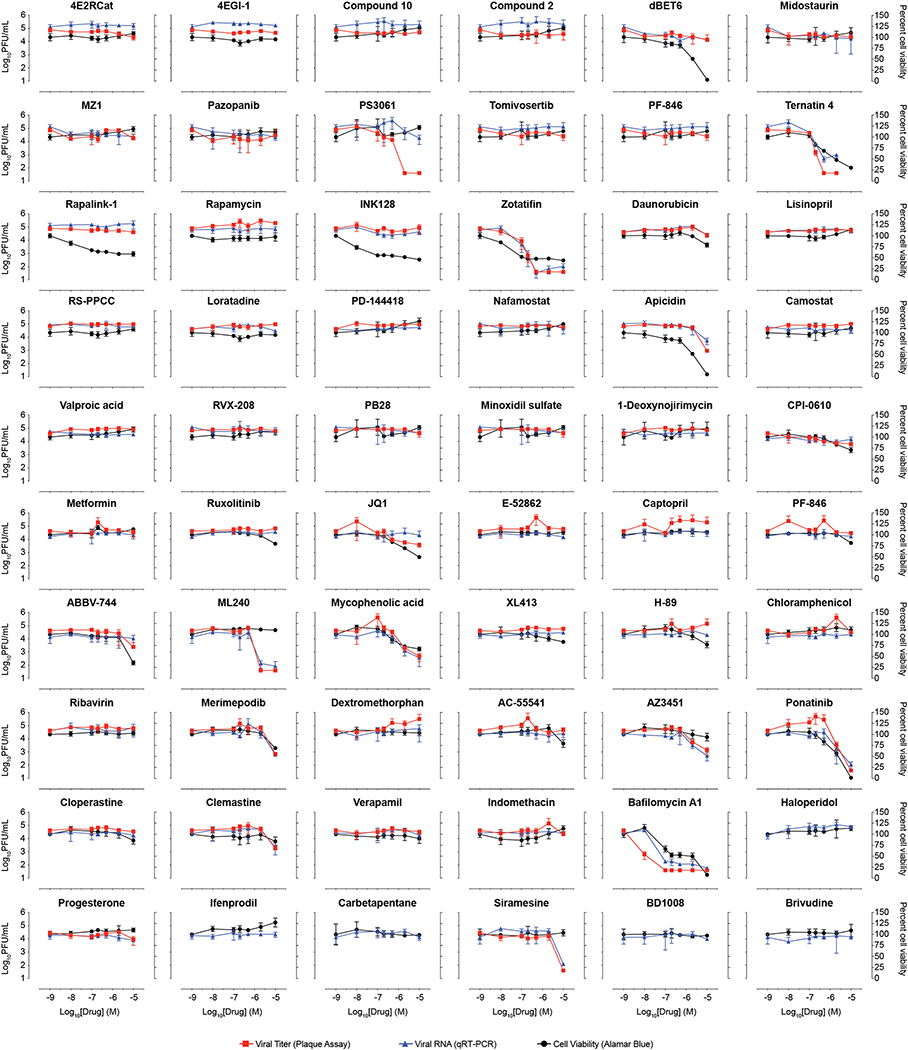
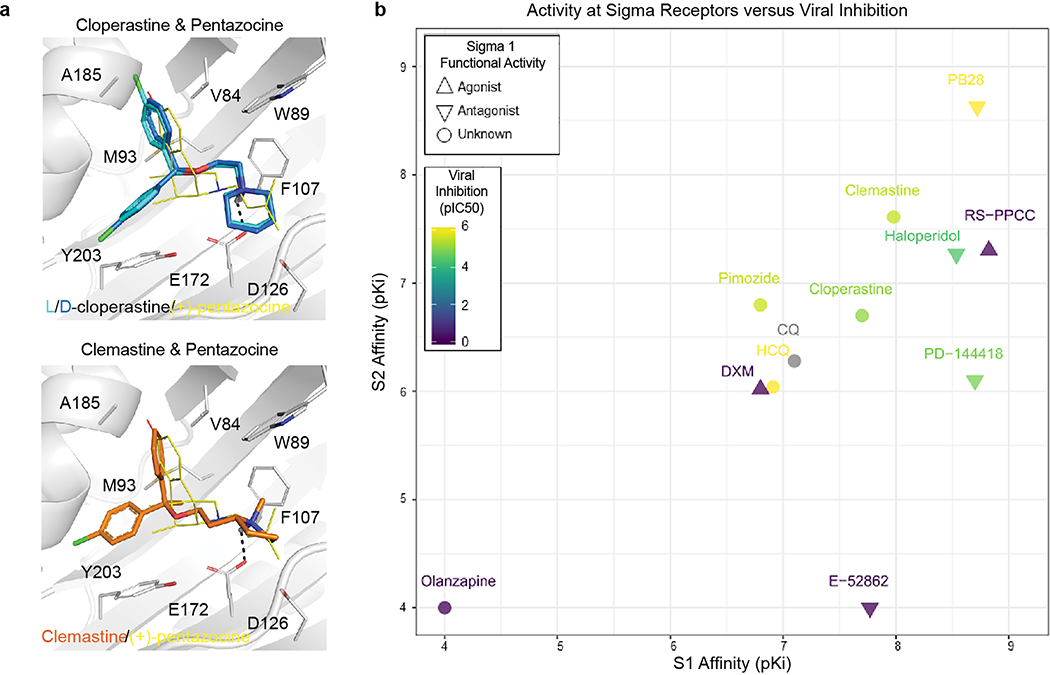
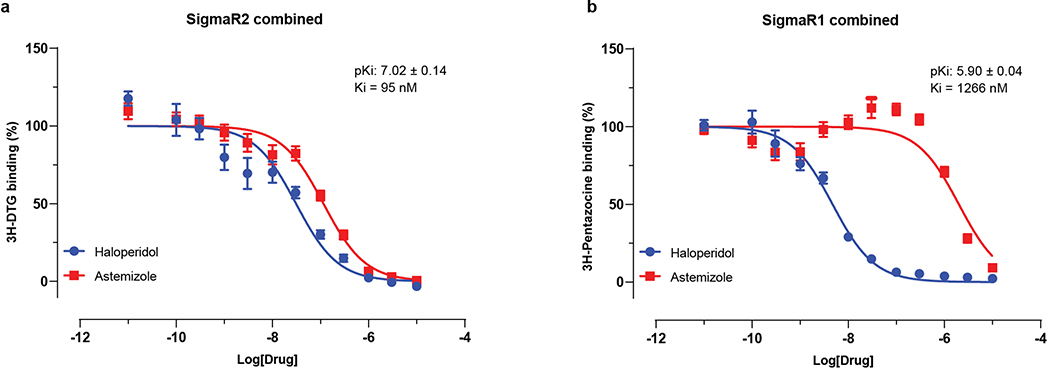
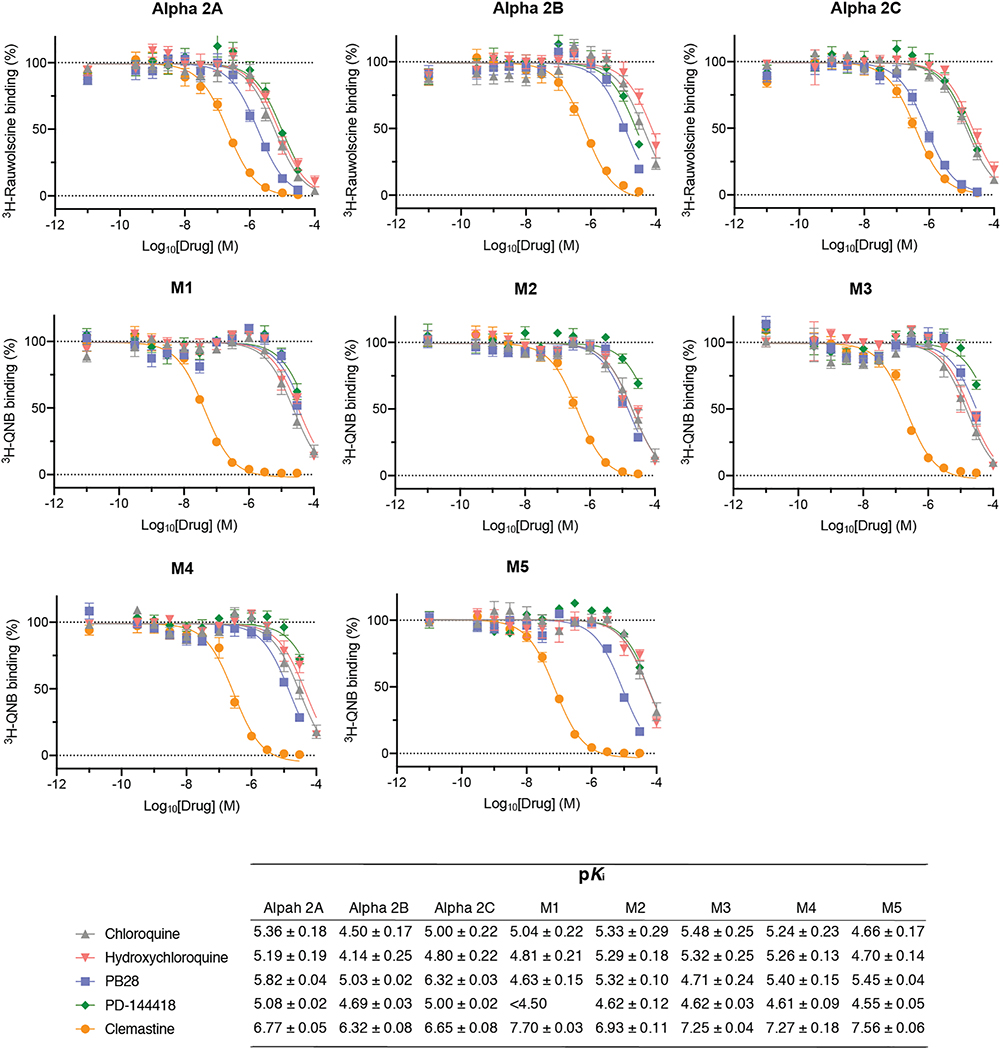
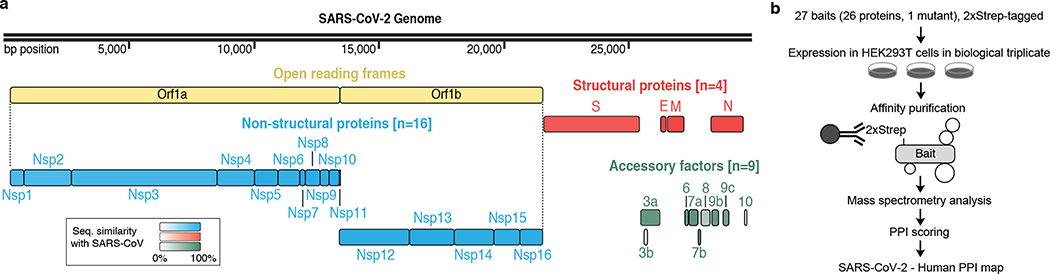
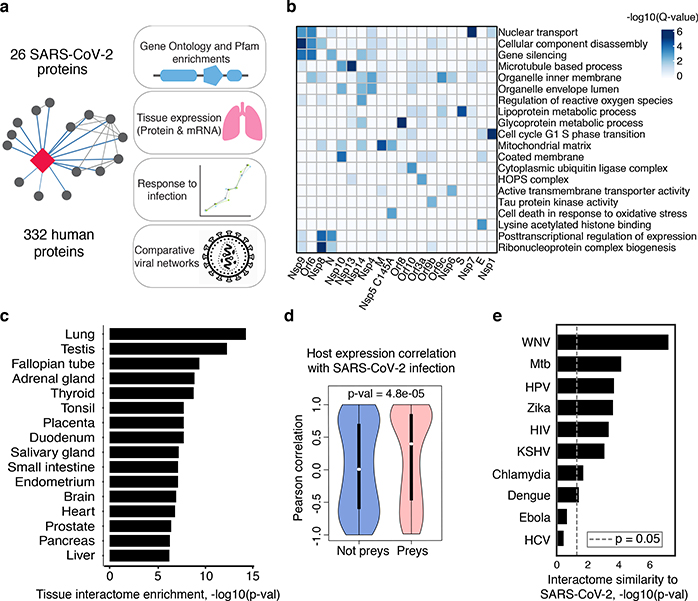
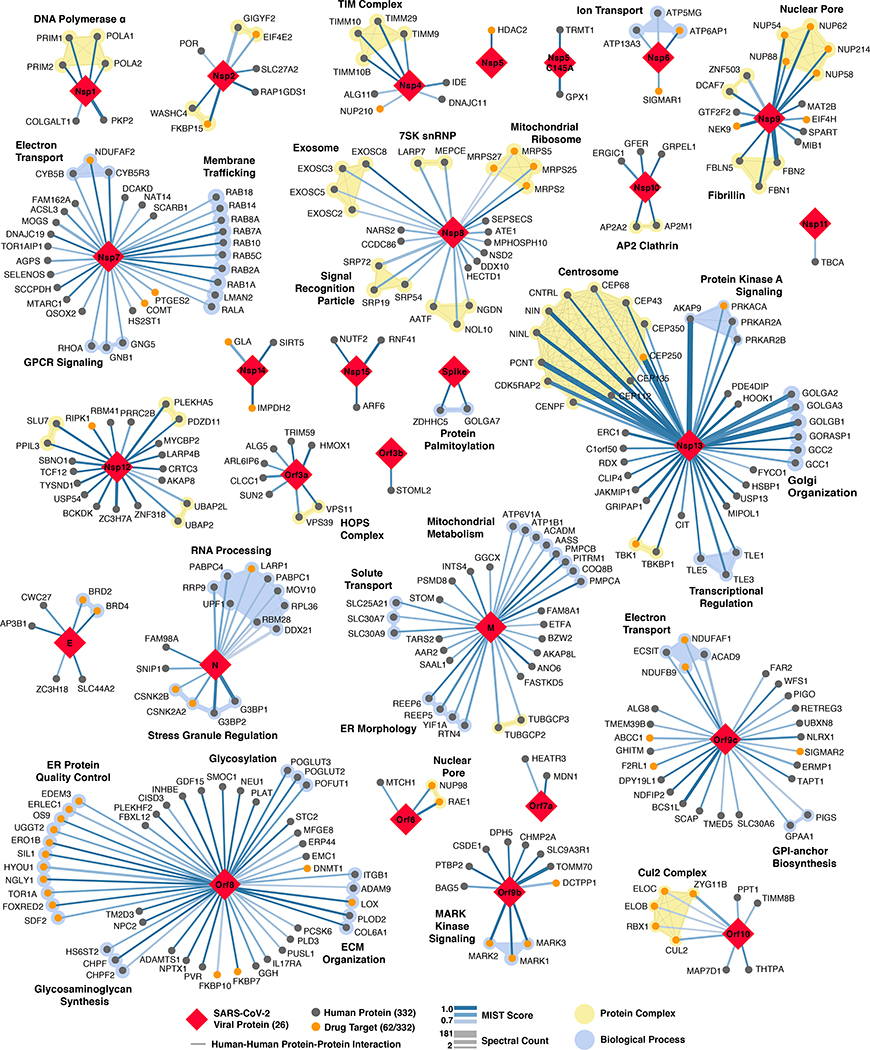
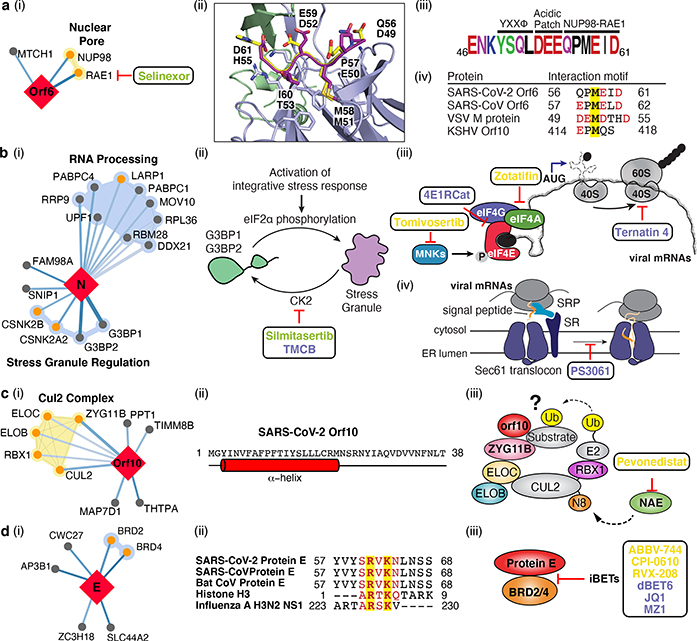
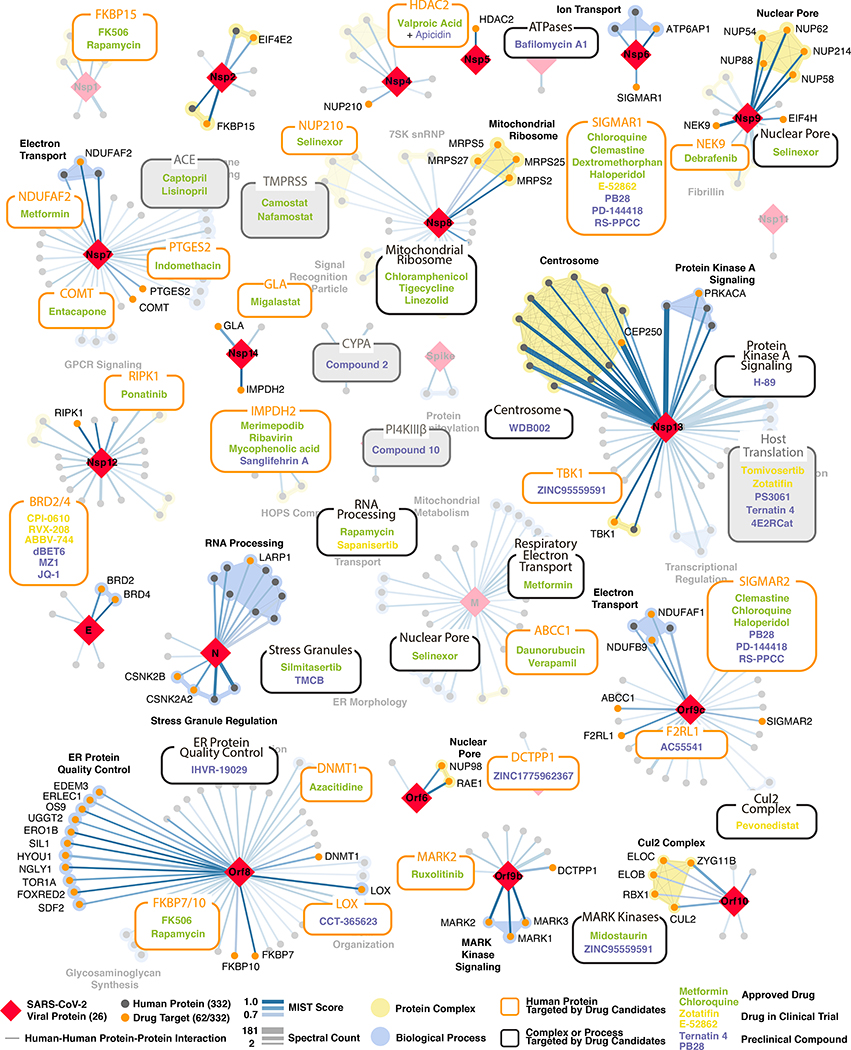
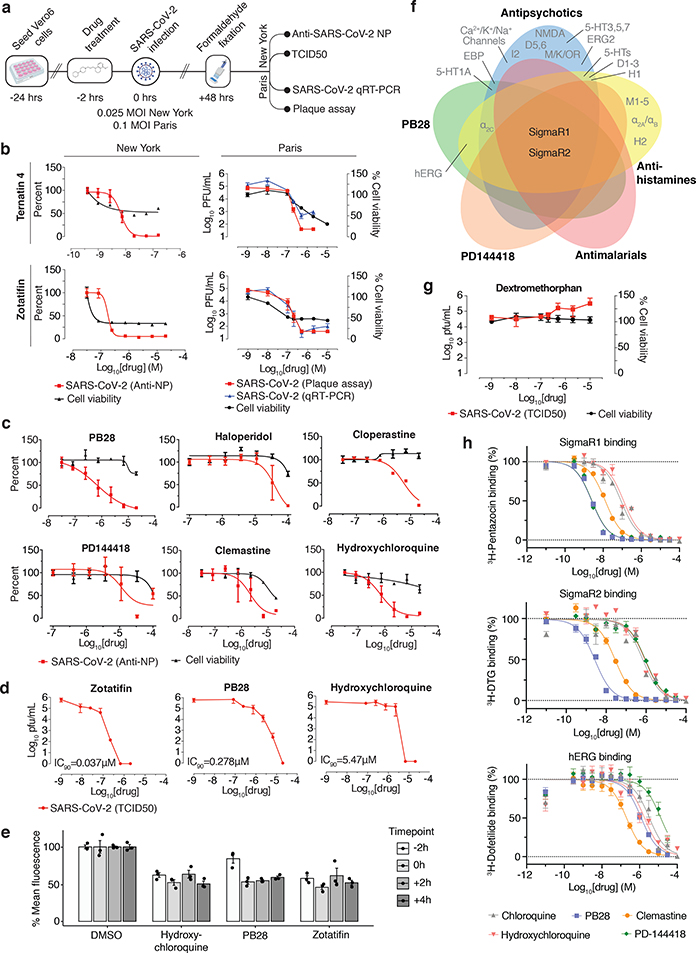
A newly described coronavirus named severe acute respiratory syndrome coronavirus 2 (SARS-CoV-2), which is the causative agent of coronavirus disease 2019 (COVID-19), has infected over 2.3 million people, led to the death of more than 160,000 individuals and caused worldwide social and economic disruption1,2. There are no antiviral drugs with proven clinical efficacy for the treatment of COVID-19, nor are there any vaccines that prevent infection with SARS-CoV-2, and efforts to develop drugs and vaccines are hampered by the limited knowledge of the molecular details of how SARS-CoV-2 infects cells. Here we cloned, tagged and expressed 26 of the 29 SARS-CoV-2 proteins in human cells and identified the human proteins that physically associated with each of the SARS-CoV-2 proteins using affinity-purification mass spectrometry, identifying 332 high-confidence protein-protein interactions between SARS-CoV-2 and human proteins. Among these, we identify 66 druggable human proteins or host factors targeted by 69 compounds (of which, 29 drugs are approved by the US Food and Drug Administration, 12 are in clinical trials and 28 are preclinical compounds). We screened a subset of these in multiple viral assays and found two sets of pharmacological agents that displayed antiviral activity: inhibitors of mRNA translation and predicted regulators of the sigma-1 and sigma-2 receptors. Further studies of these host-factor-targeting agents, including their combination with drugs that directly target viral enzymes, could lead to a therapeutic regimen to treat COVID-19.


Figures

Extended Data Figure 1.
Extended Data Figure 1.. Mutations in overlapping coding regions result in premature termination of Orf3a and Orf9c.
(a) Table of the SARS-CoV-2 proteins, including molecular weight, sequence similarity with the SARS-CoV homolog, and inferred function based on the SARS-CoV homolog. (b) Immunoblot detection of 2xStrep tag demonstrates expression of each bait in input samples, as indicated by red arrowhead. For each bait, input from one of the three replicates prepared and affinity purified for mass spectrometry was used for western blot (n=1). For gel source data, see Supplementary Figure 1. (c) Schematic representation of Orf3a (light green) and Orf3b (dark green) overlapping regions. A premature stop codon in Orf3b at position 14 (E14*) corresponds to a Q57H mutation in Orf3a. (d) Schematic of the N gene (red), Orf9b (green) and Orf9c (green) overlapping regions. Two mutations in the N protein (S194L and S197L) correspond to premature stop codons at positions 41 and 44 in Orf9c. The analysis is based on 2,784 sequences obtained from GISAID on April 4, 2020.
Extended Data Figure 2.
Extended Data Figure 2.. Clustering analysis of AP-MS dataset reveals biological replicates of individual baits are well correlated.
All MS runs (n=3 biologically independent samples, run in replicates) were compared and clustered using artMS (David Jimenez-Morales, Alexandre Rosa Campos, and John Von Dollen, and Nevan Krogan. (2019). artMS: Analytical R tools for Mass Spectrometry. R package version 1.3.9. https://github.com/biodavidjm/artMShttps://github.com/bio-davidjm/artMS). This figure depicts all Pearson’s pairwise correlations between MS runs, and is clustered according to similar correlation patterns. Correlation between replicates for individual baits ranges from 0.46–0.72, and in most cases the experiments corresponding to each bait cluster together, with the exception of a couple of baits with lower numbers of specific host interactions (e.g. E, Nsp2, Orf6, Orf3a, and Orf3b).
Extended Data Figure 3.
Extended Data Figure 3.. Gene ontology biological process enrichments for SARS-CoV-2 host factors.
We performed GO biological process enrichments (see Methods) for the host factors identified as binding to each SARS-CoV-2 viral protein and represent here the top 5 most significant terms for each viral protein. The p-values were calculated by a hypergeometric test and a false discovery rate was used to account for multiple hypothesis testing.
Extended Data Figure 4.
Extended Data Figure 4.. Pfam protein families enrichments for SARS-CoV-2 host factors.
The enrichment of individual PFAM domains was calculated using a hypergeometric test where success is defined as the number of domains, and the number of trials is the number of individual preys affinity purified with each viral bait. The population values were the numbers of individual PFAM domains in the human proteome. The p-values were not adjusted for multiple testing. To make sure that the p-values that signify enrichment were meaningful, we only considered PFAM domains that have been affinity purified at least three times with any SARS-CoV-2 protein, and which occur in the human proteome at least five times. Here, we show PFAM domains with the lowest p-value for a given viral bait protein.
Extended Data Figure 5.
Extended Data Figure 5.. Lung mRNA expression and specificity of SARS-CoV-2-interacting human proteins relative to other proteins.
(a) Scatterplot of the lung mRNA expression (TPM) versus enrichment of lung mRNA expression (lung TPM/median all tissue TPM) for human interacting proteins. Red points denote drug targets that are labeled with their gene names. Points above the horizontal blue line represent interacting proteins that are enriched in lung expression and show how most SARS-CoV-2 interacting proteins tend to be enriched in the lung. (b) Gene expression in the lung of the high-confidence human interacting proteins was observed to be higher when compared to all other proteins (blue=interacting proteins; n=332; median=25.52 TPM; grey=all other proteins; n=13583; median=3.198 TPM, p=.0007 using a t-test).
Extended Data Figure 6.
Extended Data Figure 6.. Candidate targets for the viral Nsp5 protease.
(a) Nsp5 WT and Nsp5 C145A (catalytic dead mutant) interactome. (b) Domain maps of HDAC2 and TRMT1 illustrating predicted cleavage sites (using NetCorona 1.0). HDAC: Histone Deacetylase Domain, NLS: Nuclear Localization Sequence, MTS: Mitochondrial Targeting Sequence, SAM-MT: S-adenosylmethionine-Dependent Methyltransferase Domain. (c) Peptide docking of predicted cleavage peptides into the crystal structure of SARS-CoV Nsp5. (d) Nsp5 cleavage consensus site for SARS-CoV (left) and SARS-CoV-2 (right).
Extended Data Figure 7.
Extended Data Figure 7.. Consensus analysis of SARS-CoV-2 Orf6 homologs.
(a) Sequence logo of SARS-CoV-2 Orf6 homologs, showing sequence conservation at each position computed from a multiple sequence alignment of 35 sequences. The key methionine M58, and the acidic residues E55, E59, and D61 of the putative NUP98-RAE1 binding motif are shown to be highly conserved. Homology determined from alignments to full length sequences. Colors indicated chemical properties of amino acids: polar (G, S, T, Y, C, green), neutral (Q, N, purple), basic (K, R, H, blue), acidic (D, E, red), and hydrophobic (A, V, L, I, P, W, F, M, black). (b) Multiple sequence alignment of SARS-CoV-2 Orf6 homologs. Query sequence shown at top (sequence 1 ref|YP_009724394.1). Sequence coverage (cov) and percent identity (pid) shown for each homologous sequence.
Extended Data Figure 8.
Extended Data Figure 8.. Viral growth and cytotoxicity for compounds tested in New York.
Viral growth (percent infection; red) and cytotoxicity (black) results for compounds tested at Mount Sinai in New York. Zotatifin, hydroxychloroquine, and PB28 were also tested in Median Tissue Culture Infectious Dose assay (TCID50; green). Zotafitin and Midostaurin were tested in two independent experiments and data are shown in two individual panels. Data=mean±SD; all n=3 biologically independent samples.
Extended Data Figure 9.
Extended Data Figure 9.. Virus plaque assays, qRT-PCR, and cell viability for compounds tested in Paris.
Plaque assay (viral titer; red), qRT-PCR (viral RNA; blue) and cell viability (Alamar Blue; black) results for compounds tested at the Pasteur Institute in Paris. PF-846 was tested in two independent experiments and data are shown in two individual panels. Data=mean±SD; n=3 biologically independent samples for drug-treated cells and n=5 for PS3061, n=6 for DMSO controls.
Extended Data Figure 10.
Extended Data Figure 10.. Activity of Sigma ligands.
(a) The drugs cloperastine and clemastine can be readily fit into the agonist-bound structure of the Sigma1 receptor. (b) Compounds tested for antiviral activity with annotated Sigma 1 Receptor (SIGMAR1) and/or Sigma 2 Receptor (SIGMAR2/TMEM97) activity are scatter-plotted. Inhibition pIC50 values of SARS-CoV-2 infection is shown from blue to yellow, mode of functional activity at SIGMA1R is shown by mark shape (upwards triangle: agonist, downwards triangle: antagonist, circle: binding), and pKi values for SIGMA1R and SIGMAR2 are shown along the x- and y-axes. We have not yet tested chloroquine for antiviral activity. E-52862 binding at SIGMAR2/TMEM97 is only reported to be greater than 1 μM. Activities of pimozide and olanzapine at SIGMAR2/TMEM97 have not been reported. Activity of olanzapine at SIGMAR1 is reported to be greater than 5 μM.
Extended Data Figure 11.
Extended Data Figure 11.. Astemizole is a potent Sigma2 Receptor Ligand.
Concentration response curves of astemizole from radio-ligand displacement assays for (a) the Sigma2 (95 nM IC50) and (b) the Sigma1 (1.3 uM IC50) receptors are shown. Data=mean±SEM; n= 4 independent assays on each receptor.
Extended Data Figure 12.
Extended Data Figure 12.. Off-target activities for characteristic Sigma receptor ligands.
Dose response curves against a panel of eight targets that can confer adverse cardiac, respiratory, and dry-mouth effects for chloroquine, hydroxychloroquine, PB28, PD-144418, and clemastine. These results are not meant to represent or replace a comprehensive test against off-target panels, as might commonly be assayed in drug progression for clinical use. The 8 targets include the Alpha-2A adrenergic receptors: Alpha 2A (ADRA2A), Alpha 2B (ADRA2B), and Alpha 2C (ADRA2C); as well as the Muscarinic acetylcholine receptors: M1 (CHRM1), M2, (CHRM2), M3 (CHRM3), M4 (CHRM4) and M5 (CHRM5). Data=mean±SD; all n= 3 biologically independent samples.
Figure 1:
Figure 1:. AP-MS workflow for identification of SARS-CoV-2 host protein-protein interactions.
(a) SARS-CoV-2 genome annotation, color intensity is proportional to protein sequence similarity with SARS-CoV homologs (when homologs exist). (b) Experimental workflow for AP-MS studies.
Figure 2:
Figure 2:. Global analysis of SARS-CoV-2 protein interactions.
(a) Overview of global analyses performed. (b) Gene Ontology (GO) enrichment analysis was performed on the human interacting proteins of each viral protein, p-values calculated by hypergeometric test and a false discovery rate was used to account for multiple hypothesis testing (Methods). The top GO term of each viral protein was selected for visualization. (c) Degree of differential protein expression for the human interacting proteins (n=332) across human tissues. We obtained protein abundance values for the proteome in 29 human tissues and calculated the median level of abundance for the human interacting proteins (top 16 tissues shown). This was then compared with the abundance values for the full proteome in each tissue and summarized as a Z-score from which a p-value was calculated and false discovery rate was used to account for multiple hypothesis testing. (d) The distribution of correlation of protein level changes during SARS-CoV-2 infection for pairs of viral-human proteins (median is shown) is higher than non-interacting pairs of viral-human proteins (p-value=4.8e-05, Kolmogorov–Smirnov test) The violin plots show each viral to human protein correlation for preys (n=210, min=−0.986, max=0.999, Q1=−0.468, Q2=0.396, Q3=0.850) and non-preys (n=54765, min= −0.999, max=0.999, Q1=−0.599, Q2=0.006, Q3=0.700). (e) Significance of the overlap of human interacting proteins between SARS-CoV-2 and other pathogens using a hypergeometric test (unadjusted for multiple testing). The background gene set for the test consisted of all unique proteins detected by mass spectrometry across all pathogens (n=10,181 proteins).
Figure 3:
Figure 3:. SARS-CoV-2 protein-protein interaction network.
332 high-confidence interactions between 26 SARS-CoV-2 proteins (red diamonds) and human proteins (circles; drug targets: orange; protein complexes: yellow; proteins in the same biological process: blue). Edge color proportional to MiST score; edge thickness proportional to spectral counts. Physical interactions among host proteins (thin black lines) were curated from CORUM, IntAct, and Reactome. An interactive PPI map can be found at kroganlab.ucsf.edu/network-maps. n=3 biologically independent samples.
Figure 4:
Figure 4:. The SARS-CoV-2 interactome reveals novel aspects of SARS-CoV-2 biology and pharmacological targets.
(a) Orf6 interacts with an mRNA nuclear export complex that (i) can be targeted by Selinexor. (ii) Carboxy-terminal peptide of SARS-CoV-2 Orf6 (dark purple) modeled into the binding site of the VSV M protein (yellow)-NUP98 (green)-RAE1 (light purple) complex (PDB ID: 4OWR). Orf6 and M protein residues labeled. (iii) C-terminal sequence of SARS-CoV-2 Orf6, highlighting described trafficking motifs and putative NUP98-RAE1 binding sequence. Chemical properties of amino acids: polar (green), neutral (purple), basic (blue), acidic (red), and hydrophobic (black). (iv) Putative NUP98-RAE1 interaction motifs (negatively charged residues (red) surrounding a conserved methionine (yellow)) from several viral species. (b) Protein N targets stress granule (SG) proteins (i). (ii) Inhibition of Casein kinase II (silmitasertib or TMCB) disrupting SGs. (iii) Translation initiation inhibition: MNK inhibitor (tomivosertib) prevents phosphorylation of eIF4E; 4ER1Cat blocks the interaction of eIF4E with eIF4G. Inhibition of eIF4A (zotatifin) may prevent unwinding of the viral 5’ UTR to thwart its translation. Targeting translation elongation factor-1A ternary complex (ternatin-4) or (iv) Sec61 translocon (PS3061) can prevent viral protein production and membrane insertion, respectively. (c) Orf10 interacts with the CUL2ZYG11B complex (i). (ii) Orf10 predicted secondary structure. (iii) Orf10 might hijack CUL2ZYG11B for ubiquitination of host proteins which can be inhibited by pevonedistat. (d) Envelope (E) protein interacts with bromodomain proteins (i). (ii) Alignment of proteins E of SARS-CoV-2, SARS-CoV and bat CoV with histone H3 and NS1 protein of Influenza A H3N2. Identical and similar amino acids are highlighted. (iii) Bromodomain inhibitors (iBETs) might disrupt the interaction between protein E and BRDs. Figure shows FDA approved drugs (green), clinical candidates (yellow), and preclinical candidates (purple).
Figure 5:
Figure 5:. Drug-human target network.
PPIs of SARS-CoV-2 baits with approved drugs (green), clinical candidates (yellow), and preclinical candidates (purple) with experimental activities against the host proteins (white background) or previously known host factors (grey background) are shown.
Figure 6:
Figure 6:. The anti-viral activity of the translation inhibitors and Sigma receptor ligands.
(a) Schema of viral infectivity assays. (b) The mRNA translation inhibitors (zotatifin, ternatin 4) reduce viral infectivity in a concentration-dependent matter (viral infectivity: red, Anti-NP or Plaque assay, blue, qRT-PCR; cell viability: black, with the initial decline likely reflecting cytostatic and not cytotoxic effects). Data=mean±SD; n=6 biologically independent samples for cell viability data and DMSO controls from Paris; all others n=3. (c) Sigma drugs and preclinical molecules inhibit viral infectivity (colored as in b). Data=mean±SD; n=3 biologically independent samples. (d) TCID50 assays using zotatifin, PB28 and hydroxychloroquine (e) Drugs added before or after high titer virus (MOI=2) had similar antiviral effects (viral infectivity: Anti-NP). Data=mean±SD; n=3 biologically independent samples. (f) SigmaR1 and SigmaR2 are the common targets of the Sigma ligands at the 1 μM activity threshold. (g) Dextromethorphan increases viral titers (viral titer TCID50: red; cell viability: black). Data=mean±SD; n=3 biologically independent samples. (h) SigmaR1/R2 on-target Kd values vs. those for the hERG ion channel. PB28 and PD-144418 show 500 to 5000-fold, while chloroquine and hydroxychloroquine ~30-fold selectivity between these targets. pKi values for hERG vs. SigmaR1 vs. SigmaR2 are: chloroquine (5.5±0.1; 7.1±0.1; 6.3±0.1); hydroxychloroquine (5.6±0.2; 6.9±0.2; 6.0±0.1); PB28 (6.0±0.1; 8.7±0.1; 8.6±0.1); PD-144418 (5.0±0.2; 8.7±0.1; 6.1±0.1); clemastine (6.8±0.2; 8.0±0.1; 7.6±0.1). All data are shown as mean±SD; PB28, clemastine, PD-144418 n=9 biologically independent samples for SigmaR1/R2 and hERG; chloroquine, hydroxychloroquine n=6 for SigmaR1/R2 and n=4 for hERG.

Update of

  • A SARS-CoV-2-Human Protein-Protein Interaction Map Reveals Drug Targets and Potential Drug-Repurposing.
    Gordon DE, Jang GM, Bouhaddou M, Xu J, Obernier K, O'Meara MJ, Guo JZ, Swaney DL, Tummino TA, Huettenhain R, Kaake RM, Richards AL, Tutuncuoglu B, Foussard H, Batra J, Haas K, Modak M, Kim M, Haas P, Polacco BJ, Braberg H, Fabius JM, Eckhardt M, Soucheray M, Bennett MJ, Cakir M, McGregor MJ, Li Q, Naing ZZC, Zhou Y, Peng S, Kirby IT, Melnyk JE, Chorba JS, Lou K, Dai SA, Shen W, Shi Y, Zhang Z, Barrio-Hernandez I, Memon D, Hernandez-Armenta C, Mathy CJP, Perica T, Pilla KB, Ganesan SJ, Saltzberg DJ, Ramachandran R, Liu X, Rosenthal SB, Calviello L, Venkataramanan S, Liboy-Lugo J, Lin Y, Wankowicz SA, Bohn M, Sharp PP, Trenker R, Young JM, Cavero DA, Hiatt J, Roth TL, Rathore U, Subramanian A, Noack J, Hubert M, Roesch F, Vallet T, Meyer B, White KM, Miorin L, Rosenberg OS, Verba KA, Agard D, Ott M, Emerman M, Ruggero D, García-Sastre A, Jura N, von Zastrow M, Taunton J, Ashworth A, Schwartz O, Vignuzzi M, d'Enfert C, Mukherjee S, Jacobson M, Malik HS, Fujimori DG, Ideker T, Craik CS, Floor S, Fraser JS, Gross J, Sali A, Kortemme T, Beltrao P, Shokat K, Shoichet BK, Krogan NJ. Gordon DE, et al. bioRxiv [Preprint]. 2020 Mar 27:2020.03.22.002386. doi: 10.1101/2020.03.22.002386. bioRxiv. 2020. Update in: Nature. 2020 Jul;583(7816):459-468. doi: 10.1038/s41586-020-2286-9. PMID: 32511329 Free PMC article. Updated. Preprint.

Comment in

References

    1. Wu F et al. A new coronavirus associated with human respiratory disease in China. Nature 579, 265–269 (2020). - PMC - PubMed
    1. Novel Coronavirus (2019-nCoV) situation reports. https://www.who.int/emergencies/diseases/novel-coronavirus-2019/situatio....
    1. Wang C, Horby PW, Hayden FG & Gao GF A novel coronavirus outbreak of global health concern. The Lancet vol. 395 470–473 (2020). - PMC - PubMed
    1. Zhu N et al. China Novel Coronavirus Investigating and Research Team. A novel coronavirus from patients with pneumonia in China, 2019. N. Engl. J. Med. 382, 727–733 (2020). - PMC - PubMed
    1. Su S et al. Epidemiology, Genetic Recombination, and Pathogenesis of Coronaviruses. Trends Microbiol. 24, 490–502 (2016). - PMC - PubMed

Publication types

MeSH terms