

The C:N:P:S stoichiometry of soil organic matter
- PMID: 32355381
- PMCID: PMC7175710
- DOI: 10.1007/s10533-016-0247-z
The C:N:P:S stoichiometry of soil organic matter
Abstract
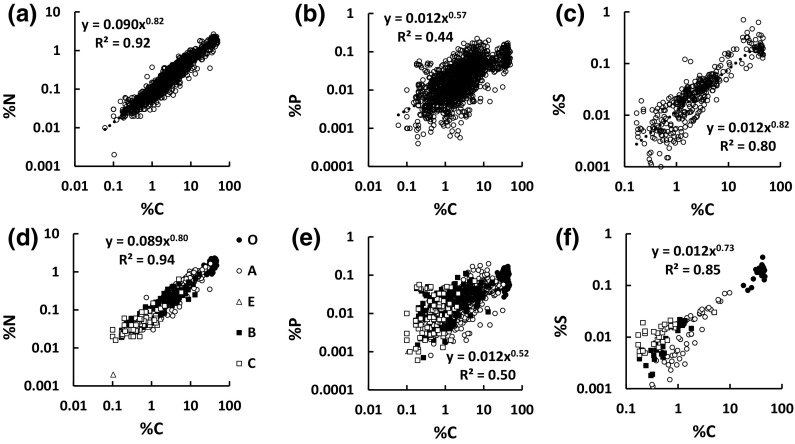
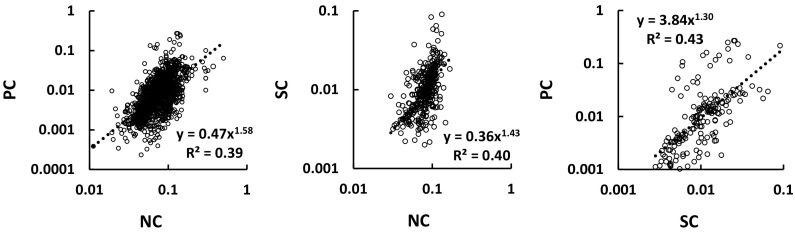
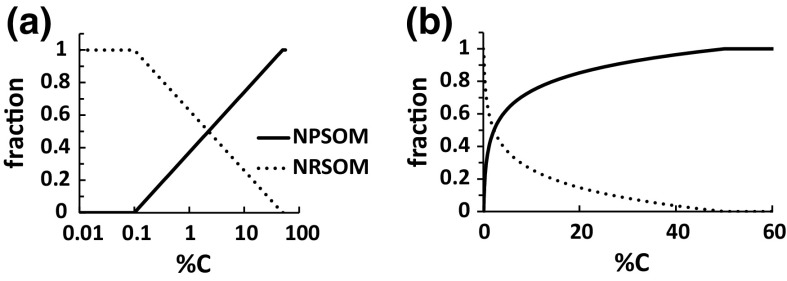
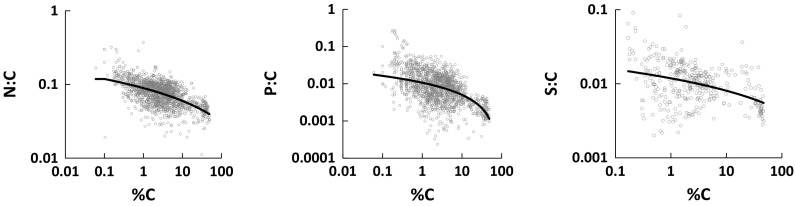
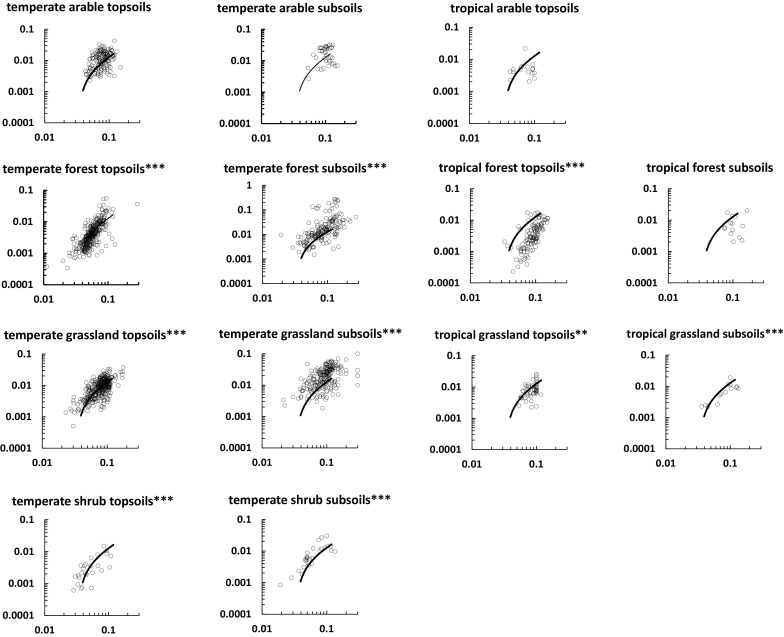
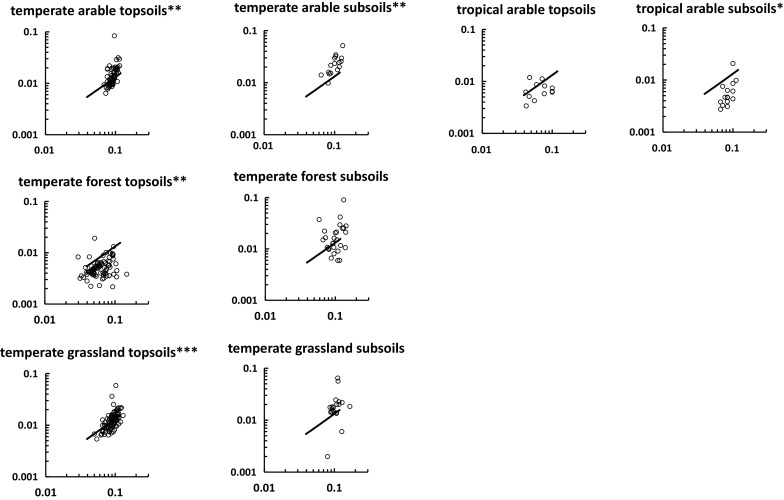
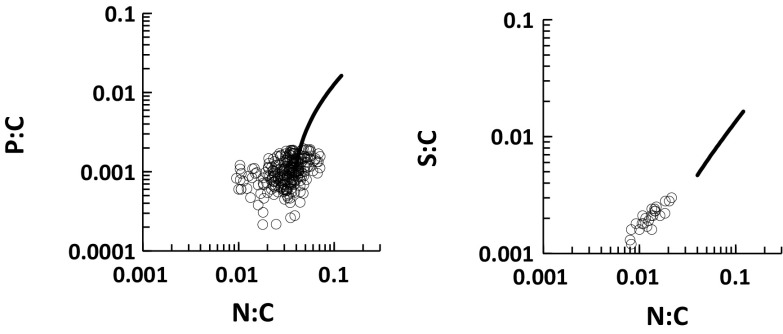
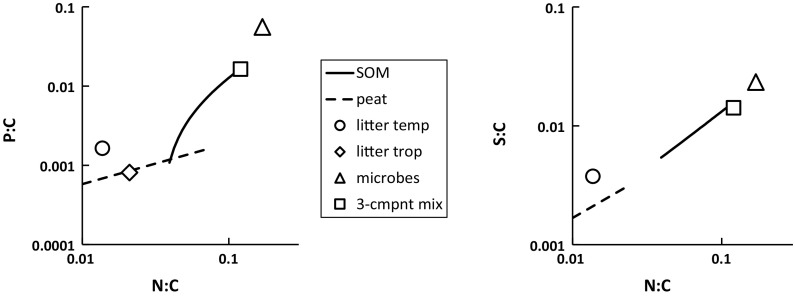
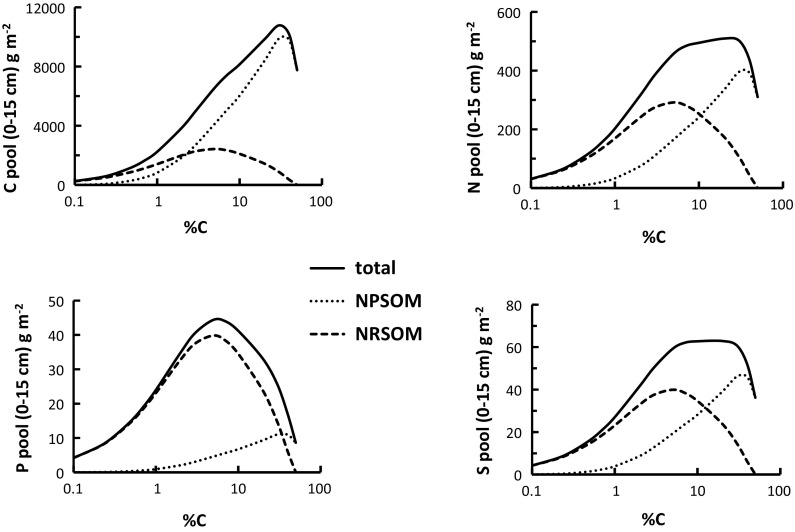
The formation and turnover of soil organic matter (SOM) includes the biogeochemical processing of the macronutrient elements nitrogen (N), phosphorus (P) and sulphur (S), which alters their stoichiometric relationships to carbon (C) and to each other. We sought patterns among soil organic C, N, P and S in data for c. 2000 globally distributed soil samples, covering all soil horizons. For non-peat soils, strong negative correlations (p < 0.001) were found between N:C, P:C and S:C ratios and % organic carbon (OC), showing that SOM of soils with low OC concentrations (high in mineral matter) is rich in N, P and S. The results can be described approximately with a simple mixing model in which nutrient-poor SOM (NPSOM) has N:C, P:C and S:C ratios of 0.039, 0.0011 and 0.0054, while nutrient-rich SOM (NRSOM) has corresponding ratios of 0.12, 0.016 and 0.016, so that P is especially enriched in NRSOM compared to NPSOM. The trends hold across a range of ecosystems, for topsoils, including O horizons, and subsoils, and across different soil classes. The major exception is that tropical soils tend to have low P:C ratios especially at low N:C. We suggest that NRSOM comprises compounds selected by their strong adsorption to mineral matter. The stoichiometric patterns established here offer a new quantitative framework for SOM classification and characterisation, and provide important constraints to dynamic soil and ecosystem models of carbon turnover and nutrient dynamics.
Keywords: Carbon; Nitrogen; Phosphorus; Protein; Soil organic matter; Stoichiometry; Sulphur.
© The Author(s) 2016.
Figures
References
-
- Ågren GI, Hyvönen R, Berglund SL, Hobbie SE. Estimating the critical N:C from litter decomposition data and its relation to soil organic matter stoichiometry. Soil Biol Biochem. 2013;67:312–318. doi: 10.1016/j.soilbio.2013.09.010. - DOI
-
- Aitchison J. The statistical analysis of compositional data. London: Chapman & Hall; 1986.
-
- Alexander EB. Bulk density equations for southern Alaska soils. Can J Soil Sci. 1989;69:177–180. doi: 10.4141/cjss89-017. - DOI
-
- Amelung W. Nitrogen biomarkers and their fate in soil. J Plant Nutr Soil Sci. 2003;166:677–686. doi: 10.1002/jpln.200321274. - DOI
-
- Amundson R. The carbon budget in soils. Ann Rev Earth Planet Sci. 2001;29:535–562. doi: 10.1146/annurev.earth.29.1.535. - DOI
LinkOut - more resources
Full Text Sources