. 2020 May 1;143(5):1476-1497.
doi: 10.1093/brain/awaa090.

Microglial exosomes facilitate α-synuclein transmission in Parkinson's disease

Affiliations

Microglial exosomes facilitate α-synuclein transmission in Parkinson's disease

Min Guo et al. Brain. .

Abstract

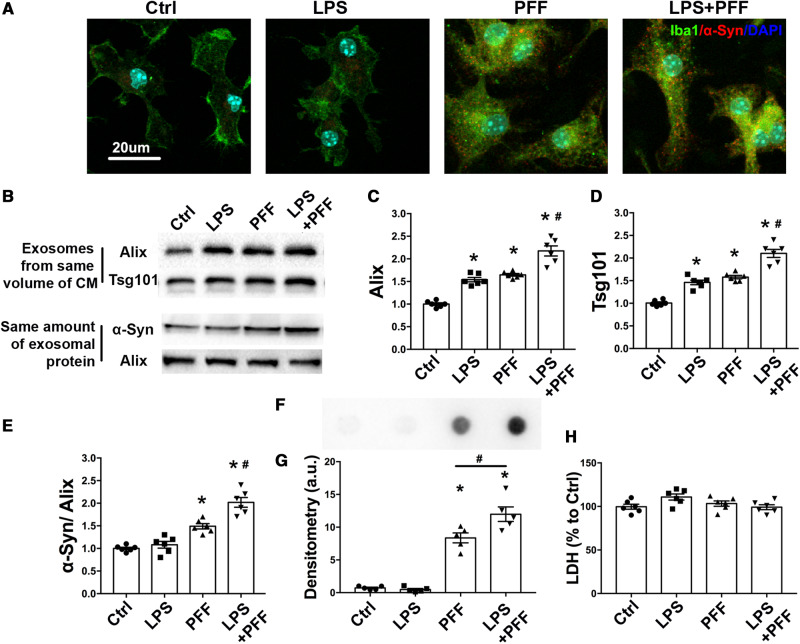
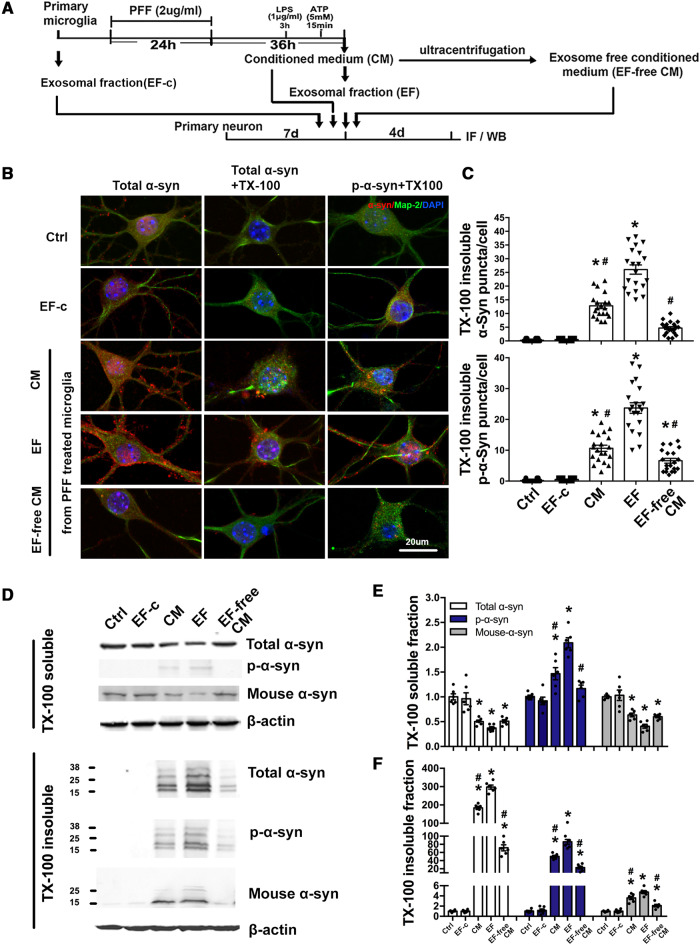
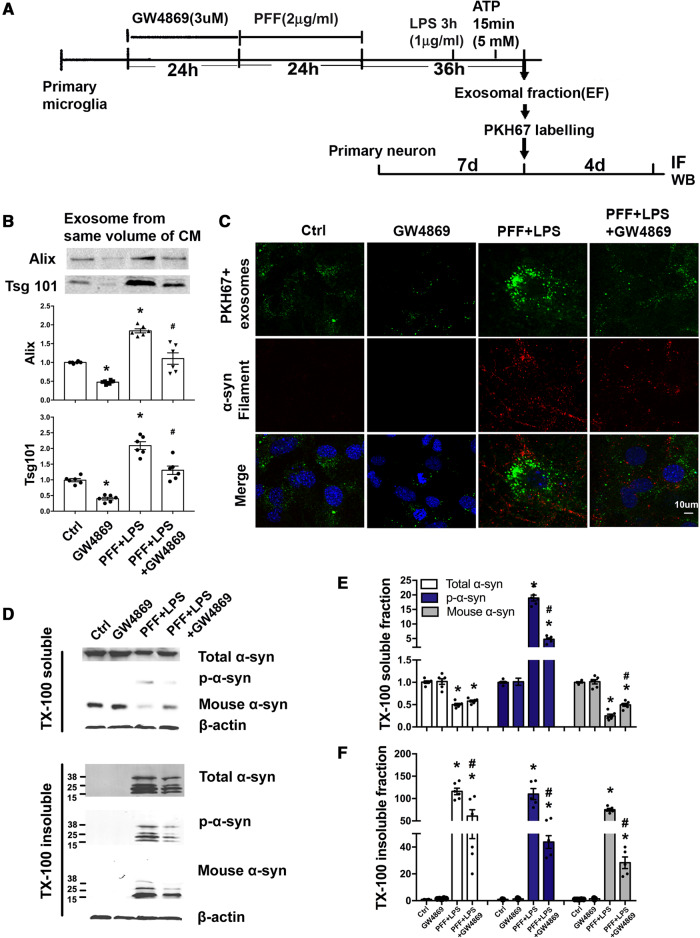
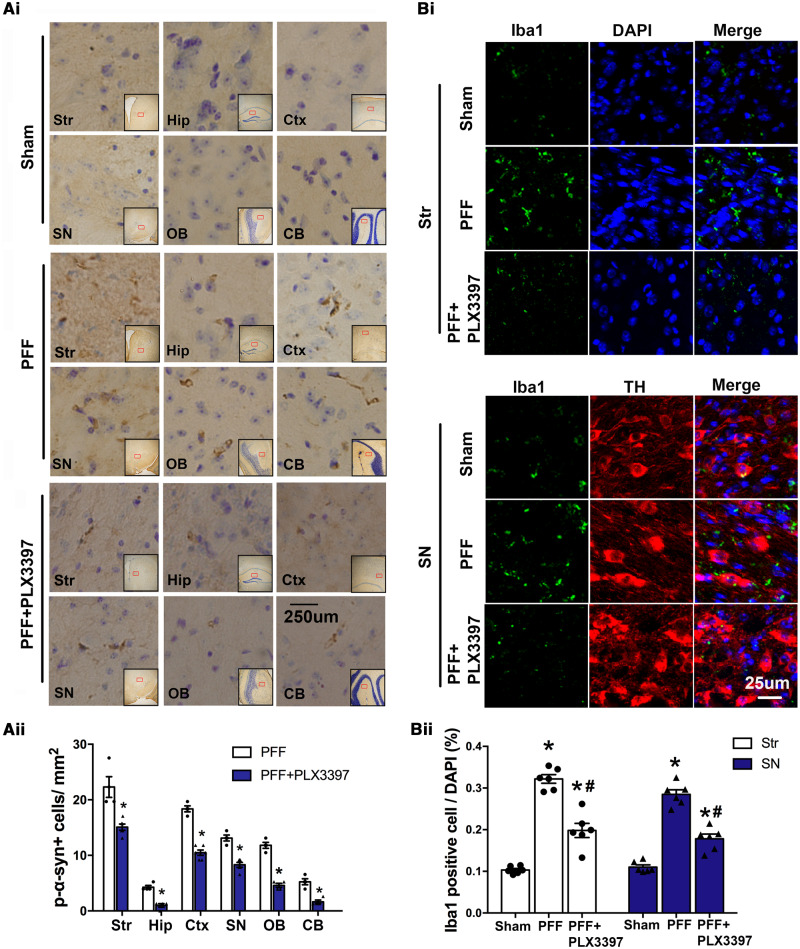
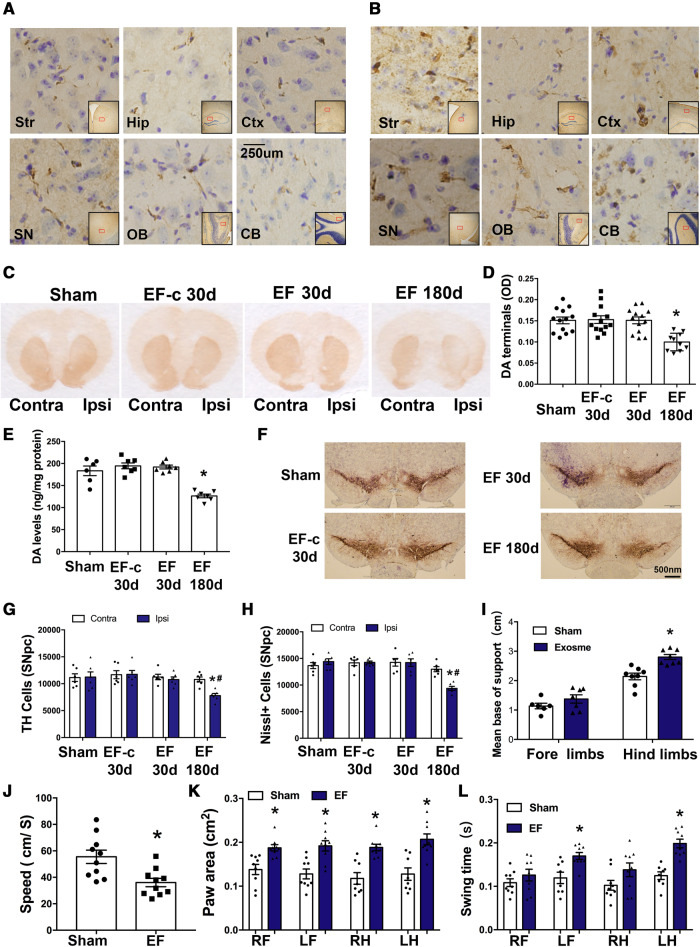
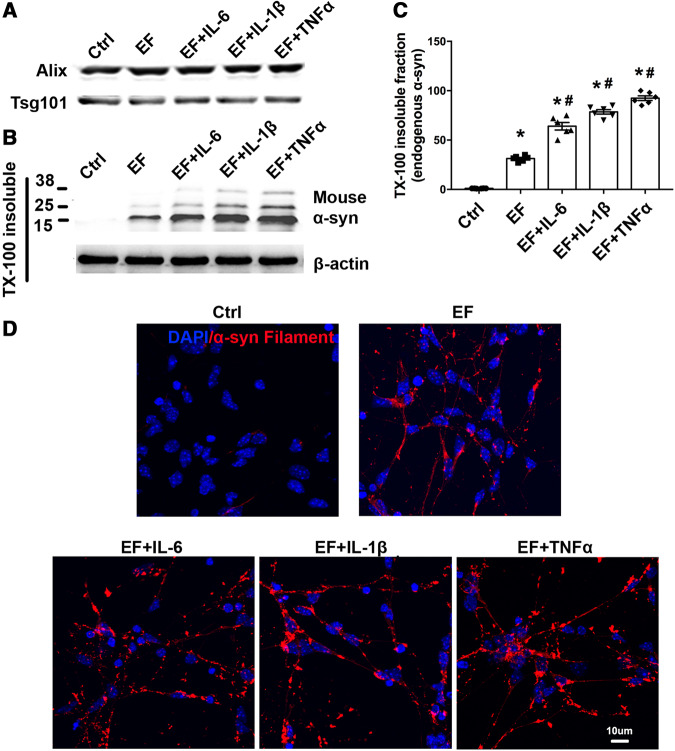
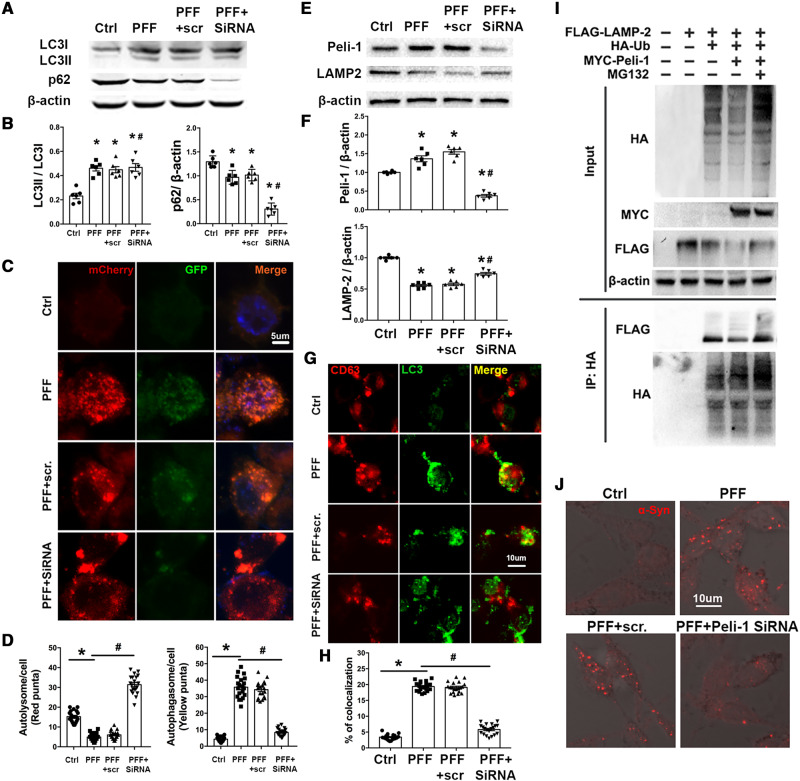
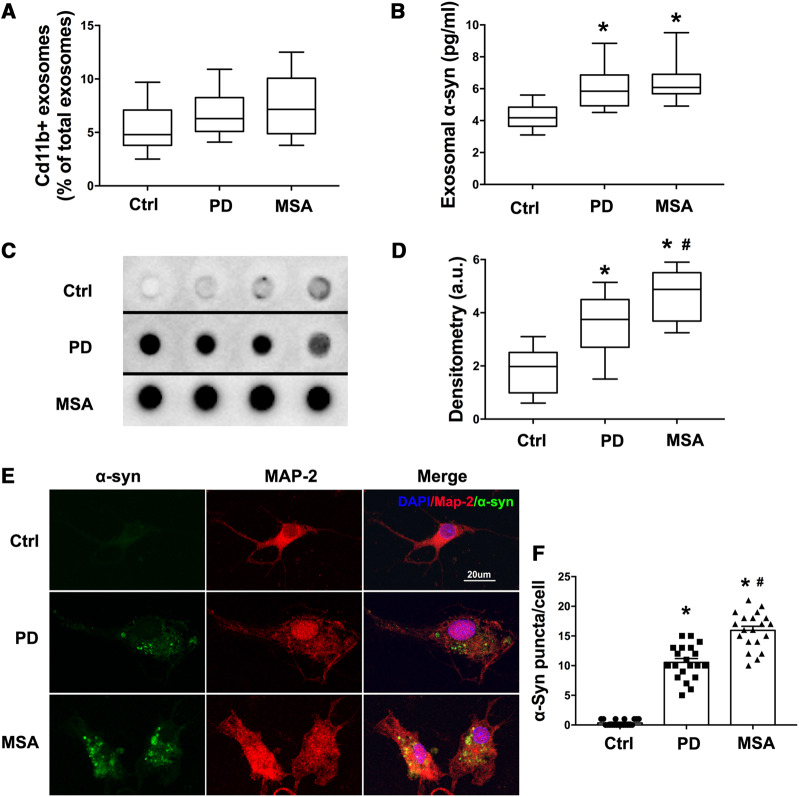
Accumulation of neuronal α-synuclein is a prominent feature in Parkinson's disease. More recently, such abnormal protein aggregation has been reported to spread from cell to cell and exosomes are considered as important mediators. The focus of such research, however, has been primarily in neurons. Given the increasing recognition of the importance of non-cell autonomous-mediated neurotoxicity, it is critical to investigate the contribution of glia to α-synuclein aggregation and spread. Microglia are the primary phagocytes in the brain and have been well-documented as inducers of neuroinflammation. How and to what extent microglia and their exosomes impact α-synuclein pathology has not been well delineated. We report here that when treated with human α-synuclein preformed fibrils, exosomes containing α-synuclein released by microglia are fully capable of inducing protein aggregation in the recipient neurons. Additionally, when combined with microglial proinflammatory cytokines, these exosomes further increased protein aggregation in neurons. Inhibition of exosome synthesis in microglia reduced α-synuclein transmission. The in vivo significance of these exosomes was demonstrated by stereotaxic injection of exosomes isolated from α-synuclein preformed fibrils treated microglia into the mouse striatum. Phosphorylated α-synuclein was observed in multiple brain regions consistent with their neuronal connectivity. These animals also exhibited neurodegeneration in the nigrostriatal pathway in a time-dependent manner. Depleting microglia in vivo dramatically suppressed the transmission of α-synuclein after stereotaxic injection of preformed fibrils. Mechanistically, we report here that α-synuclein preformed fibrils impaired autophagy flux by upregulating PELI1, which in turn, resulted in degradation of LAMP2 in activated microglia. More importantly, by purifying microglia/macrophage derived exosomes in the CSF of Parkinson's disease patients, we confirmed the presence of α-synuclein oligomer in CD11b+ exosomes, which were able to induce α-synuclein aggregation in neurons, further supporting the translational aspect of this study. Taken together, our study supports the view that microglial exosomes contribute to the progression of α-synuclein pathology and therefore, they may serve as a promising therapeutic target for Parkinson's disease.

Keywords: Parkinson’s disease; exosome; microglia; transmission; α-synuclein.


Figures

Figure 1
Figure 1
PFF treatment promotes the release of α-syn containing exosomes from microglia. Primary cultured microglia were treated with PFF (2 μg/ml) for 24 h, followed by treatment with or without LPS as described. (A) Primary cultured microglia were fixed and stained with an antibody to detect total α-syn. Scale bar = 20 μm. (BE) The exosomes were extracted from the same volume of culture medium. Immunoblotting was used to detect exosomes as evidenced by the levels of the exosomal markers Alix and TSG 101 proteins (BD). Exosomes were lysed with RIPA buffer and sonicated briefly. The same amount of exosomal protein from isolated exosomes were loaded and total α-syn levels were detected by western blotting (E). (F and G) Representative image of dot blot and scatterplots of densitometry analysis assessing misfolded α-syn in exosomes obtained from same volume of microglia culture media with different treatments. A conformation-specific antibody against α-syn oligomers was used. (H) LDH levels in culture media were measured after different treatment by ELISA. Ctrl = treatment with ATP before exosome collecting. All data represent mean ± SEM, n = 5–6 independent experiments, using one-way ANOVA followed by Newman-Keuls post hoc test, *P < 0.05 versus Ctrl, #P < 0.05 versus PFF. CM = conditioned medium.
Figure 2
Figure 2
Exosomes from PFF-treated microglia induces α-syn aggregation in recipient neurons. (A) Schematic diagram illustrating the timeline of experimental approach. Briefly, primary cultured microglia were treated with PFF, then PFF were removed and cells were washed with fresh culture medium to avoid the contamination of PFF, followed by the treatment of LPS and ATP. Exosomes from microglia culture medium were isolated. Primary cortical neurons were incubated for 4 days with conditioned medium (CM), extracted exosomes or exosomes-free medium (EF-free CM) from microglia. Ctrl = no-treatment control; EF = exosomes from PFF-treated microglia; EF-c = exosomes from untreated microglia. (B) Neurons were then fixed with PFA alone or PFA with 1% TX-100 to extract soluble proteins, followed by immunostaining for total α-syn and p-α-syn. CM and EF induced α-syn aggregation in neurons. Scale bar = 20 μm. (C) The quantitative data of TX-100 insoluble α-syn aggregation in recipient neurons. *P < 0.05 versus Ctrl, #P < 0.05 versus EF. (DF) Representative immunoblots and quantitative data of TX-100 soluble and insoluble α-syn in recipient neurons. TX-100 soluble and insoluble fractions of neurons were isolated and analysed using indicated antibodies. *P < 0.05 versus Ctrl, #P < 0.05 versus EF. Data represent mean ± SEM, one-way ANOVA followed by Newman-Keuls post hoc test, n = 4–6 independent experiments. IF = immunofluorescence; WB = western blot.
Figure 3
Figure 3
GW4869 suppresses secretion of microglial exosomes and transmission of α-syn to neurons. (A) Schematic diagram illustrating the timeline and experimental procedures. Primary microglia were treated with either GW4869, PFF, or GW4869 first followed by PFF before LPS and ATP. Ctrl = treatment with ATP before collecting exosome; IF = immunofluorescence. (B) The same volume of microglial culture medium from different experimental conditions was extracted for exosomes, whose levels were determined by western blotting using Alix and Tsg101. (C) GW4869 treatment reduced exosome internalization into neurons resulting in less α-syn aggregation. Exosomes isolated from the same volume of microglia culture medium from different experimental conditions were labelled with the dye PKH67. These exosomes were then added to recipient neurons and incubated for 4 days. Neurons were fixed with 4% PFA and α-syn filament staining was performed. (DF) Quantitative data and representative immunoblots of TX-100 soluble and insoluble α-syn in recipient neurons. *P < 0.05 versus Ctrl, #P < 0.05 versus PFF+LPS. Data represent mean ± SEM, one-way ANOVA followed by Newman-Keuls post hoc test, n = 3–6 independent experiments.
Figure 4
Figure 4
Microglial depletion suppresses α-syn propagation in PFF injected mice. Mice were injected with PFF in the striatum. One month before and after this injection, mice were fed with standard or chow containing PLX3397, a chemical that depletes microglia. Mice were then sacrificed 30 days after PFF injection and brain samples were analysed using immunostaining. [A(i)] In addition to the striatum, p-α-syn was also detected in the ipsilateral hippocampus, cortex, substantia nigra, olfactory bulb, and cerebellum 30 days after PFF injection. [A(ii)] Quantification of the p-α-syn cells in different brain regions (n = 4–6 mice/group, 20 images per region). Data represent mean ± SEM, independent t-test, *P < 0.05 versus PFF. [B(i and ii)] Using immunofluorescence for Iba1, the number of microglia in the striatum and SN 30 days after PFF injection was quantified (n = 6 mice/group, 24 images per group). One-way ANOVA followed by Newman-Keuls post hoc test, data represent mean ± SEM, *P < 0.05 versus Sham, #P < 0.05 versus PFF. Sham = mice were injected with same volume of D-PBS. CB = cerebellum; Ctx = cortex; Hip = hippocampus; OB = olfactory bulb; SN = substantia nigra; Str = striatum.
Figure 5
Figure 5
Exosomes derived from PFF-treated microglia induces α-syn transmission, dopaminergic neuron degeneration and behavioural changes. (A and B) Mice were stereotaxically injected with EF into the right dorsal striatum. Representative images show accumulation of p-α-syn (brown) in different ipsilateral regions at 30 days (A) or 180 days (B) after the injection. (CE) Striatal dopamine terminals and total dopamine levels were measured at either 30 days or 180 days after injection. The OD level of dopamine terminals (D) showed a 40% decrease and total dopamine levels (E) showed ∼30–35% decrease in hemisphere ipsilateral to injection. Data represent mean ± SEM, one-way ANOVA followed by Newman-Keuls post hoc test, *P < 0.05 versus Sham. (FH) TH-immunostaining and stereological cell counting of TH-immunoreactive neurons and Nissl-positive neurons in the SNpc. Approximately 33% of TH cells were lost at 180 days in hemisphere ipsilateral to injection. Data represent mean ± SEM, two-way ANOVA followed by Newman-Keuls post hoc test *P < 0.05 versus Sham, #P < 0.05 versus contralateral side. (IL) Gait analysis was performed 180 days after injection to evaluate locomotor activities. Results were analysed with independent t-test, *P < 0.05 versus Sham. n = 6–8 mice/group. Sham = mice were injected with same volume of D-PBS; EF-c = exosomes from D-PBS treated microglia (control exosome); and EF = exosomes from PFF treated microglia. CB = cerebellum; Contra = contralateral side; Ctx = cortex; Hip = hippocampus; Ipsi = ipsilateral side; LF = left forelimb; LH = left hindlimb; OB = olfactory bulb; RF = right forelimb; RH = right hindlimb; SN = substantia nigra; Str = striatum.
Figure 6
Figure 6
Inflammatory cytokines enhanced α-syn aggregation after microglial exosome treatment. (A) Exosome from PFF treated microglia were purified. (B and C) Primary neurons were treated with EF, EF+TNF-α, EF+IL-1b or EF+ IL-6 for 4 days. TX-100 insoluble fractions of neurons with different treatments were isolated and analysed by targeting endogenous α-syn. Forty micrograms of total protein was loaded. Ctrl = no treatment control. (D) TX-100 insoluble total α-syn aggregation staining was performed. Scale bar = 10 μm. Data represent mean ± SEM, n = 3–6 independent experiments. One-way ANOVA followed by Newman-Keuls post hoc testing, *P < 0.05 versus Ctrl, #P < 0.05 versus EF.
Figure 7
Figure 7
PFF treatment increases the degradation of LAMP2 through ubiquitin-proteasome system after ubiquitination by PELI1 in BV-2 cells, thus impairing the autophagy flux and enhances the fusion of autophagysomes and MVBs. (A and B) Western blotting of LC3 and p62 levels in BV-2 cells following PFF treatment (2 μg/ml; 24 h) with or without Peli1 siRNA. n = 6 independent experiments. (C) Representative images of BV-2 cells transfected with Ad-mCherry-GFP-LC3B adenovirus following PFF (2 μg/ml, 24 h) with/without Peli1 siRNA. Scale bar = 5 μm. (D) The number of red (autolysome) and yellow puncta (autophagasome) per cell were determined using ImageJ. Twenty cells from three independent experiments were analysed in each group. (E and F) Western blot analysis of LAMP2 and PELI1 levels in BV-2 cells following PFF treatment (2 μg/ml; 24 h) with or without Peli1 siRNA. n = 6 independent experiments. Data were analysed using Image Lab (version 5.2.1). (G) Confocal microscopy analysis of the MVB marker CD63 (red) and LC3 autophagysomes (green). BV-2 cells were treated with PFF (2 μg/ml, 24 h) with/without Peli1 siRNA. Scale bar = 10 μm. (H) Co-localization of CD63 (MVB) with LC3 (autophagysome) was measured in BV-2 cells. Twenty cells from three independent experiments were analysed in each group. (I) Western blot analysis of poly-ubiquitination of LAMP2 by PELI1 in vivo. FLAG-LAMP2 and HA-ubiquitin were transiently expressed in HEK293 cells with MYC-PELI1. The cells were treated with MG132 (20 μM) for 7 h before analysis. Antibodies to HA and FLAG were used to visualized ubiquitinated LAMP2 following immunoprecipitation with HA beads. (J) Confocal microscopy analysis of p-syn in BV-2 cells treated with PFF (2 μg/ml, 24 h) ± Peli1 siRNA. Scale bar = 10 μm. n = 6 independent experiments. Data represent mean ± SEM. One-way ANOVA followed by Newman-Keuls post hoc testing. *P <0.05 versus Ctrl, #P <0.05 versus PFF.
Figure 8
Figure 8
CD11+ exosomes derived from CSF of Parkinson’s disease patients contain α-syn oligomer and are able to induce α-syn aggregation in neurons. (A) Exosomes from 150 μl CSF were isolated and then detected using flow cytometer with a CD11b-FITC antibody to label microglia/macrophage derived exosomes [minimum (Ctrl: 2.5; Parkinson’s disease: 4.1; MSA: 3.8); 25%ile (Ctrl: 3.8; Parkinson’s disease: 5.1; MSA: 4.875); median (Ctrl: 4.8; Parkinson’s disease: 6.3; MSA: 7.15); 75%ile (Ctrl: 7.1; Parkinson’s disease: 8.25; MSA: 10.06); maximum (Ctrl: 9.7; Parkinson’s disease: 10.9; MSA : 12.5)]. (B) CD11b+ exosomes were isolated from 5 ml CSF and total α-syn were measured by ELISA [minimum (Ctrl: 3.103; Parkinson’s disease: 4.509; MSA: 4.909); 25%ile (Ctrl: 3.642; Parkinson’s disease: 4.926; MSA: 5.688); median (Ctrl: 4.175; Parkinson’s disease: 5.849; MSA: 6.076); 75%ile (Ctrl: 4.842; Parkinson’s disease: 6.862; MSA: 6.904); maximum (Ctrl: 5.6; Parkinson’s disease: 8.849; MSA: 9.509)]. (C) Representative image of dot blot on CD11b+ exosomes isolated from 200 μl CSF using a conformation specific α-syn antibody, which recognizes amino acid sequence-independent oligomers of α-syn. Images of four patients in every group are shown. (D) Densitometry analysis of the dot blot assessing the misfolded α-syn in CD11b+ exosomes from patients [minimum (Ctrl: 0.6; Parkinson’s disease: 1.509; MSA: 3.249); 25%ile (Ctrl: 0.9877; Parkinson’s disease: 2.703; MSA: 3.688); median (Ctrl: 1.976; Parkinson’s disease: 3.747; MSA: 4.876); 75%ile (Ctrl: 2.509; Parkinson’s disease: 4.496; MSA: 5.507); maximum (Ctrl: 3.103; Parkinson’s disease: 5.143; MSA: 5.903)]. (E) CD11b+ exosomes isolated from the 3 ml CSF of patients were added to neurons. Proteinase K-resistant α-syn aggregation was detected after 4 days. (F) The quantitative data of α-syn puncta in neurons. Data are shown as mean ± SEM. One-way ANOVA followed by Newman-Keuls post hoc testing, *P < 0.05 versus Ctrl, #P < 0.05 versus Parkinson’s disease. PD = Parkinson’s disease.

Similar articles

Cited by

References

    1. Aguzzi A, Barres BA, Bennett ML.. Microglia: scapegoat, saboteur, or something else? Science 2013; 339: 156–61. - PMC - PubMed
    1. Alvarez-Erviti L, Seow Y, Schapira AH, Gardiner C, Sargent IL, Wood MJ, et al.Lysosomal dysfunction increases exosome-mediated alpha-synuclein release and transmission. Neurobiol Dis 2011; 42: 360–7. - PMC - PubMed
    1. Anglade P, Vyas S, Javoy-Agid F, Herrero MT, Michel PP, Marquez J, et al.Apoptosis and autophagy in nigral neurons of patients with Parkinson’s disease. Histol Histopathol 1997; 12: 25–31. - PubMed
    1. Asai H, Ikezu S, Tsunoda S, Medalla M, Luebke J, Haydar T, et al.Depletion of microglia and inhibition of exosome synthesis halt tau propagation. Nat Neurosci 2015; 18: 1584–93. - PMC - PubMed
    1. Baixauli F, Lopez-Otin C, Mittelbrunn M.. Exosomes and autophagy: coordinated mechanisms for the maintenance of cellular fitness. Front Immunol 2014; 5: 403. - PMC - PubMed

Publication types

Substances