Review
. 2020 Jun 7;49(11):3525-3564.
doi: 10.1039/d0cs00098a. Epub 2020 May 1.

QSAR without borders

Affiliations
Review

QSAR without borders

Eugene N Muratov et al. Chem Soc Rev. .

Erratum in

  • Correction: QSAR without borders.
    Muratov EN, Bajorath J, Sheridan RP, Tetko IV, Filimonov D, Poroikov V, Oprea TI, Baskin II, Varnek A, Roitberg A, Isayev O, Curtarolo S, Fourches D, Cohen Y, Aspuru-Guzik A, Winkler DA, Agrafiotis D, Cherkasov A, Tropsha A. Muratov EN, et al. Chem Soc Rev. 2020 Jun 8;49(11):3716. doi: 10.1039/d0cs90041a. Chem Soc Rev. 2020. PMID: 32441715

Abstract

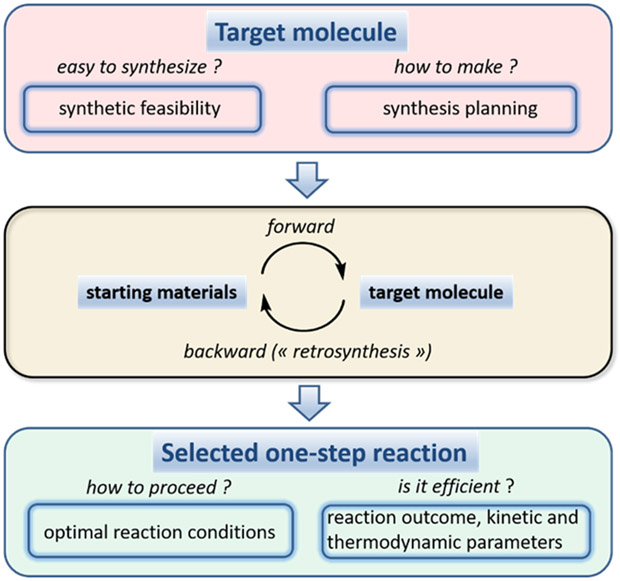
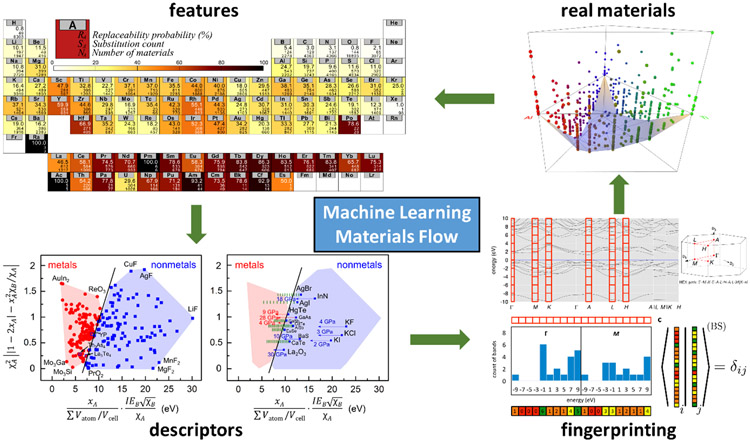
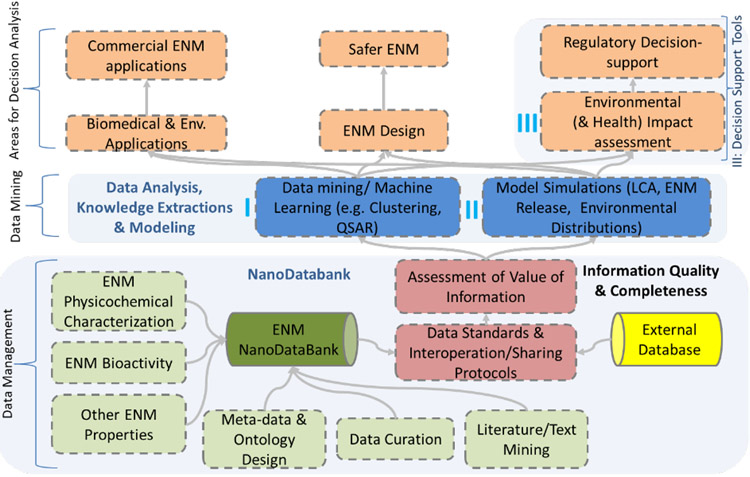
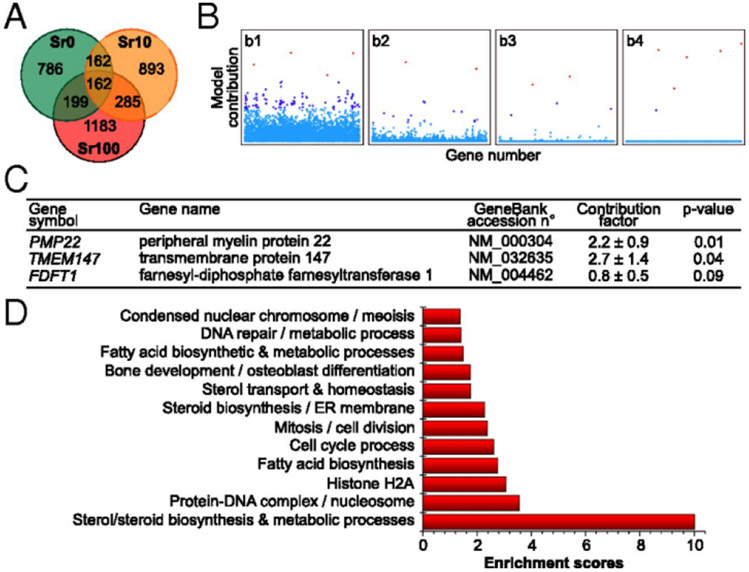
Prediction of chemical bioactivity and physical properties has been one of the most important applications of statistical and more recently, machine learning and artificial intelligence methods in chemical sciences. This field of research, broadly known as quantitative structure-activity relationships (QSAR) modeling, has developed many important algorithms and has found a broad range of applications in physical organic and medicinal chemistry in the past 55+ years. This Perspective summarizes recent technological advances in QSAR modeling but it also highlights the applicability of algorithms, modeling methods, and validation practices developed in QSAR to a wide range of research areas outside of traditional QSAR boundaries including synthesis planning, nanotechnology, materials science, biomaterials, and clinical informatics. As modern research methods generate rapidly increasing amounts of data, the knowledge of robust data-driven modelling methods professed within the QSAR field can become essential for scientists working both within and outside of chemical research. We hope that this contribution highlighting the generalizable components of QSAR modeling will serve to address this challenge.


Conflict of interest statement

Conflicts of interest

There are no conflicts to declare.

Figures

Figure 1.
Figure 1.
Data cycle associated with QSAR modeling projects.
Figure 2.
Figure 2.
Different SAR patterns. Shown are inhibitors of tyrosine kinase ABL forming different SARs. For each compound the logarithmic potency (pKi) value is reported. At the top, SAR continuity is observed where gradually changes in compound structure (traced by horizontal arrows) are accompanied by moderate potency alterations. By contrast, the inhibitors at the bottom display SAR discontinuity. Here, small structural modifications lead to large changes in potency. Vertical arrows indicate the formation of pairwise activity cliffs.
Figure 3.
Figure 3.
Comparison of the Pearson R2 values for models generated using DNN (blue) or XGBoost (red and green) and random forest methods.
Figure 4.
Figure 4.
Proteochemometrics approach enables accurate affinity estimates for novel ligand-target pairs.
Figure 5.
Figure 5.
Main tasks of computer-aided synthesis design. As soon as a synthesis planning for a target molecule is established, efficiency of each one-step reaction and related optimal reaction conditions could be assessed.
Figure 6.
Figure 6.
ML Materials Flow is a combination of feature extraction, descriptor analysis, structure fingerprinting (representations) of databases, and materials synthesizability. Figure reproduced from Refs.,-
Figure 7.
Figure 7.
Nanoinformatics elements of environmental and health impact assessment for nanomaterials
Figure 8.
Figure 8.
Changes in hMSC global mRNA expression mediated by treatment with BG- and SrBG-conditioned media. (A) Operation of the EM algorithm, showing progressive nulling of lower genes less relevant to the SrBG treatment. (B) The contribution (mean ± SE) of the most significant genes identified by sparse feature analysis. (C) Functional annotation clustering analysis of differentially expressed genes in response to Sr100 treatment compared with control. Reproduced from Ref.
Figure 9.
Figure 9.
SPE map of the correlation distances of the clinical and robotic parameters for the completers cohort. The map was derived by computing the pairwise Pearson correlation coefficients (R) for all pairs of features, converting them to correlation distances (1-abs(R)), and embedding the resulting matrix into 2 dimensions in such a way that the distances of the points on the map approximate as closely as possible the correlation distances of the respective features. The clinical parameters are highlighted in red, the robotic parameters on the affected side in blue, and the robotic parameters on the unaffected side in green. The map also shows distinct clusters of correlated variables which are preserved on both the affected and unaffected sides (outlined by green and blue ellipses, respectively).

References

    1. Hansch C, Maloney P, Fujita T and Muir R, Nature, 1962, 194, 178–180.
    1. Cherkasov A, Muratov EN, Fourches D, Varnek A, Baskin II, Cronin M, Dearden JC, Gramatica P, Martin YC, Todeschini R, Consonni V, Kuz’min VEVE, Cramer RD, Benigni R, Yang C, Rathman JF, Terfloth L, Gasteiger J, Richard AM and Tropsha A, J. Med. Chem, 2014, 57, 4977–5010. - PMC - PubMed
    1. Ban F, Dalal K, Li H, LeBlanc E, Rennie PS and Cherkasov A, J. Chem. Inf. Model, 2017, 57, 1018–1028. - PubMed
    1. Alves VM, Muratov EN, Zakharov A, Muratov NN, Andrade CH and Tropsha A, Food Chem. Toxicol, 2018, 112, 526–534. - PMC - PubMed
    1. Simón-Vidal L, García-Calvo O, Oteo U, Arrasate S, Lete E, Sotomayor N and González-Díaz H, J. Chem. Inf. Model, 2018, 58, 1384–1396. - PubMed

Substances