. 2020 Sep;92(9):1615-1628.
doi: 10.1002/jmv.25866. Epub 2020 May 13.

Mathematical modeling of interaction between innate and adaptive immune responses in COVID-19 and implications for viral pathogenesis

Affiliations

Mathematical modeling of interaction between innate and adaptive immune responses in COVID-19 and implications for viral pathogenesis

Sean Quan Du et al. J Med Virol. 2020 Sep.

Abstract

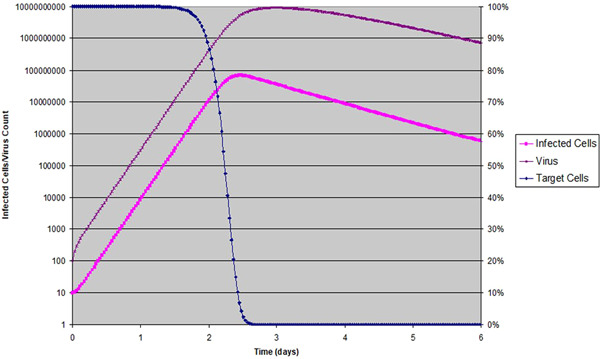
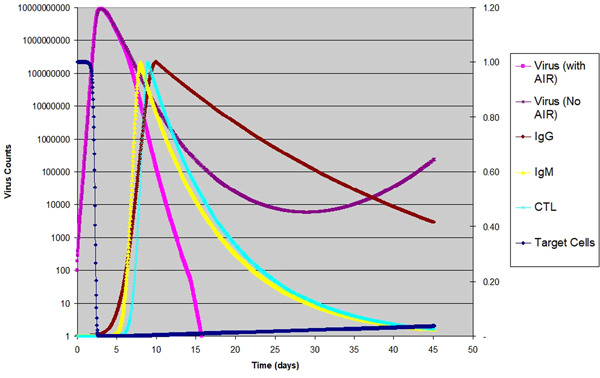
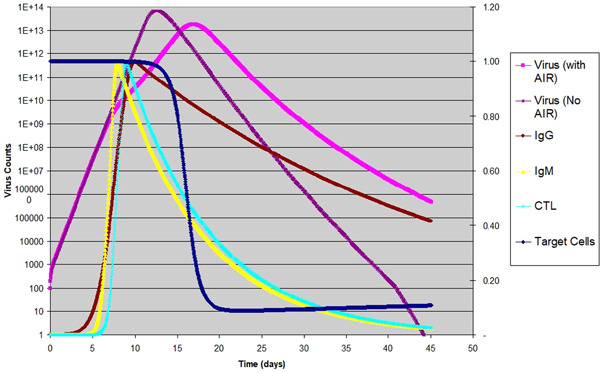
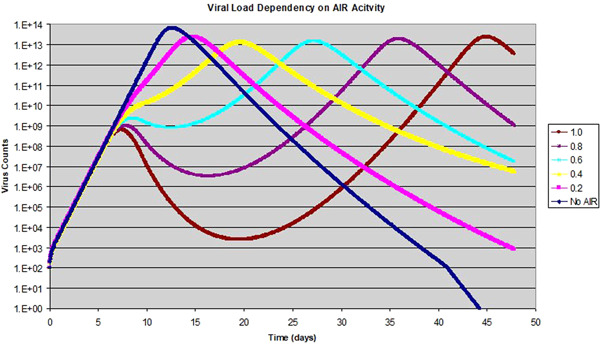
We have applied mathematical modeling to investigate the infections of the ongoing coronavirus disease-2019 (COVID-19) pandemic caused by SARS-CoV-2 virus. We first validated our model using the well-studied influenza viruses and then compared the pathogenesis processes between the two viruses. The interaction between host innate and adaptive immune responses was found to be a potential cause for the higher severity and mortality in COVID-19 patients. Specifically, the timing mismatch between the two immune responses has a major impact on disease progression. The adaptive immune response of the COVID-19 patients is more likely to come before the peak of viral load, while the opposite is true for influenza patients. This difference in timing causes delayed depletion of vulnerable epithelial cells in the lungs in COVID-19 patients while enhancing viral clearance in influenza patients. Stronger adaptive immunity in COVID-19 patients can potentially lead to longer recovery time and more severe secondary complications. Based on our analysis, delaying the onset of adaptive immune responses during the early phase of infections may be a potential treatment option for high-risk COVID-19 patients. Suppressing the adaptive immune response temporarily and avoiding its interference with the innate immune response may allow the innate immunity to more efficiently clear the virus.

Keywords: COVID-19; SARS-CoV-2; adaptive immunity; antiviral drugs; innate immunity; target cell-limited model.


Conflict of interest statement

The authors declare that there are no conflict of interests.

Figures

Figure 1
Figure 1
Target cell‐limited model of Influenza virus infection in human host: Target cells TT0 as a ratio is shown in percentage with linear scale to the right; infected cells and virus counts are shown in log scale to the left
Figure 2
Figure 2
Influenza virus infection in human host: Virus counts of the same infection with and without AIR are shown in log scale to the left; target cells TT0 is shown with linear scale to the right; normalized temporal profile for ΔE(t),ΔG(t),ΔM(t) are shown in linear scale to the right
Figure 3
Figure 3
Corona virus infection in human host: Virus counts of the same infection with and without AIR are shown in log scale to the left; target cells TT0 is shown with linear scale to the right; normalized temporal profile for ΔE(t),ΔG(t),ΔM(t) are shown in linear scale to the right
Figure 4
Figure 4
Effect of adaptive immuneresponse (AIR) activity on the viral infection: The AIR activity level varies from 0 to 1.0, while the peak of the AIR is fixed at 8 dpi
Figure 5
Figure 5
Effect of adaptive immuneresponse (AIR) peak day on viral dynamics: data shows the viral load over time when the day of AIR peak is changed from 6 to 14 days
Figure 6
Figure 6
Effect of Antiviral drug on viral dynamics: The drug is assumed to be 50% effective on k, and applied to a host with R0 of 7.03 for 15 days consecutively with various starting dates; viral counts to the left with exponential scale; target cell TT0 is shown for the scenario of the drug applied at 18 dpi, to the right with linear scale
Figure 7
Figure 7
Effect of antiviral drug on viral dynamics: the drug is assumed to be 90% effective on k, and is applied for 15 days consecutively with various starting dates; viral counts to the left with exponential scale; target cell TT0 is for drug started on 15 dpi only, shown with linear scale to the right
Figure 8
Figure 8
Effect of immunosuppressive drug on viral dynamics: The drug is assumed to be 50 or 90% effective so ϵδ=0.5 or 0.9; drug is applied from 1 dpi until 10 or 12 dpi (with the end day shown on legend); viral counts shown to the left with exponential scale; target cell TT0 is shown for 10 dpi for both 50% and 90% drugs, with linear scale to the right

References

    1. Huang C, Zhang L, Fan G, et al. Clinical features of patients infected with 2019 novel coronavirus in Wuhan. China Lancet. 2020;395(10223):497‐506. - PMC - PubMed
    1. Wang D, Hu B, Hu C, et al. Clinical Characteristics of 138 Hospitalized Patients With 2019 Novel Coronavirus‐Infected Pneumonia in Wuhan, China. JAMA. 2020;323(11):1061‐1069. - PMC - PubMed
    1. Chen N, Zhou M, Dong X, et al. Epidemiological and clinical characteristics of 99 cases of 2019 novel coronavirus pneumonia in Wuhan, China: a descriptive study. Lancet. 2020;395(10223):507‐513. - PMC - PubMed
    1. Zhou F, Yu T, Du R, et al. Clinical course and risk factors for mortality of adult inpatients with COVID‐19 in Wuhan, China: a retrospective cohort study. Lancet. 2020;395(10229):1054‐1062. - PMC - PubMed
    1. Beauchemin CA, Handel A. A review of mathematical models of influenza A infections within a host or cell culture: lessons learned and challenges ahead. BMC Public Health. 2011;1(11 Suppl):S7. - PMC - PubMed

Publication types

Substances