. 2020 Jun 1;143(6):1920-1933.
doi: 10.1093/brain/awaa137.

Development and validation of an interpretable deep learning framework for Alzheimer's disease classification

Affiliations

Development and validation of an interpretable deep learning framework for Alzheimer's disease classification

Shangran Qiu et al. Brain. .

Abstract

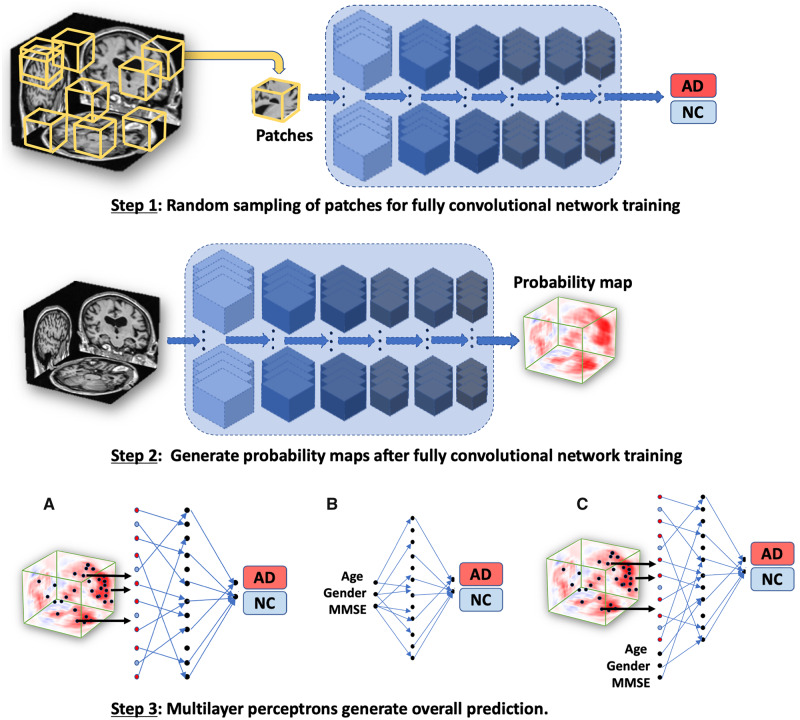
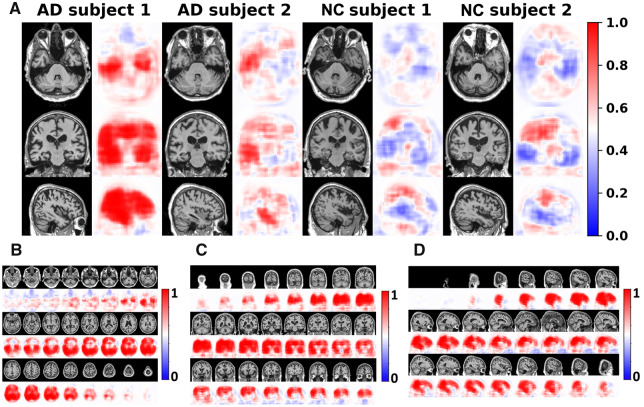
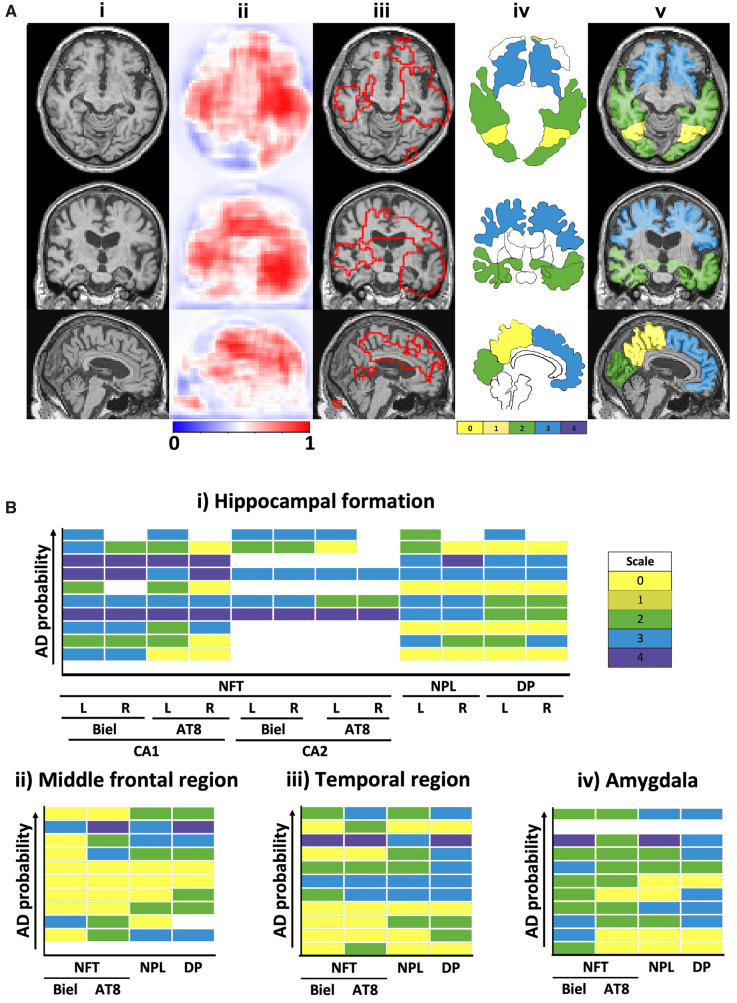
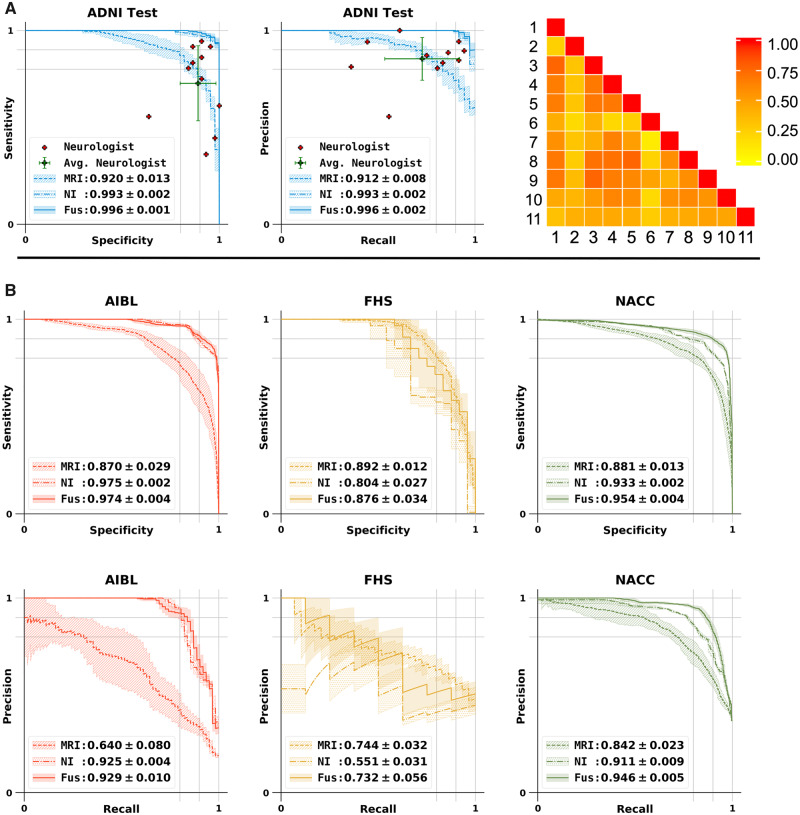
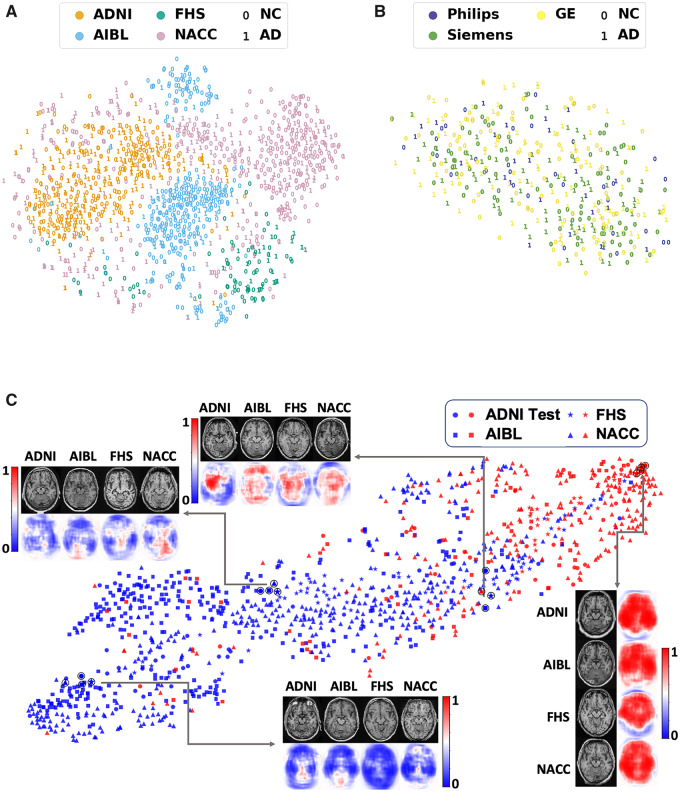
Alzheimer's disease is the primary cause of dementia worldwide, with an increasing morbidity burden that may outstrip diagnosis and management capacity as the population ages. Current methods integrate patient history, neuropsychological testing and MRI to identify likely cases, yet effective practices remain variably applied and lacking in sensitivity and specificity. Here we report an interpretable deep learning strategy that delineates unique Alzheimer's disease signatures from multimodal inputs of MRI, age, gender, and Mini-Mental State Examination score. Our framework linked a fully convolutional network, which constructs high resolution maps of disease probability from local brain structure to a multilayer perceptron and generates precise, intuitive visualization of individual Alzheimer's disease risk en route to accurate diagnosis. The model was trained using clinically diagnosed Alzheimer's disease and cognitively normal subjects from the Alzheimer's Disease Neuroimaging Initiative (ADNI) dataset (n = 417) and validated on three independent cohorts: the Australian Imaging, Biomarker and Lifestyle Flagship Study of Ageing (AIBL) (n = 382), the Framingham Heart Study (n = 102), and the National Alzheimer's Coordinating Center (NACC) (n = 582). Performance of the model that used the multimodal inputs was consistent across datasets, with mean area under curve values of 0.996, 0.974, 0.876 and 0.954 for the ADNI study, AIBL, Framingham Heart Study and NACC datasets, respectively. Moreover, our approach exceeded the diagnostic performance of a multi-institutional team of practicing neurologists (n = 11), and high-risk cerebral regions predicted by the model closely tracked post-mortem histopathological findings. This framework provides a clinically adaptable strategy for using routinely available imaging techniques such as MRI to generate nuanced neuroimaging signatures for Alzheimer's disease diagnosis, as well as a generalizable approach for linking deep learning to pathophysiological processes in human disease.

Keywords: Alzheimer’s disease; biomarkers; dementia; neurodegeneration; structural MRI.


Figures

Figure 1
Figure 1
Schematic of the deep learning framework. The FCN model was developed using a patch-based strategy in which randomly selected samples (sub-volumes of size 47 × 47 × 47 voxels) of T1-weighted full MRI volumes were passed to the model for training (Step 1). The corresponding Alzheimer’s disease status of the individual served as the output for the classification model. Given that the operation of FCNs is independent of input data size, the model led to the generation of participant-specific disease probability maps of the brain (Step 2). Selected voxels of high-risk from the disease probability maps were then passed to the MLP for binary classification of disease status (Model A in Step 3; MRI model). As a further control, we used only the non-imaging features including age, gender and MMSE and developed an MLP model to classify individuals with Alzheimer’s disease and the ones with normal cognition (Model B in Step 3; non-imaging model). We also developed another model that integrated multimodal input data including the selected voxels of high-risk disease probability maps alongside age, gender and MMSE score to perform binary classification of Alzheimer’s disease status (Model C in Step 3; Fusion model). AD = Alzheimer’s disease; NC = normal cognition.
Figure 2
Figure 2
Subject-specific disease probability maps. (A) Disease probability maps generated by the FCN model highlight high-risk brain regions that are associated with Alzheimer’s disease pathology. Individual cases are shown where the blue colour indicates low-risk and red indicates high-risk of Alzheimer’s disease. The first two individuals were clinically confirmed to have normal cognition whereas the other two individuals had clinical diagnosis of Alzheimer’s disease. (BD) Axial, coronal and sagittal stacks of disease probability maps from a single subject with clinically confirmed Alzheimer’s disease are shown. All imaging planes were used to construct 3D disease probability maps. Red colour indicates locally inferred probability of Alzheimer’s disease >0.5, whereas blue indicates <0.5. AD = Alzheimer’s disease; NC = normal cognition.
Figure 3
Figure 3
Summary of the FCN model performance. (A) Voxel-wise maps of Matthew’s correlation coefficient (MCC) were computed independently across all the datasets to demonstrate predictive performance derived from all regions within the brain. (BD) Axial, coronal and sagittal stacks of the MCC maps at each cross-section from a single subject, are shown. These maps were generated by averaging the MCC values on the ADNI test data.
Figure 4
Figure 4
Correlation of model findings with neuropathology. (A) Overlap of model predicted regions of high Alzheimer’s disease risk with post-mortem findings of Alzheimer’s disease pathology in a single subject. This subject had clinically confirmed Alzheimer’s disease with affected regions including the bilateral asymmetrical temporal lobes and the right-side hippocampus, the cingulate cortex, the corpus callosum, part of the parietal lobe and the frontal lobe. The first column (i) shows MRI slices in three different planes followed by a column (ii), which shows corresponding model predicted disease probability maps. A cut-off value of 0.7 was chosen to delineate the regions of high Alzheimer’s disease risk and overlapped with the MRI scan in the next column (iii). The next column (iv), depicts a segmented mask of cortical and subcortical structures of the brain obtained from FreeSurfer (Fischl, 2012). A sequential colour-coding scheme denotes different levels of pathology ranging from green (0, low) to pale red (4, high). The final column (v), shows the overlay of the magnetic resonance scan, disease probability maps of high Alzheimer’s disease risk and the colour-coded regions based on pathology grade. (B) We then qualitatively assessed trends of neuropathological findings from the FHS dataset (n = 11). The same colour-coding scheme as described above was used to represent the pathology grade (0–4) in the heat maps. The boxes coloured in ‘white’ in the heat maps indicate missing data. Using the Spearman’s Rank correlation coefficient test, an increasing Alzheimer’s disease probability risk was associated with a higher grade of amyloid-β and tau accumulation, in the hippocampal formation, the middle frontal region, the amygdala and the temporal region, respectively. Biel = Bielschowsky stain; L = left; R = right.
Figure 5
Figure 5
Performance of the MLP model for Alzheimer’s disease classification and model comparison with neurologists. (A) Sensitivity-specificity and precision-recall curves showing the sensitivity, the true positive rate, versus specificity, the true negative rate, calculated on the ADNI test set. Individual neurologist performance is indicated by the red plus symbol and averaged neurologist performance along with the error bars is indicated by the green plus symbol on both the sensitivity-specificity and precision-recall curves on the ADNI test data. Visual description of pairwise Cohen’s kappa (κ), which denotes the inter-operator agreement between all the 11 neurologists is also shown. (B) Sensitivity-specificity and PR curves calculated on the AIBL, FHS and NACC datasets, respectively. For all cases, model A indicates the performance of the MLP model that used MRI data as the sole input, model B is the MLP model with non-imaging features as input and model C indicates the MLP model that used MRI data along with age, gender and MMSE values as the inputs for binary classification.
Figure 6
Figure 6
Visualization of data. (A) Voxel-level MRI intensity values from all four datasets (ADNI, AIBL, FHS and NACC) were used as inputs and a two-dimensional plot was generated using t-SNE, a method for visualizing high-dimensional data. The colour in the plot represents the site and the digit ‘0’ was used to present cases who had normal cognition (NC) and the digit ‘1’ was used to show cases who had confirmed Alzheimer’s disease (AD). (B) This t-SNE plot was generated only on using the ADNI dataset, where the colour was used to represent the scanner. The digit ‘0’ was used for normal cognition cases and ‘1’ for Alzheimer’s disease cases. (C) FCN-based outputs that served as input features to the MLP model were embedded in a two-dimensional plot generated using t-SNE for the two classes (Alzheimer’s disease and normal cognition). The colour (blue versus red) was used to distinguish normal cognition from Alzheimer’s disease cases, whereas a unique symbol shape was used to represent individuals derived from the same cohort. Several individual cases that were clinically confirmed to have Alzheimer’s disease or normal cognition are also shown (indicated as a black circle overlying the respective datapoint). The plot also indicates co-localization of subjects in the feature space based on the disease state and not on the dataset of origin.

References

    1. Au R, Seshadri S, Knox K, Beiser A, Himali JJ, Cabral HJ, et al.The Framingham Brain Donation Program: neuropathology along the cognitive continuum. Curr Alzheimer Res 2012; 9: 673–86. - PMC - PubMed
    1. Barkhof F, Polvikoski TM, van Straaten EC, Kalaria RN, Sulkava R, Aronen HJ, et al.The significance of medial temporal lobe atrophy: a postmortem MRI study in the very old. Neurology 2007; 69: 1521–7. - PubMed
    1. Beach TG, Monsell SE, Phillips LE, Kukull W.. Accuracy of the clinical diagnosis of Alzheimer disease at National Institute on Aging Alzheimer Disease Centers, 2005-2010. J Neuropathol Exp Neurol 2012; 71: 266–73. - PMC - PubMed
    1. Beekly DL, Ramos EM, van Belle G, Deitrich W, Clark AD, Jacka ME, et al.The National Alzheimer’s Coordinating Center (NACC) Database: an Alzheimer disease database. Alzheimer Dis Assoc Disord 2004; 18: 270–7. - PubMed
    1. Bohnen NI, Djang DS, Herholz K, Anzai Y, Minoshima S.. Effectiveness and safety of 18F-FDG PET in the evaluation of dementia: a review of the recent literature. J Nucl Med 2012; 53: 59–71. - PubMed

Publication types