. 2020 Aug;23(8):1201-1211.
doi: 10.1111/ele.13518. Epub 2020 May 1.

Disease hotspots or hot species? Infection dynamics in multi-host metacommunities controlled by species identity, not source location

Affiliations

Disease hotspots or hot species? Infection dynamics in multi-host metacommunities controlled by species identity, not source location

Mark Q Wilber et al. Ecol Lett. 2020 Aug.

Abstract

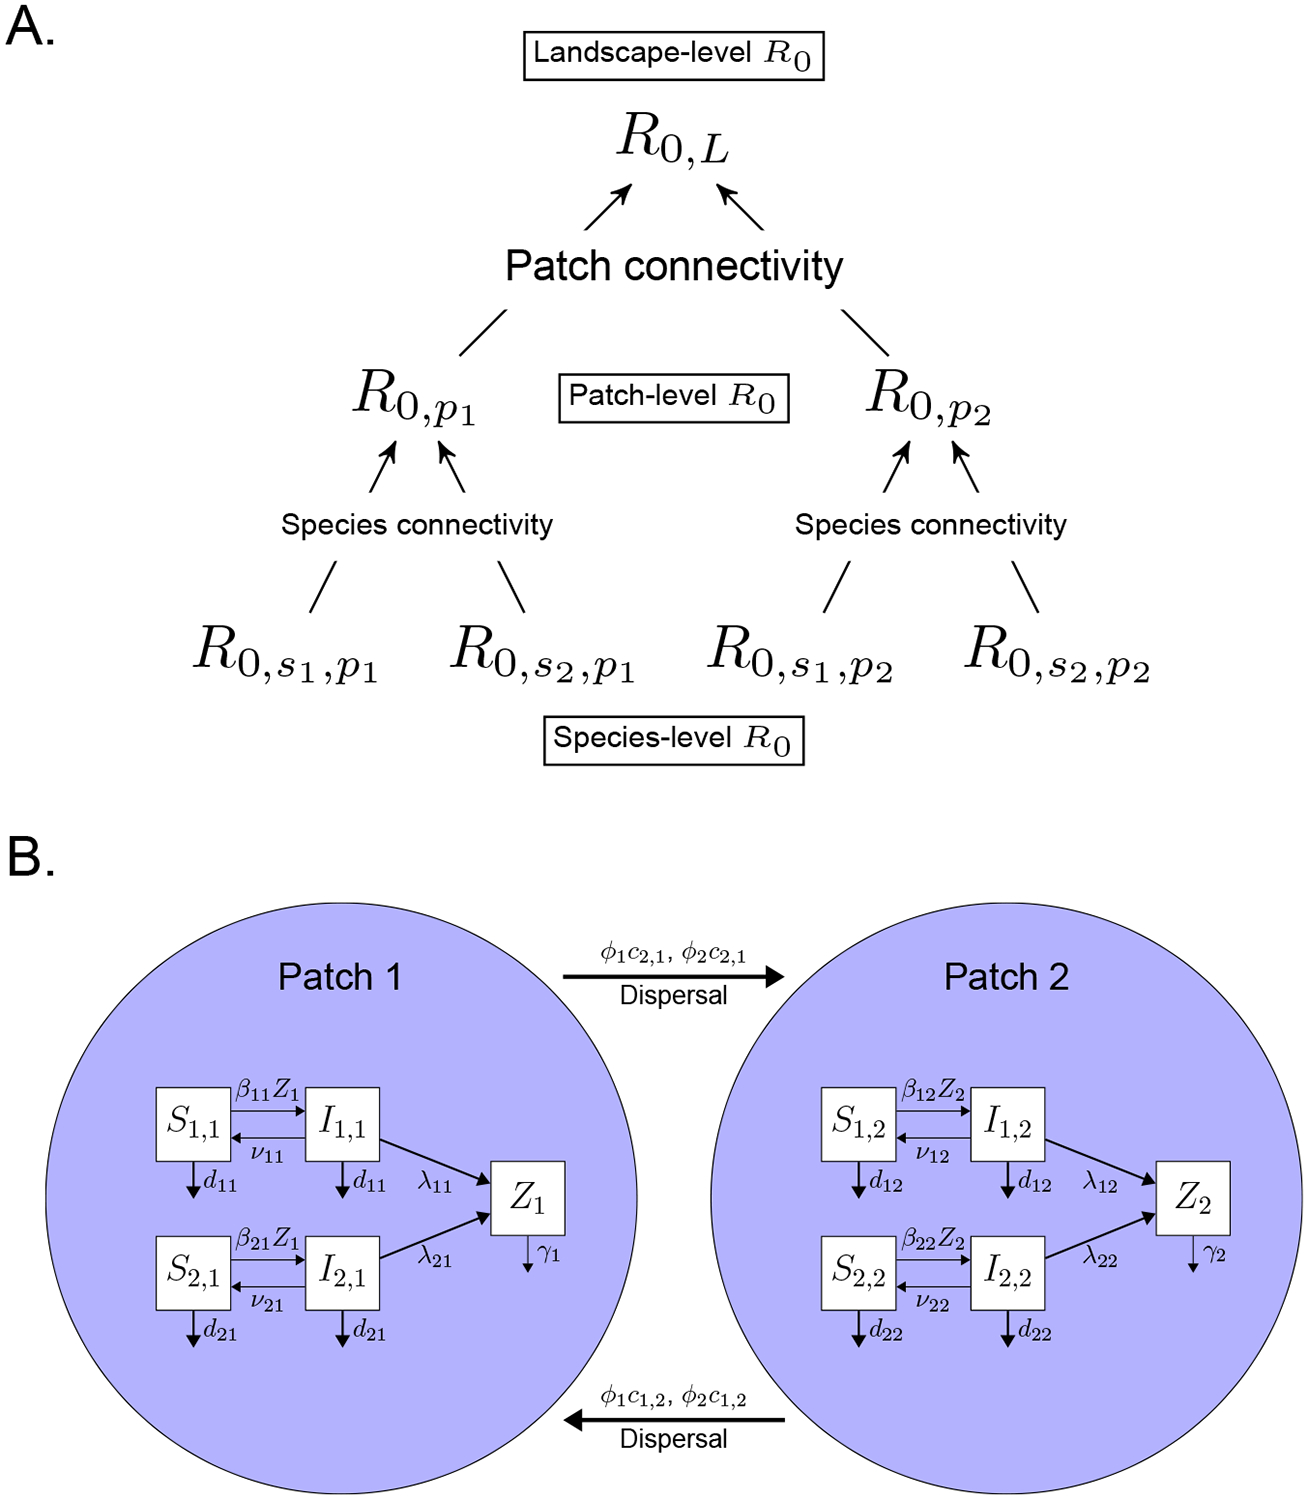
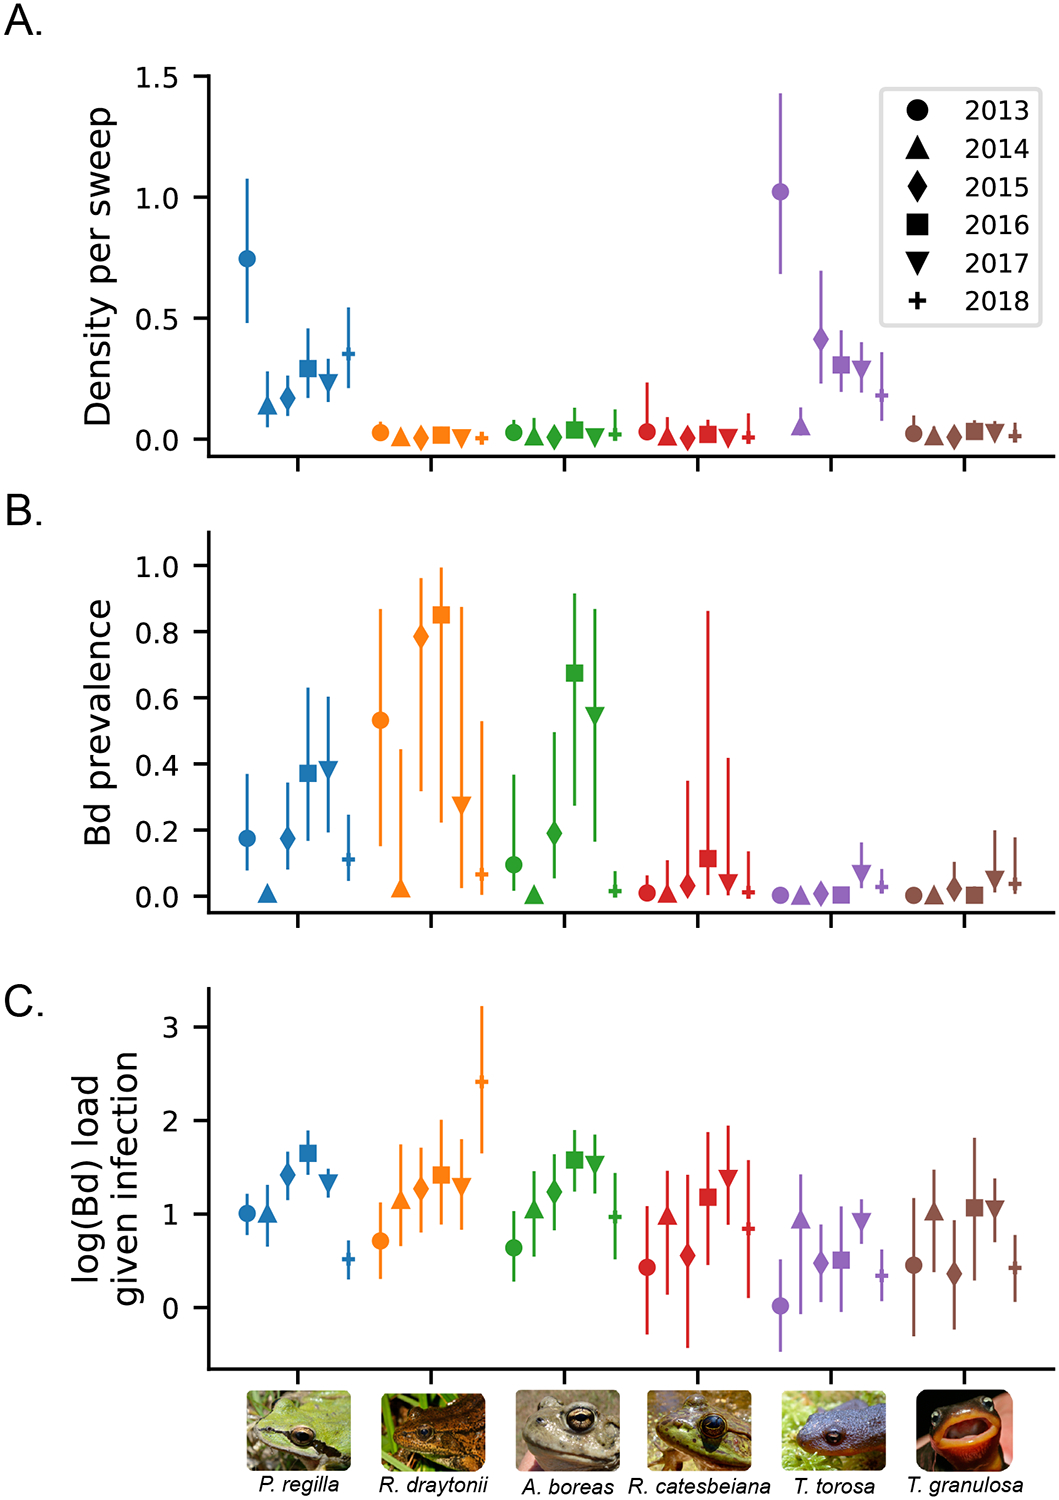
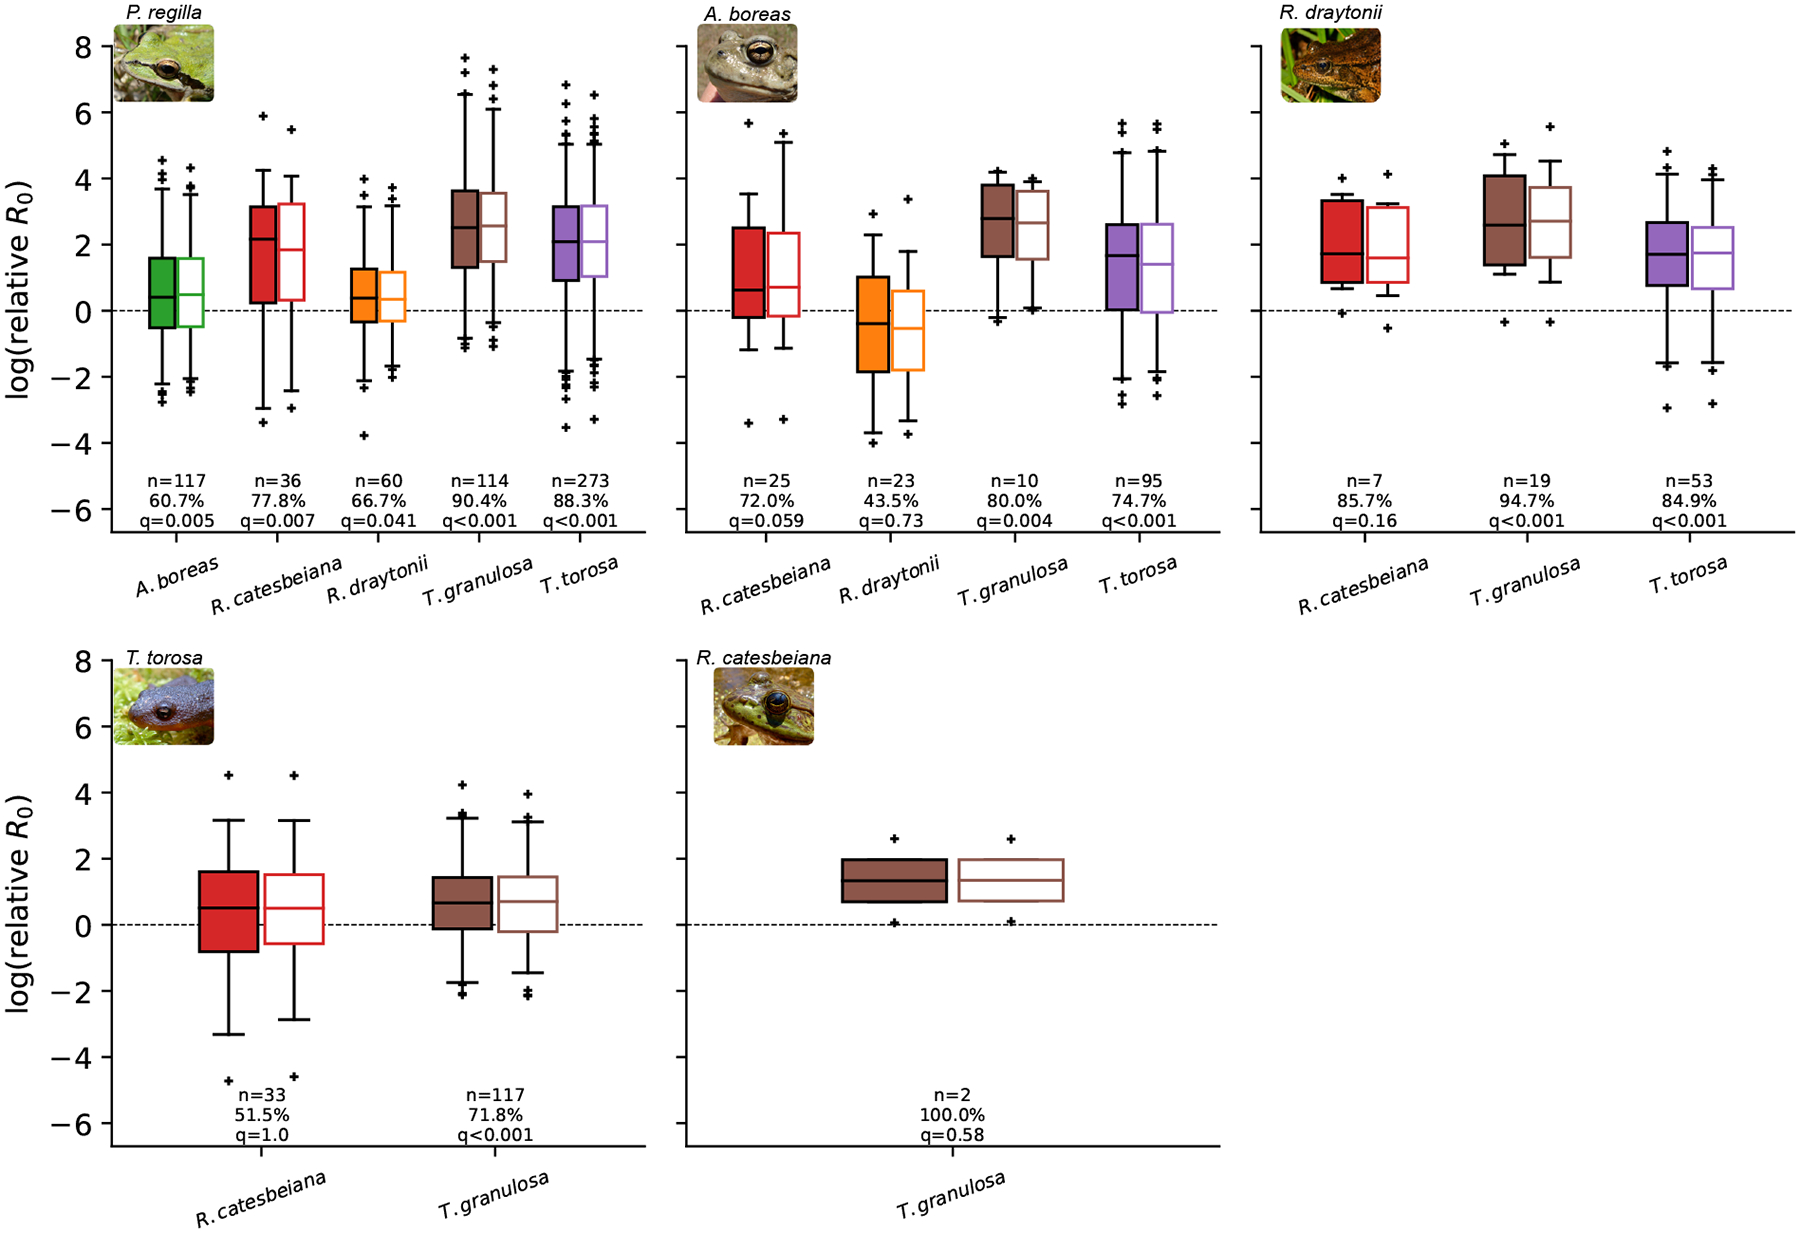
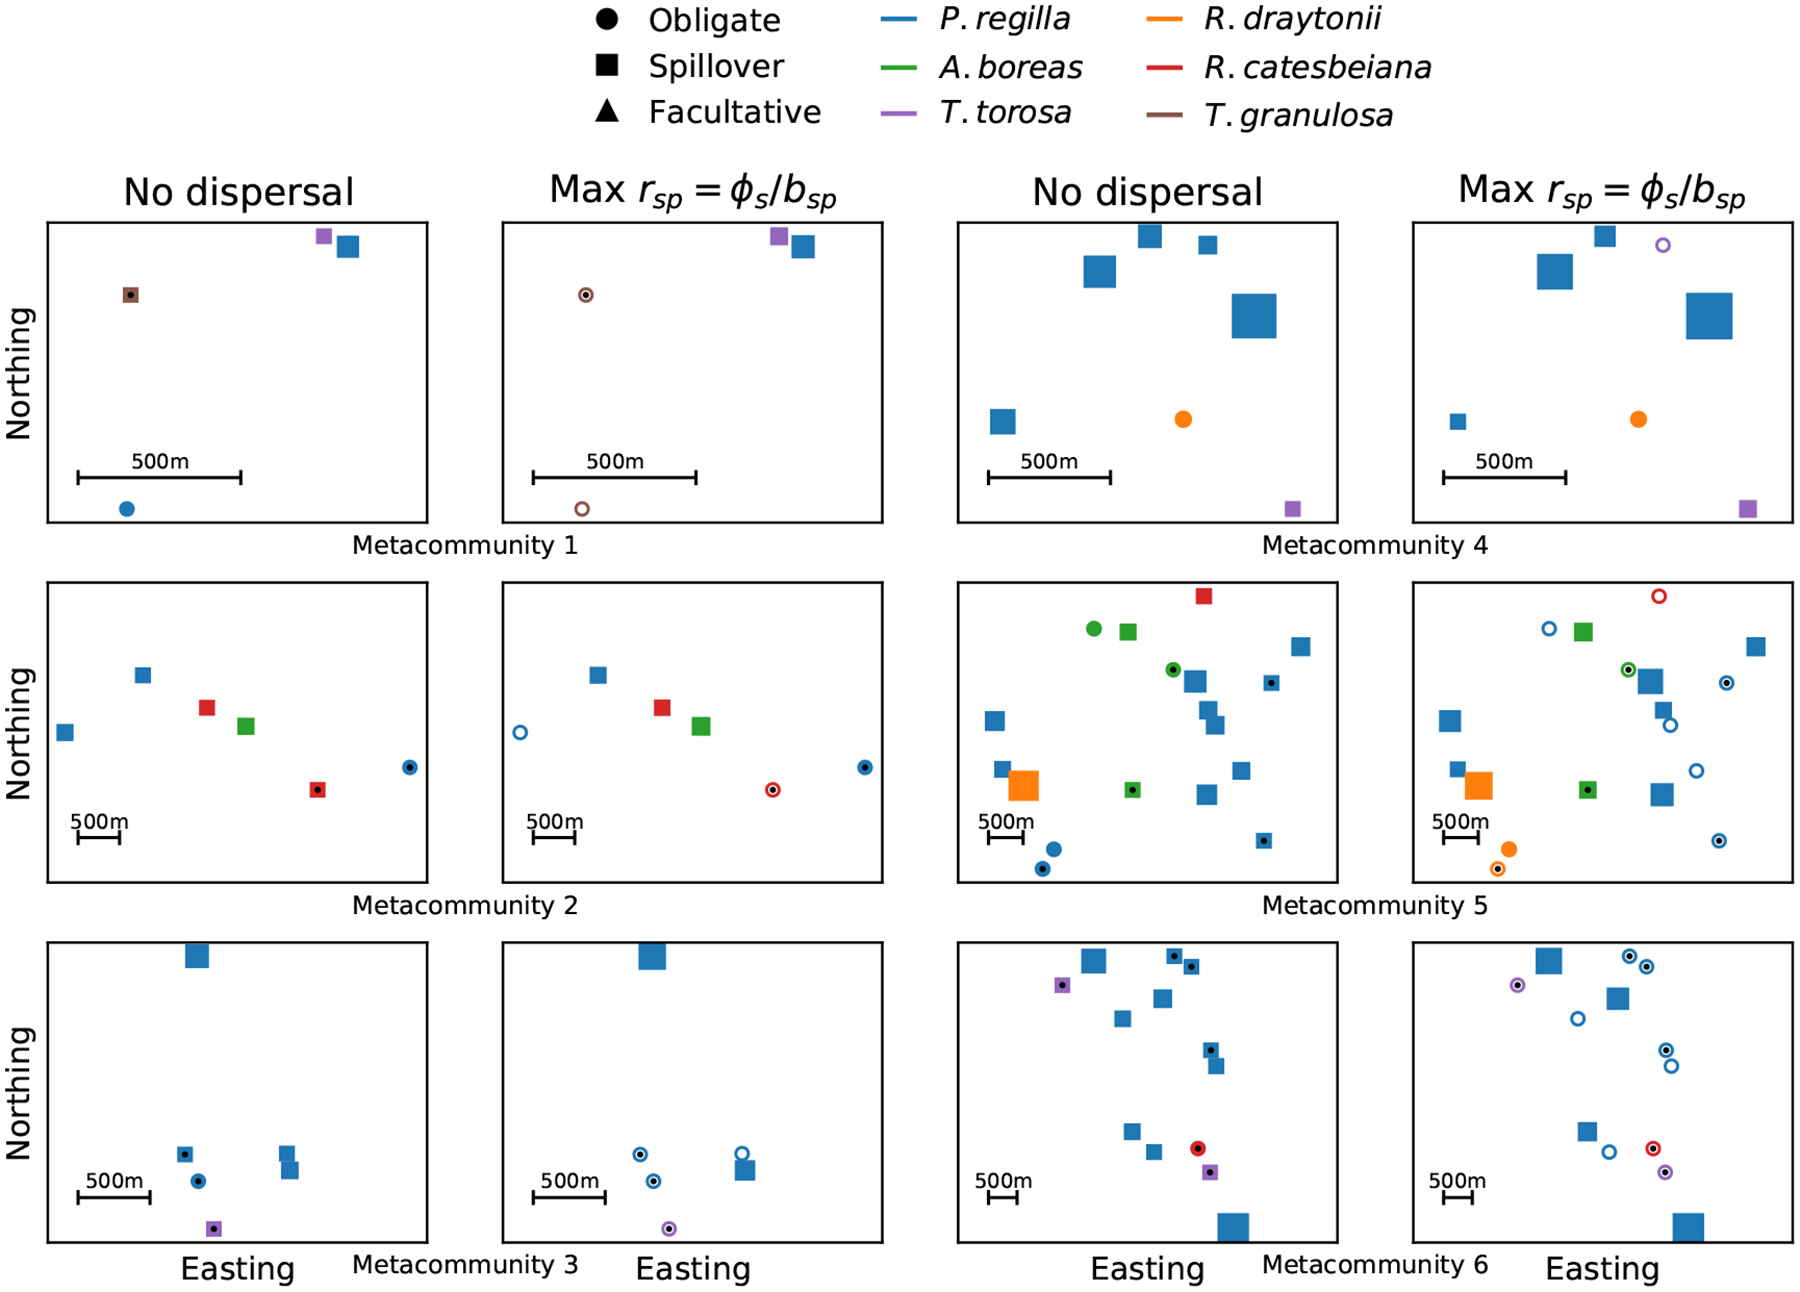
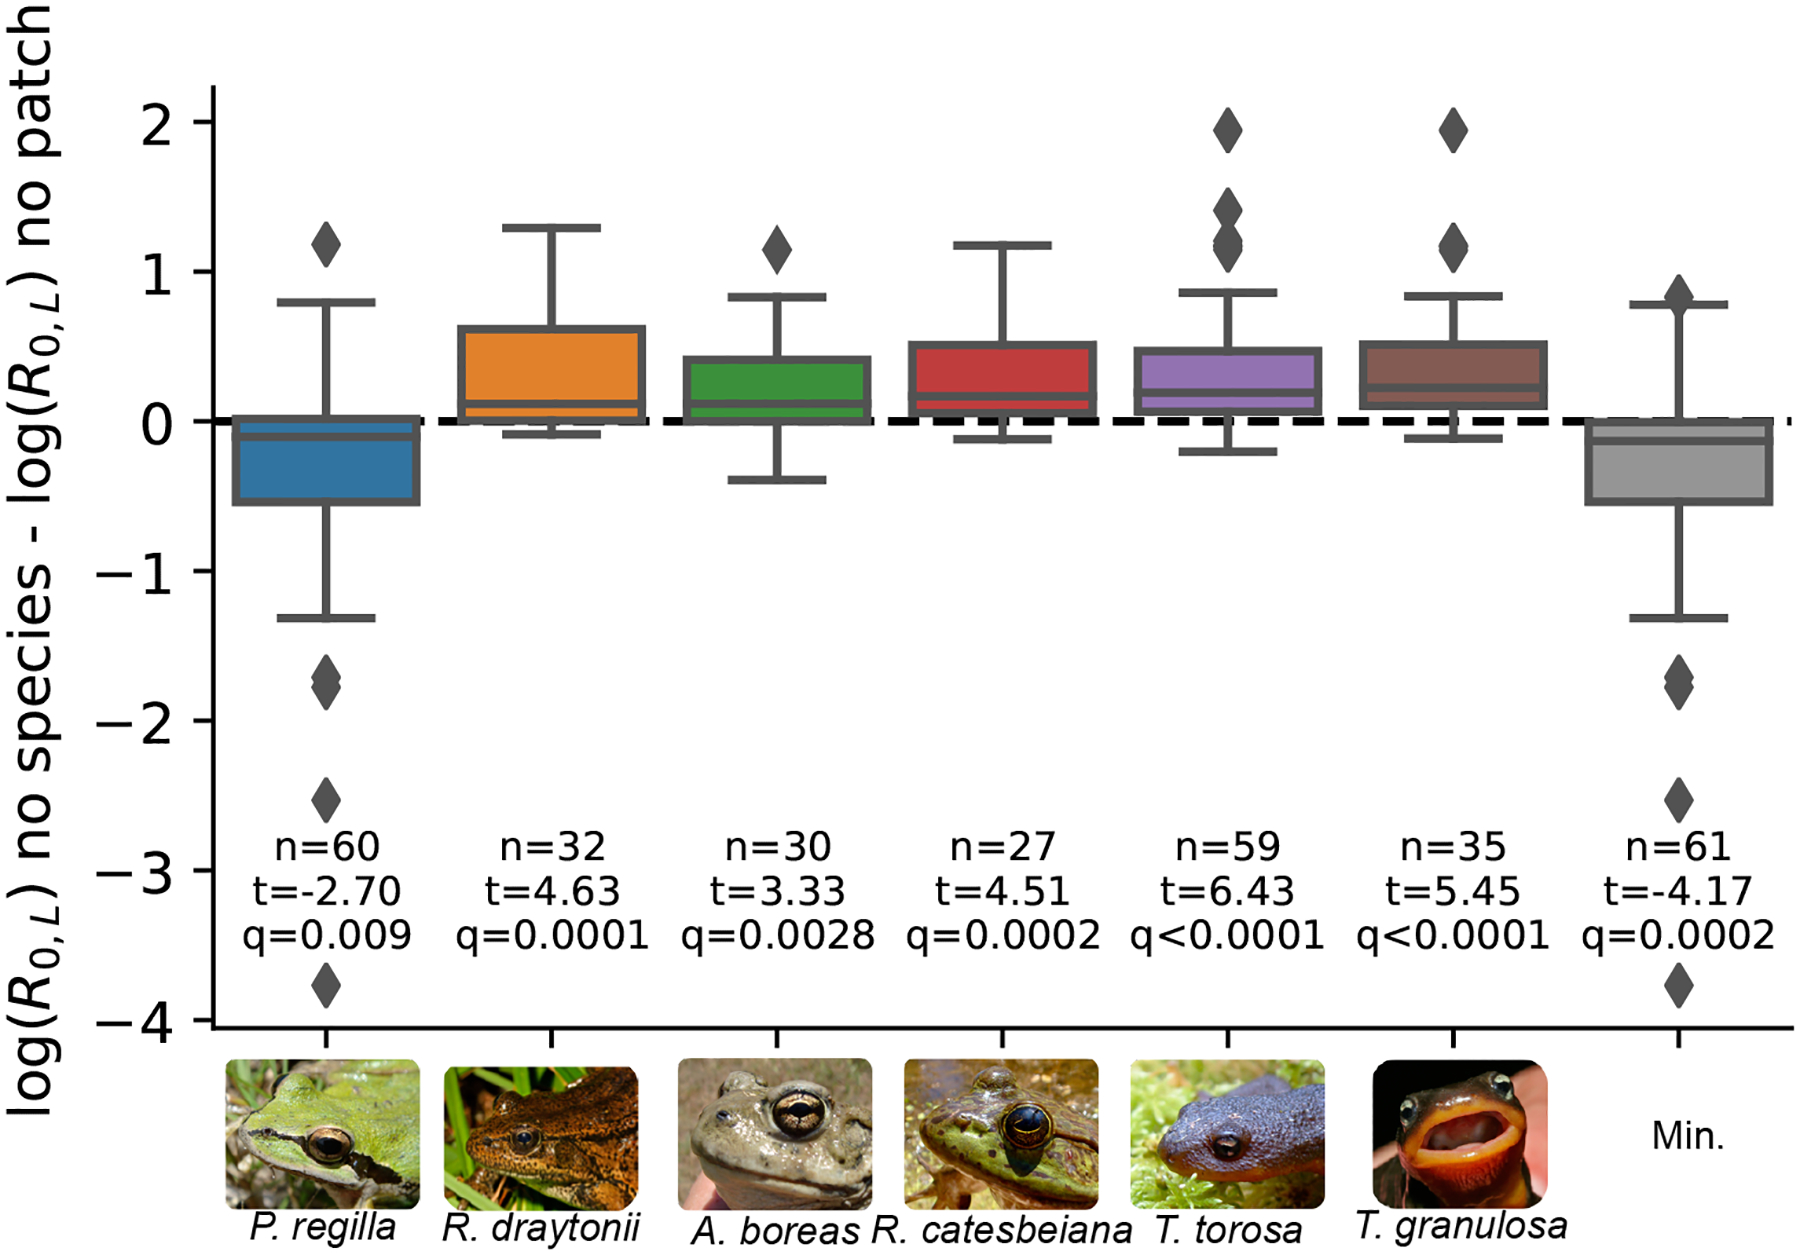
Pathogen persistence in host communities is influenced by processes operating at the individual host to landscape-level scale, but isolating the relative contributions of these processes is challenging. We developed theory to partition the influence of host species, habitat patches and landscape connectivity on pathogen persistence within metacommunities of hosts and pathogens. We used this framework to quantify the contributions of host species composition and habitat patch identity on the persistence of an amphibian pathogen across the landscape. By sampling over 11 000 hosts of six amphibian species, we found that a single host species could maintain the pathogen in 91% of observed metacommunities. Moreover, this dominant maintenance species contributed, on average, twice as much to landscape-level pathogen persistence compared to the most influential source patch in a metacommunity. Our analysis demonstrates substantial inequality in how species and patches contribute to pathogen persistence, with important implications for targeted disease management.

Keywords: Batrachochytrium dendrobatidis; Pseudacris regilla; chytrid fungus; endemic; hotspots; maintenance species; metacommunity; metapopulaton; reservoir species; source-sink dynamics.


Figures

Figure 1:
Figure 1:. A.
The partitioning of a multi-species, multi-patch system into species-level R0,s,p, patch-level R0,p, landscape-level R0,L, species connectivity (e.g. the off-diagonals of a Who-Acquired-Infection-From-Whom matrix, Dobson 2004), and patch connectivity. In this example, there are two species and two patches on the landscape. B. The multi-species, multi-patch pathogen model used to partition the importance of maintenance species and source patches on pathogen persistence in a metacommunity (equation 1). The diagram uses two species and two patches as an example.
Figure 2:
Figure 2:. A.
Median estimated amphibian density per dip net sweep after accounting for false absences across six years, 139 patches and six amphibian species. B. Median estimated prevalence after accounting for false absences. C. Median estimated mean log(Bd) load conditional on infection after accounting for measurement error. For all figures, the error bars are 95% credible intervals about the estimated median. Different shapes represent different years. The species on the x-axis are Pacific tree frog (P. regilla), western toad (A. boreas), American bullfrog (R. catesbeiana), California red-legged frog (R. draytonii), California newt (T. torosa), and rough-skinned newt (T. granulosa).
Figure 3:
Figure 3:
Relative species-level R0,s,p values within a patch calculated using equation 2 with no connectivity (filled boxplots) and using the median R0,s,p from the plausible set of dispersal rate to loss of infected rate ratios rsp (unfilled boxplots). As an example of the labeling, the “A. boreas” x-label of the plot titled “P. regilla” shows the distribution of the ratios of P. regilla R0,s,p values to A. boreas R0,s,p values for patches where P. regilla and A. boreas were both present. A value larger than zero indicates that the relative maintenance potential of P. regilla is greater than A. boreas for that comparison. ‘n’ gives the number of patches where both species were found, ‘%’ gives the percent of comparisons where relative log R0,s,p values were greater than zero, and ‘q’ gives the p-value corrected for false discovery rate (Benjamini & Hochberg 1995) from a binomial test with the null hypothesis that species are equally likely to have a higher species-level R0,s,p within a patch. The bars give the median relative R0,s,p values, the boxes given the upper and lower quartiles, the whiskers give the 2.5 and 97.5 percentiles, and “+”s show points outside of these percentiles.
Figure 4:
Figure 4:
Six representative metacommunities given no dispersal and maximum plausible connectivity for each species in a metacommunity (Max rsp = ϕs/bs). Each point represents the spatial location of a patch within the metacommunity using a UTM projection. The color of the point indicates which amphibian has the highest species-level R0,s,p in the patch. If the point is filled, the patch-level R0,p is greater than 1 and the patch is a source patch. If the point is not filled, the patch-level R0,p is less than 1 and the patch is a sink. The shape of the point indicates what type of community is found in the patch. Circle = an obligate community where R0,s,p<1 for all species, Square = A spillover community where R0,s,p>1 for only one species, and Triangle = a facultative community where R0,s,p>1 for more than one species. The size of the point represents a scaled measure of patch-level R0,p when patch-level R0,p>1. Finally, points with small black dots indicate patches where Bd was not observed for any species. Our statistical model for Bd load accounted for detection error, such that there was some probability that Bd was present, but at low prevalence in these patches. We used the model-predicted prevalence given detection error when making inference for these patches (Appendix S3).
Figure 5:
Figure 5:
The effect of removing a species on landscape-level R0,L compared to removing the most influential source patch for 61 metacommunities with at least two patches and two species. Negative values indicate a larger reduction in landscape-level R0,L when a species is removed compared to when the most influential source patch is removed from the metacommunity. The sample sizes give the number of metacommunities out of 61 where a species was present. The t-statistics are from single sample t-tests testing the null hypothesis that the ratio log(R0,Lno speciesR0,Lno patch) is significantly different than zero. The q value is the significance value of the single sample t-test, after adjusting for multiple comparisons using the false discovery rate correction (Benjamini & Hochberg 1995). The gray boxplot “Min.” shows the minimum ratio log(R0,Lno speciesR0,Lno patch) across all species within a metacommunity. The dashed line indicates where removing a species and removing the most influential source patch had the same effect on landscape-level R0,L.

References

    1. Adams AJ, Kupferberg SJ, Wilber MQ, Pessier AP, Grefsrud M, Bobzien S, Vredenburg VT & Briggs CJ (2017). Extreme drought, host density, sex, and bullfrogs influence fungal pathogen infection in a declining lotic amphibian. Ecosphere, 8, e01740.
    1. Arino J (2009). Diseases in metapopulations. In: Modeling the Dynamics of Infectious Disease, Series in Contemporary Applied Mathematics (eds. Ma Z, Zhou Y & Wu J). World Scientific, Singapore, pp. 64–122.
    1. Arino J, Davis JR, Hartley D, Jordan R, Miller JM & van den Driessche P (2005). A multi-species epidemic model with spatial dynamics. Math Med Biol, 22, 129–142. - PubMed
    1. Bansal S, Grenfell BT & Meyers LA (2007). When individual behaviour matters: Homogeneous and network models in epidemiology. J R Soc Interface, 4, 879–891. - PMC - PubMed
    1. Benjamini Y & Hochberg Y (1995). Controlling the False Discovery Rate: A practical and powerful approach to multiple testing. J Roy Stat Soc B Met, 57, 289–300.

LinkOut - more resources