. 2020 Apr 26;9(5):1078.
doi: 10.3390/cells9051078.

Characterization of Endoplasmic Reticulum (ER) in Human Pluripotent Stem Cells Revealed Increased Susceptibility to Cell Death upon ER Stress

Affiliations

Characterization of Endoplasmic Reticulum (ER) in Human Pluripotent Stem Cells Revealed Increased Susceptibility to Cell Death upon ER Stress

Tae Won Ha et al. Cells. .

Abstract

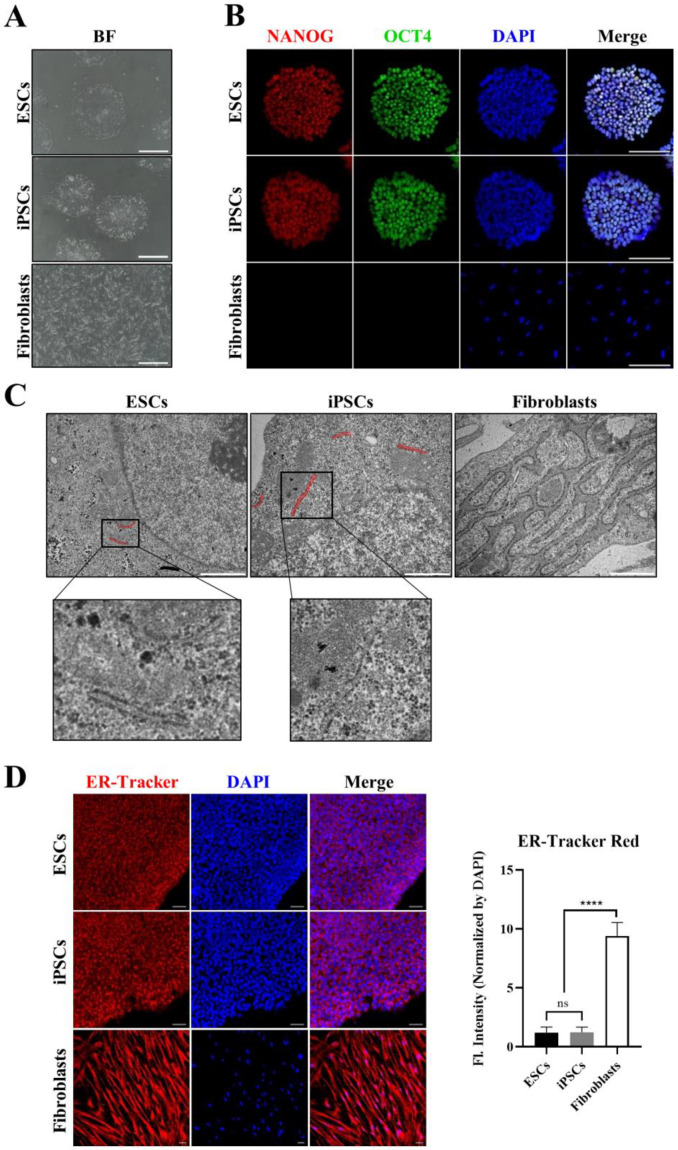
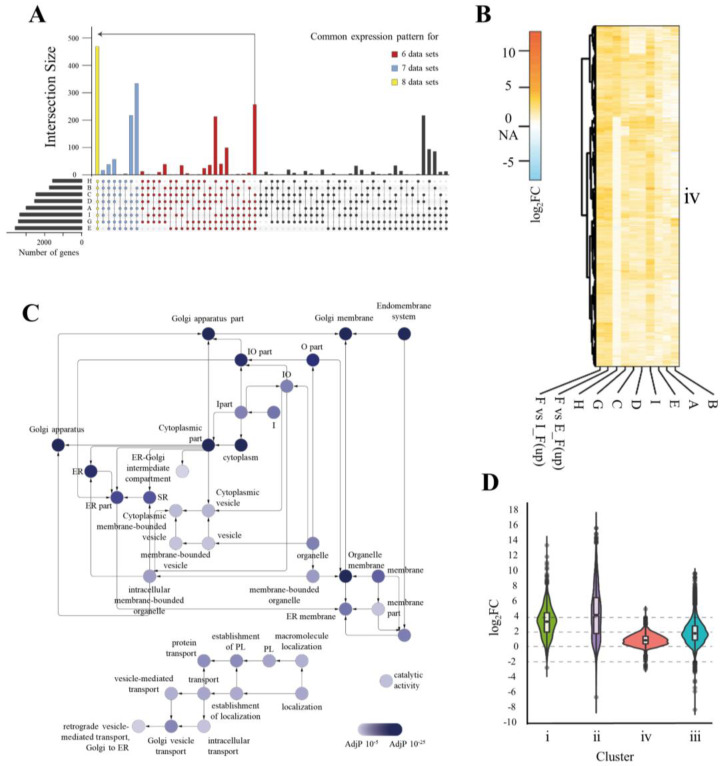
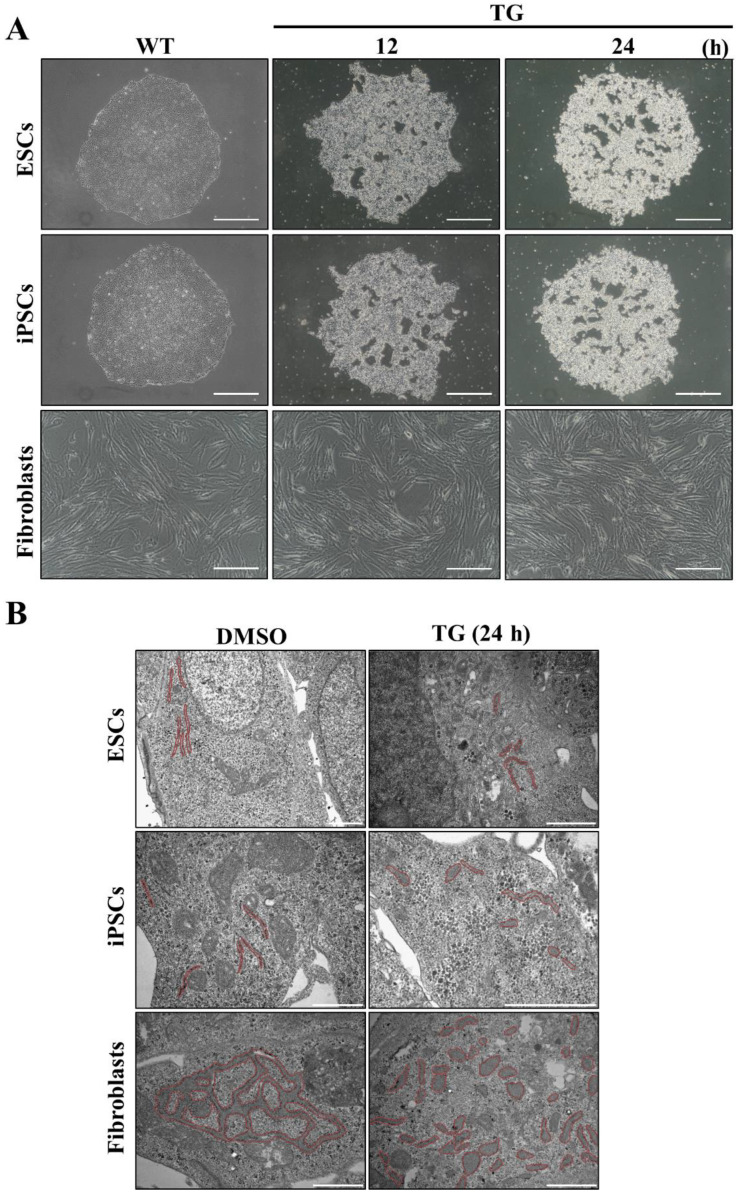
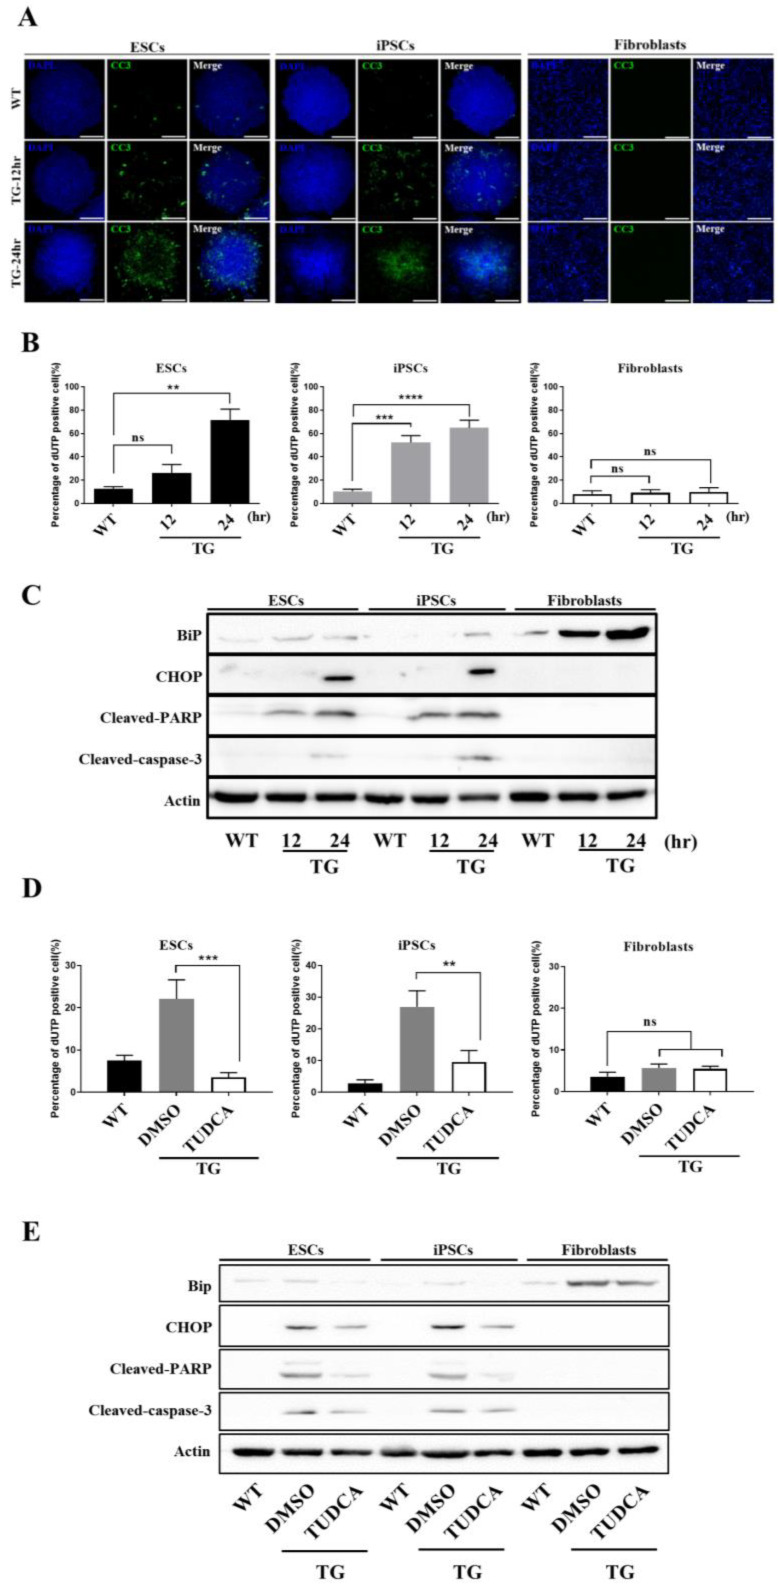
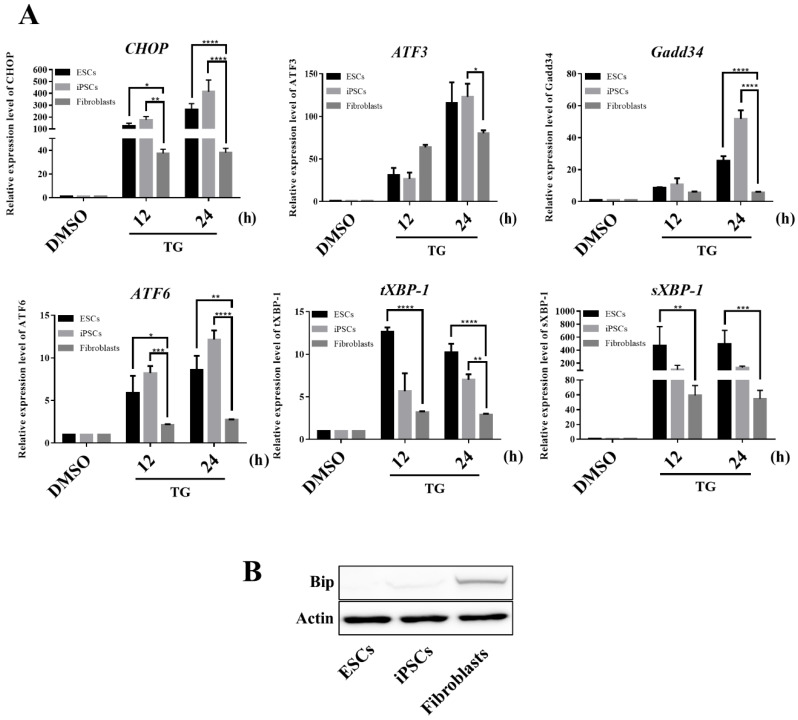
Human pluripotent stem cells (hPSCs), such as embryonic stem cells (ESCs) and induced pluripotent stem cells (iPSCs), have a well-orchestrated program for differentiation and self-renewal. However, the structural features of unique proteostatic-maintaining mechanisms in hPSCs and their features, distinct from those of differentiated cells, in response to cellular stress remain unclear. We evaluated and compared the morphological features and stress response of hPSCs and fibroblasts. Compared to fibroblasts, electron microscopy showed simpler/fewer structures with fewer networks in the endoplasmic reticulum (ER) of hPSCs, as well as lower expression of ER-related genes according to meta-analysis. As hPSCs contain low levels of binding immunoglobulin protein (BiP), an ER chaperone, thapsigargin treatment sharply increased the gene expression of the unfolded protein response. Thus, hPSCs with decreased chaperone function reacted sensitively to ER stress and entered apoptosis faster than fibroblasts. Such ER stress-induced apoptotic processes were abolished by tauroursodeoxycholic acid, an ER-stress reliever. Hence, our results revealed that as PSCs have an underdeveloped structure and express fewer BiP chaperone proteins than somatic cells, they are more susceptible to ER stress-induced apoptosis in response to stress.

Keywords: C/EBP homologous protein (CHOP); ER stress; binding immunoglobulin protein (BiP); endoplasmic reticulum (ER); human pluripotent stem cells; proteostasis.


Conflict of interest statement

The authors declare no conflicts of interest.

Figures

Figure 1
Figure 1
Morphological differences of the endoplasmic reticulum (ER) in human pluripotent stem cells (hPSCs) and fibroblasts. (A) Bright field (BF) image showing cultured cells before harvesting for transmission electron microscopy (TEM) analysis. Scale bar: 200 μm (B) Immunostaining showing the expression of NANOG (red fluorescence) and octamer-binding transcription factor 4 (OCT4 as known POU5F1) (green fluorescence) in hPSCs. Scale bar: 150 μm (C) TEM images showing the ER structure of each sample. Red bar indicates the ER in hPSCs. The small images show enlarged ER. Scale bar: 1 μm. (D) Confocal microscopy images showing the ER tracker signal that binds to ER. Fluorescence intensity graph indicate that 4′,6-diamidino-2-phenylindole (DAPI) normalized ER tracker signal. Scale bar: 50 μm. Values represent the mean ± SD. Tukey’s t test: **** p < 0.00001; “ns” represents non-significant differences.
Figure 2
Figure 2
Gene expression analysis of hPSCs and fibroblasts. (A) UpsetR plot showing downregulated genes in hPSCs in eight datasets. The left bar graph shows the number of genes used in the intersection for each dataset. The color-filled plots show the number of commonly downregulated genes. Genes commonly downregulated in six, seven, and eight datasets are colored with red, light blue and yellow, respectively. The GEO data used are abbreviated as follows; A: GSE54186, ESC (H1) vs differentiated fibroblasts; B: GSE54186, ESC (H9) vs differentiated fibroblasts; C: GSE33298, ESC vs fibroblasts; D: GSE33298, induced pluripotent stem cells (iPSC) vs fibroblasts; E: IPSC vs fibroblasts; G: GSE24487, IPSC vs fibroblasts; H: GSE24487, ESC vs fibroblasts; I: GSE20750, IPSC vs fibroblasts; (B) Heat-map showing the log2FC-fold change value for the four generated clusters. The orange color key indicates the fold-changes of downregulated genes in hPSCs and blue color indicates the fold-changes of upregulated genes in fibroblasts. (C) Gene ontology (GO) network of cluster iii that satisfies a cutoff of FDR < 0.00001 for hypergeometric test with FDR correction using BiNGO which is a Java-based tool to determine GO. The darker blue-colored mapping indicates stronger enrichment. Abbreviations: endoplasmic reticulum: ER; intracellular: I; organelle: O; sub-synaptic reticulum: SR; protein localization: PL. (D) Violin plot showing the fold change pattern distribution of each cluster generated from the heat-map.
Figure 3
Figure 3
Unfolded protein response (UPR) induction under ER stress caused by thapsigargin (TG) treatment. (A) Morphological changes in the cell population in response to ER stress observed using an optical microscope. (WT, TG treatment for 12 or 24 h). Scale bar: 200 μm (B) Morphological changes in the ER structure under dimethyl sulfoxide (DMSO) or TG treatment conditions; Red line indicates the ER structure in hPSCs. Scale bar: 1 μm.
Figure 4
Figure 4
hPSCs are more susceptible to apoptosis. (A) Immunostaining data show cleaved caspase-3 expression by GFP fluorescence. GFP was only visible in hPSCs. Scale bar: 300 μm (B) Percentage of apoptosis as indicated by bromodeoxyuridine (BrdU) staining using fluorescence-activated cell sorting (FACS). Values represent the mean ± SD. Tukey’s t-test: ** p < 0.01; *** p < 0.001; **** p < 0.00001; “ns” represents non-significant differences. (C) Expression levels of BiP, C/EBP homologous protein (CHOP), cleaved-poly (ADP-ribose) polymerase (PARP), cleaved-caspase 3, and actin in hESCs, iPSCs, and fibroblasts treated with TG were assessed by western blotting using specific antibodies (n = 3). (D) Percentage of apoptotic treated and untreated cell lines measured by BrdU staining. Values represent the mean ± SD. Tukey t-test: ** p < 0.01 or ** p < 0.001. (E) Expression levels of BiP, CHOP, cleaved-PARP, cleaved-caspase3, and actin in hESCs, iPSCs, and fibroblasts treated with TG for 12 h and then DMSO and tauroursodeoxycholic acid (TUDCA) for 12 h were assessed by Western blotting.
Figure 5
Figure 5
UPR induction is more significantly activated in hPSCs. (A) Expression levels of ER stress-associated genes in hESCs, hiPSCs, and fibroblasts during the 12- and the 24-h TG treatments. Values represent the mean ± SD. Tukey’s t-test: * p < 0.05; ** p < 0.01; *** p < 0.001; or **** p < 0.00001. (B) Expression levels of BiP and actin in ESCs, iPSCs, and fibroblasts were assessed by western blotting using specific antibodies (n = 3).

References

    1. Thomson J.A., Itskovitz-Eldor J., Shapiro S.S., Waknitz M.A., Swiergiel J.J., Marshall V.S., Jones J.M. Embryonic stem cell lines derived from human blastocysts. Science (N. Y. NY) 1998;282:1145–1147. doi: 10.1126/science.282.5391.1145. - DOI - PubMed
    1. Vazin T., Freed W.J. Human embryonic stem cells: Derivation, culture, and differentiation: A review. Restor. Neurol. Neurosci. 2010;28:589–603. doi: 10.3233/RNN-2010-0543. - DOI - PMC - PubMed
    1. Takahashi K. Induction of pluripotent stem cells from adult human fibroblasts by defined factors. Cell. 2007;131 doi: 10.1016/j.cell.2007.11.019. - DOI - PubMed
    1. Araki R., Uda M., Hoki Y., Sunayama M., Nakamura M., Ando S., Sugiura M., Ideno H., Shimada A., Nifuji A., et al. Negligible immunogenicity of terminally differentiated cells derived from induced pluripotent or embryonic stem cells. Nature. 2013;494:100–104. doi: 10.1038/nature11807. - DOI - PubMed
    1. Martin U. Therapeutic Application of Pluripotent Stem Cells: Challenges and Risks. Front. Med. 2017;4:229. doi: 10.3389/fmed.2017.00229. - DOI - PMC - PubMed

Publication types

MeSH terms

Substances