. 2020 Apr 26;9(5):1081.
doi: 10.3390/cells9051081.

In Vitro Cytotoxicity Effects of Zinc Oxide Nanoparticles on Spermatogonia Cells

Affiliations

In Vitro Cytotoxicity Effects of Zinc Oxide Nanoparticles on Spermatogonia Cells

Ana Rita Pinho et al. Cells. .

Abstract

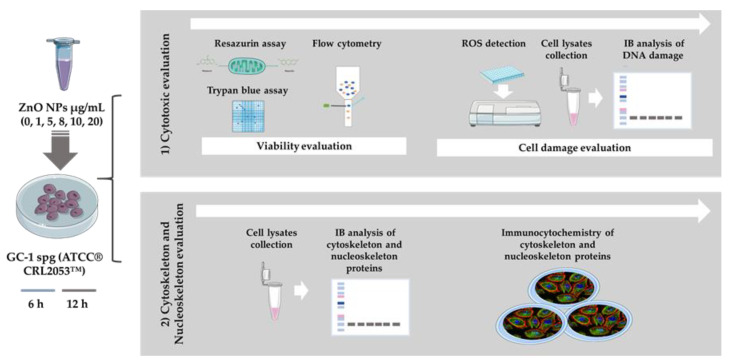
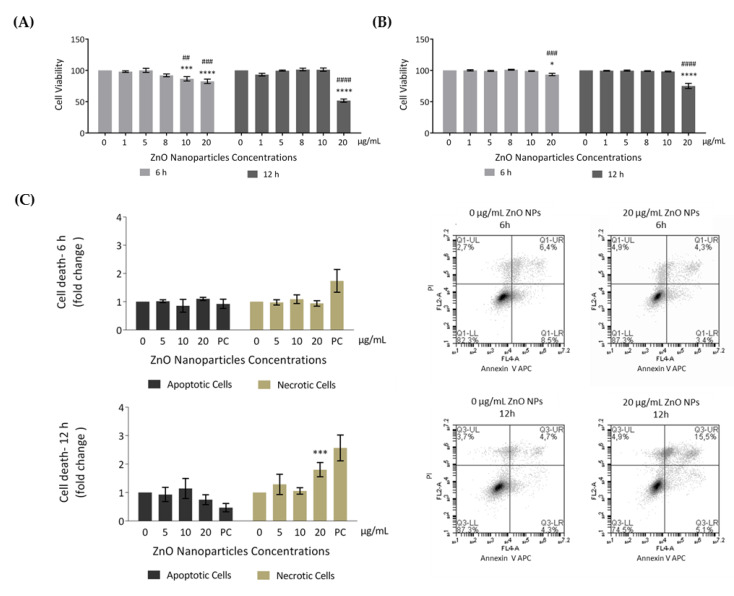
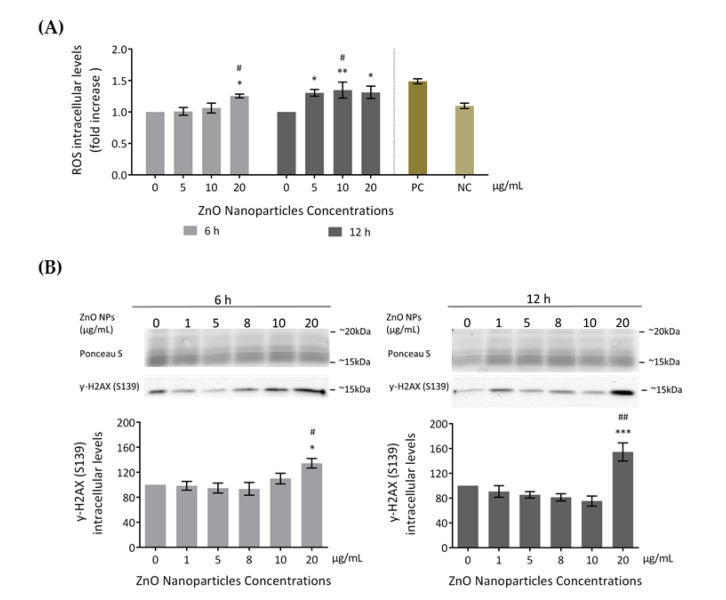
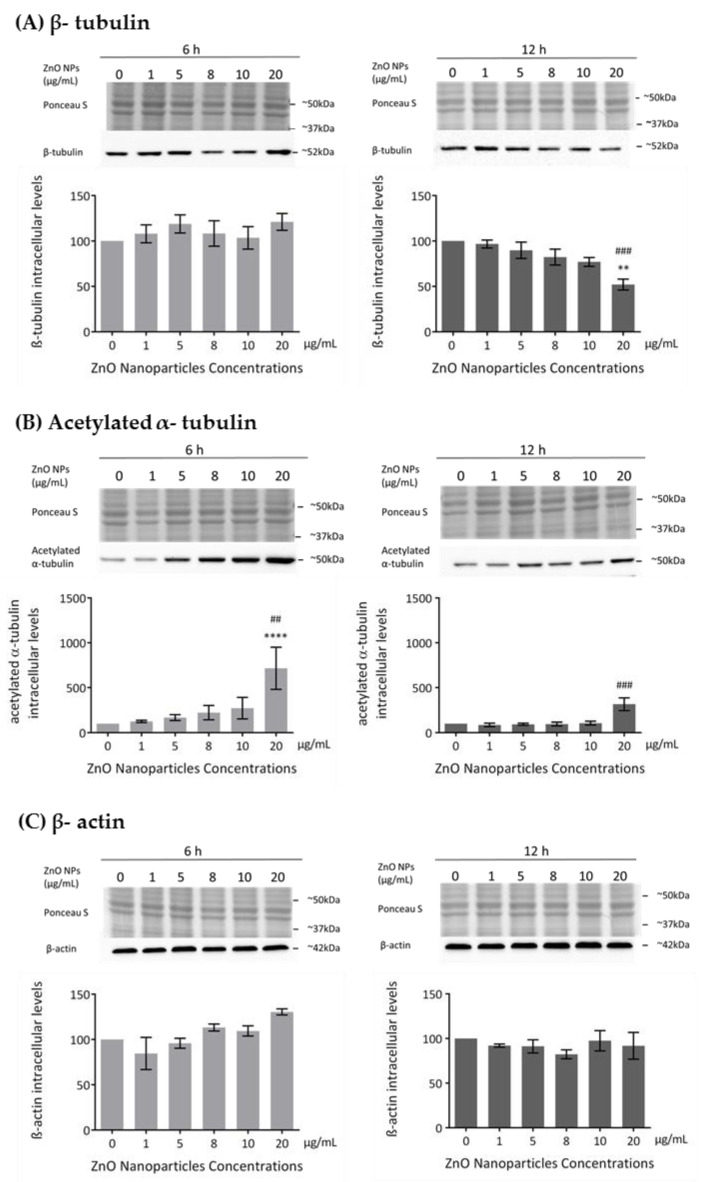
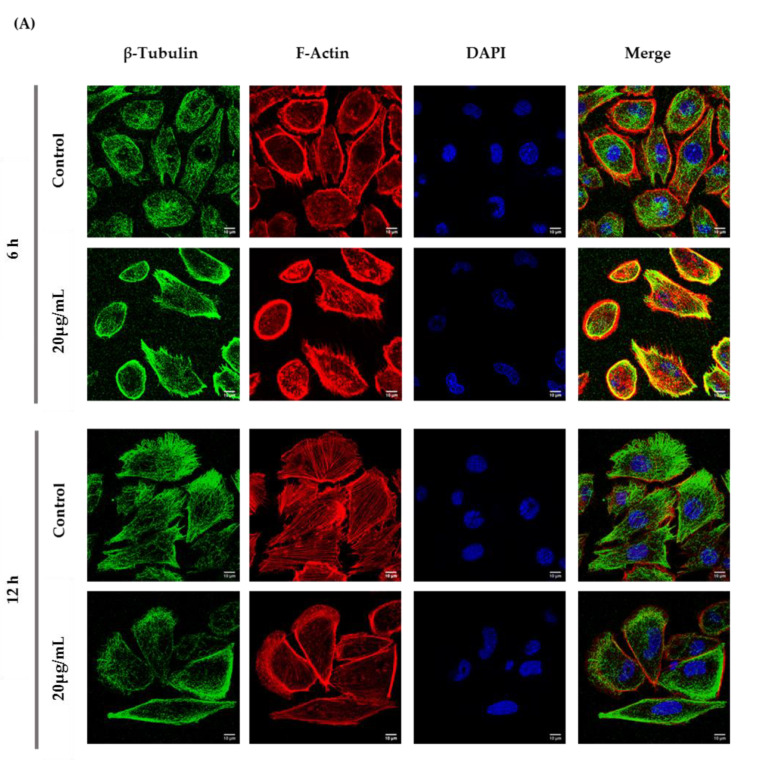
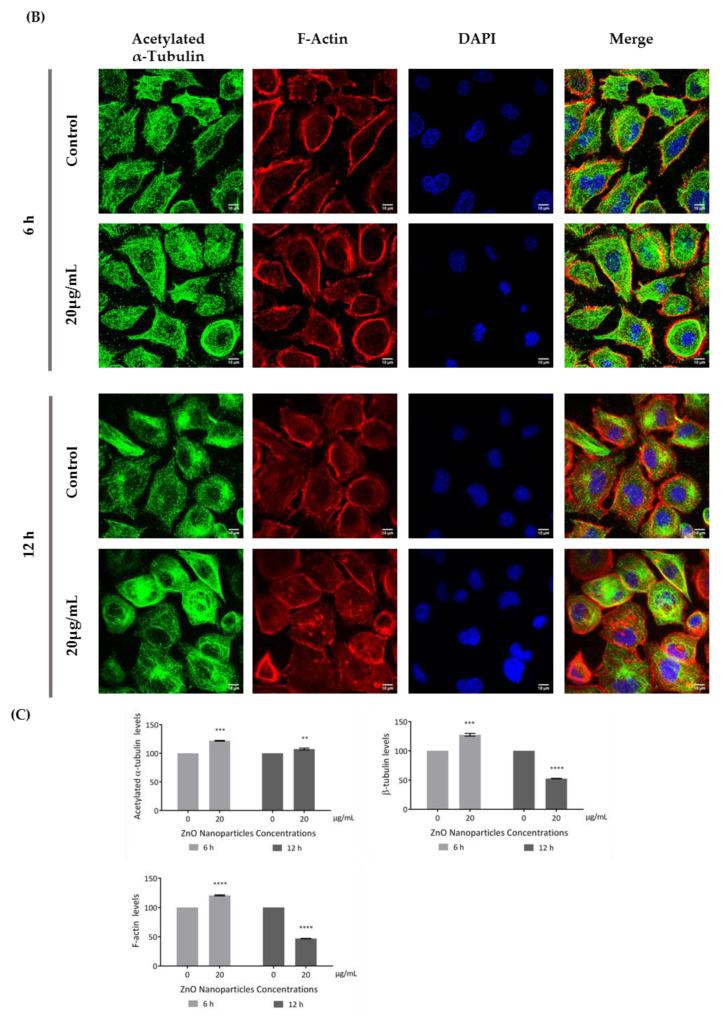
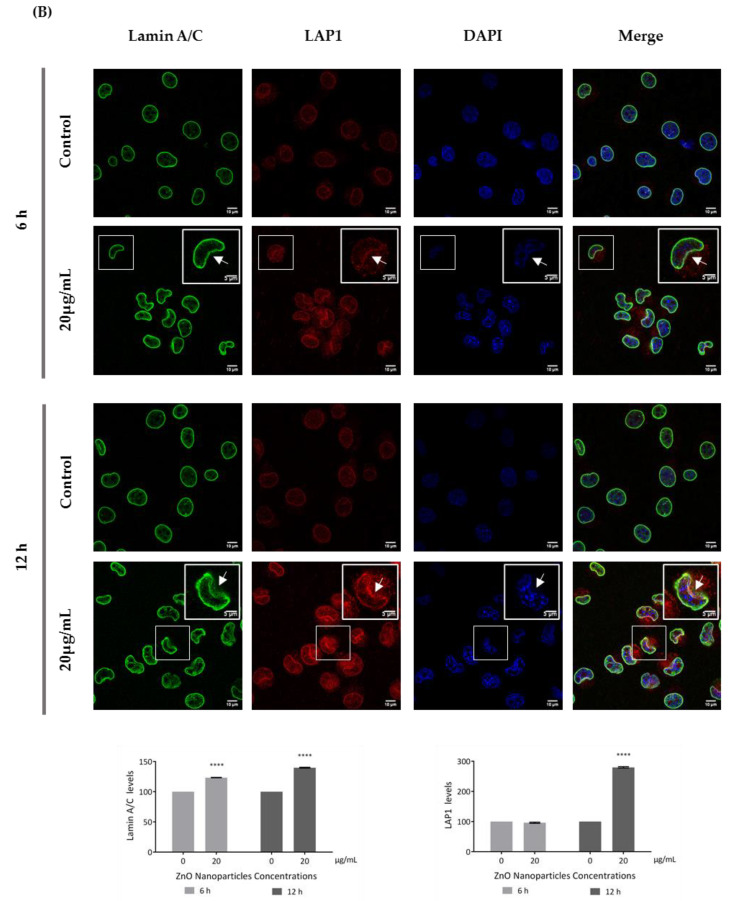
Zinc Oxide Nanoparticles (ZnO NPs) are a type of metal oxide nanoparticle with an extensive use in biomedicine. Several studies have focused on the biosafety of ZnO NPs, since their size and surface area favor entrance and accumulation in the body, which can induce toxic effects. In previous studies, ZnO NPs have been identified as a dose- and time-dependent cytotoxic inducer in testis and male germ cells. However, the consequences for the first cell stage of spermatogenesis, spermatogonia, have never been evaluated. Therefore, the aim of the present work is to evaluate in vitro the cytotoxic effects of ZnO NPs in spermatogonia cells, focusing on changes in cytoskeleton and nucleoskeleton. For that purpose, GC-1 cell line derived from mouse testes was selected as a model of spermatogenesis. These cells were treated with different doses of ZnO NPs for 6 h and 12 h. The impact of GC-1 cells exposure to ZnO NPs on cell viability, cell damage, and cytoskeleton and nucleoskeleton dynamics was assessed. Our results clearly indicate that higher concentrations of ZnO NPs have a cytotoxic effect in GC-1 cells, leading to an increase of intracellular Reactive Oxygen Species (ROS) levels, DNA damage, cytoskeleton and nucleoskeleton dynamics alterations, and consequently cell death. In conclusion, it is here reported for the first time that ZnO NPs induce cytotoxic effects, including changes in cytoskeleton and nucleoskeleton in mouse spermatogonia cells, which may compromise the progression of spermatogenesis in a time- and dose-dependent manner.

Keywords: DNA damage; ZnO nanoparticles; cell death; cytoskeleton; cytotoxicity; nucleoskeleton; reactive oxygen species; spermatogonia.


Conflict of interest statement

The authors declare no conflict of interest. The funders had no role in the design of the study; in the collection, analyses, or interpretation of data; in the writing of the manuscript; or in the decision to publish the results.

Figures

Figure 1
Figure 1
Characterization of ZnO nanoparticles (NPs): Characterization of commercial ZnO powder: (A) XRD; (B) SEM image; (C) Zeta potential curve, and (D) table summarizing the morphological characteristics. XRD—X-ray diffraction; SEM—Scanning electron microscopy.
Figure 2
Figure 2
Schematic representation of experimental workflow: Methods used for evaluation of the cytotoxic effects of ZnO NPs in the GC-1 spg cell line (ATCC® CRL2053™). The study was divided in two stages. Initially, cytotoxicity was evaluated by cell viability and cell damage analysis (oxidative and DNA damage), and then, the alterations of cytoskeleton and nucleoskeleton were also pursued. IB—Immunoblotting; ZnO NPs—Zinc Oxide Nanoparticles.
Figure 3
Figure 3
Evaluation of cell viability induced by ZnO NPs in GC-1 spg cells: (A) Cell viability was assessed using the resazurin assay. Results from the viability analysis of GC-1 cells after exposure for 6 h and 12 h to different ZnO NP concentrations: The viability for each condition is presented as mean ± SEM of seven independent experiments. Values are expressed as arbitrary units, and the cell viability of the control condition was given a value of 100. (B) Cell viability was assessed using the trypan blue exclusion method. Trypan blue analysis of GC-1 cells after exposure for 6 h and 12 h to different ZnO NPs concentrations: The viability for each condition is presented as mean ± SEM of six independent experiments. Values are expressed as arbitrary units, and the cell viability of the control condition was given a value of 100. (C) Cell viability was assessed by flow cytometry analysis of Annexin V/ propidium iodide (PI). Flow cytometry analysis of Annexin V-APC and PI staining and of membrane and DNA markers, respectively, in the GC-1 cell line after exposure to 0, 5, 10, and 20 µg/mL of ZnO NPs for 6 h and 12 h. Positive control was performed using H2O2. The fold change in controls (cells without ZnO NPs) of apoptotic and necrotic cells was plotted as mean ± SEM of four independent experiments, for each condition. * For comparisons between concentrations and time points, two-way ANOVA was used. # For comparisons between concentrations, one-way ANOVA was used. */# p < 0.05. **/## p < 0.01. ***/### p ≤ 0.001. ****/#### p < 0.0001. PI—Propidium Iodide. PC—Positive Control.
Figure 4
Figure 4
Cell damage induced by ZnO NPs: (A) Oxidative damage. Reactive Oxygen Species (ROS) intracellular level detection using the Total ROS Detection kit (ENZO Life Sciences) after the exposure of GC-1 cells to different concentrations of ZnO NPs. Positive and negative controls were performed using pyocyanin and N-acetyl-l-cysteine (NAC), respectively. The ROS levels were plotted as fold increase over the control (cells without ZnO NPs) for both 6 h and 12 h. The values for each condition were presented as a mean ± SEM of four independent experiments. (B) DNA damage: Analysis of γ-H2AX (Ser 139), a marker of DNA damage, by immunoblotting in GC-1 cells treated with different concentrations of ZnO NPs for 6 and 12 h. Protein levels are presented as a fold increase (%) over controls, which was plotted as mean ± SEM of four independent experiments. * For comparisons between concentrations and time points, two-way ANOVA was used. # For comparisons between concentrations, one-way ANOVA was used. */# p < 0.05. **/## p < 0.01. *** p ≤ 0.001. NAC—N-acetyl-l-cysteine. NC—Negative Control. PC—Positive Control. ROS—Reactive Oxygen Species.
Figure 5
Figure 5
Influence of ZnO NPs in cytoskeleton structure and dynamics of GC-1 spg cells: (A) Quantification of β-tubulin, (B) acetylated α-tubulin, (C) β-actin protein levels in GC-1 cells by immunoblotting analysis. Cells were exposed to ZnO NPs for 6 h and 12 h. Protein levels are presented as a fold change (%) over controls, which was plotted as mean ± SEM of three or four independent experiments. * For comparisons between concentrations and time points, two-way ANOVA was used. # For comparisons between concentrations, one-way ANOVA was used. **/## p < 0.01. ### p ≤ 0.001. **** p < 0.0001.
Figure 6
Figure 6
Influence of ZnO NPs in cytoskeleton structure and in nuclear morphology of GC-1 spg cells by immunocytochemistry: Immunocytochemistry images of (A) β-tubulin, (B) acetylated α-tubulin, and (A,B) F-actin; (C) relative fluorescence intensity quantification of α-tubulin, β-tubulin, and F-actin protein levels; and (D) morphological analysis of nuclei in GC-1 spg cell line. The cells were exposed to 0 and 20 µg/mL ZnO NPs for 6 h and 12 h. The protein levels are presented as a fold change (%) over controls, which was plotted as mean ± SEM of three independent experiments. Each experiment was obtained by analyzing at least 30 cells per condition. The percentage of cells with nuclear morphological changes is shown as a fold change, which was plotted as mean ± SEM of four independent experiments. Each experiment was obtained by analyzing at least 60 nuclei per condition ** p < 0.01. *** p ≤ 0.001. **** p < 0.0001. * For comparisons between concentrations and time points, two-way ANOVA was used.
Figure 6
Figure 6
Influence of ZnO NPs in cytoskeleton structure and in nuclear morphology of GC-1 spg cells by immunocytochemistry: Immunocytochemistry images of (A) β-tubulin, (B) acetylated α-tubulin, and (A,B) F-actin; (C) relative fluorescence intensity quantification of α-tubulin, β-tubulin, and F-actin protein levels; and (D) morphological analysis of nuclei in GC-1 spg cell line. The cells were exposed to 0 and 20 µg/mL ZnO NPs for 6 h and 12 h. The protein levels are presented as a fold change (%) over controls, which was plotted as mean ± SEM of three independent experiments. Each experiment was obtained by analyzing at least 30 cells per condition. The percentage of cells with nuclear morphological changes is shown as a fold change, which was plotted as mean ± SEM of four independent experiments. Each experiment was obtained by analyzing at least 60 nuclei per condition ** p < 0.01. *** p ≤ 0.001. **** p < 0.0001. * For comparisons between concentrations and time points, two-way ANOVA was used.
Figure 7
Figure 7
Influence of ZnO NPs in nucleoskeleton structure of GC-1 spg cell line by immunocytochemistry: Immunocytochemistry images of (A) nesprin-1 and SUN1, and (B) lamin A/C and LAP1 in the GC-1 spg cell line and the respective relative fluorescence intensity quantification. Cells were exposed to 0 and 20 µg/mL ZnO NPs for 6 h and 12 h. Areas of nucleus confinement are evident (arrows). Protein levels are presented as a fold change (%) over controls, which was plotted as mean ± SEM of three independent experiments. Each experiment was obtained by analyzing at least 40 cells per condition. *** p ≤ 0.001. **** p < 0.0001.
Figure 7
Figure 7
Influence of ZnO NPs in nucleoskeleton structure of GC-1 spg cell line by immunocytochemistry: Immunocytochemistry images of (A) nesprin-1 and SUN1, and (B) lamin A/C and LAP1 in the GC-1 spg cell line and the respective relative fluorescence intensity quantification. Cells were exposed to 0 and 20 µg/mL ZnO NPs for 6 h and 12 h. Areas of nucleus confinement are evident (arrows). Protein levels are presented as a fold change (%) over controls, which was plotted as mean ± SEM of three independent experiments. Each experiment was obtained by analyzing at least 40 cells per condition. *** p ≤ 0.001. **** p < 0.0001.

References

    1. Jiang J., Pi J., Cai J. The Advancing of Zinc Oxide Nanoparticles for Biomedical Applications. Bioinorg. Chem. Appl. 2018;2018:1–18. doi: 10.1155/2018/1062562. - DOI - PMC - PubMed
    1. Madhumitha G., Elango G., Roopan S.M. Biotechnological Aspects of ZnO Nanoparticles: Overview on Synthesis and Its Applications. Appl. Microbiol. Biotechnol. 2016;100:571–581. doi: 10.1007/s00253-015-7108-x. - DOI - PubMed
    1. Sharma H., Kumar K., Choudhary C., Mishra P.K., Vaidya B. Development and Characterization of Metal Oxide Nanoparticles for the Delivery of Anticancer Drug. Artif. Cells Nanomed. Biotechnol. 2016;44:672–679. doi: 10.3109/21691401.2014.978980. - DOI - PubMed
    1. Sabir S., Arshad M., Chaudhari S.K. Zinc Oxide Nanoparticles for Revolutionizing Agriculture: Synthesis and Applications. Sci. World J. 2014;2014:1–8. doi: 10.1155/2014/925494. - DOI - PMC - PubMed
    1. Lu H., Wang J., Stoller M., Wang T., Bao Y., Hao H. An Overview of Nanomaterials for Water Technology. Adv. Mater. Sci. Eng. 2017;2016:1–10. doi: 10.4018/978-1-5225-2136-5.ch001. - DOI

Publication types

LinkOut - more resources