. 2020 Dec;9(1):940-948.
doi: 10.1080/22221751.2020.1762515.

Kinetics of SARS-CoV-2 specific IgM and IgG responses in COVID-19 patients

Affiliations

Kinetics of SARS-CoV-2 specific IgM and IgG responses in COVID-19 patients

Baoqing Sun et al. Emerg Microbes Infect. 2020 Dec.

Abstract

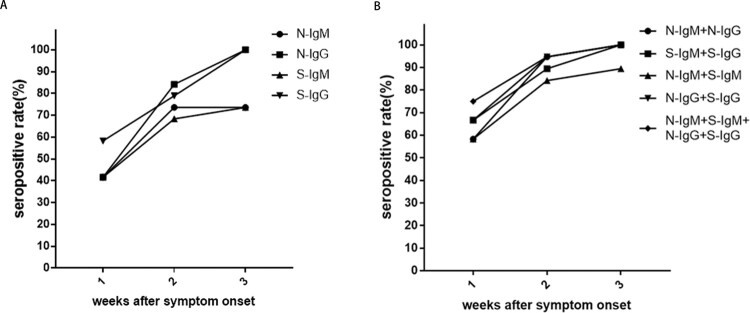
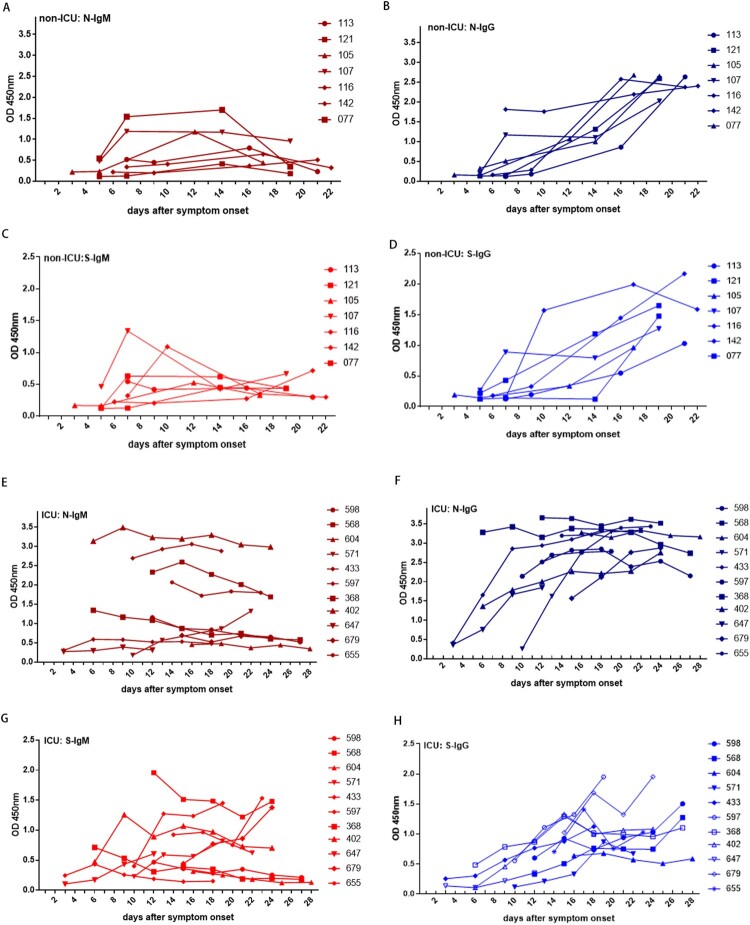
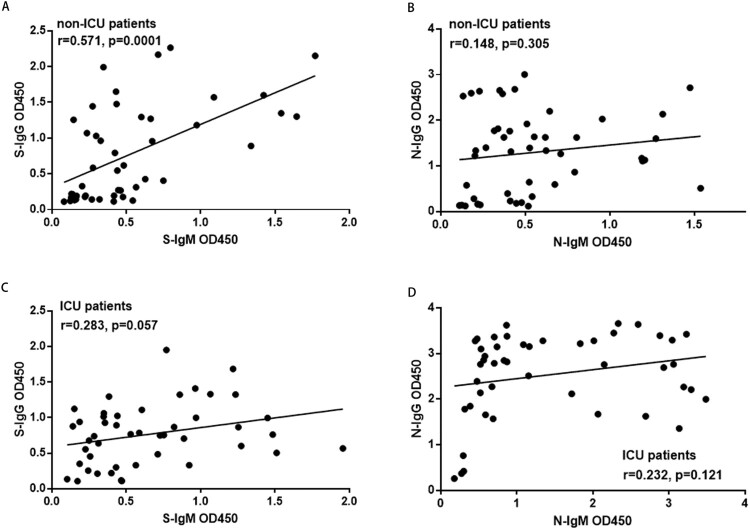
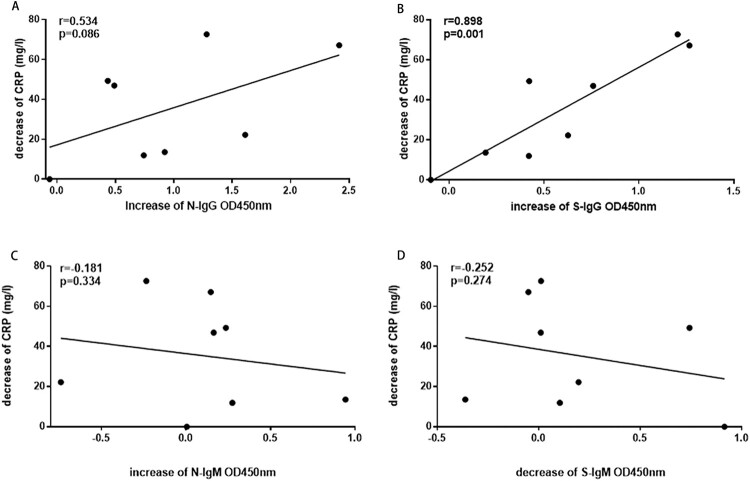
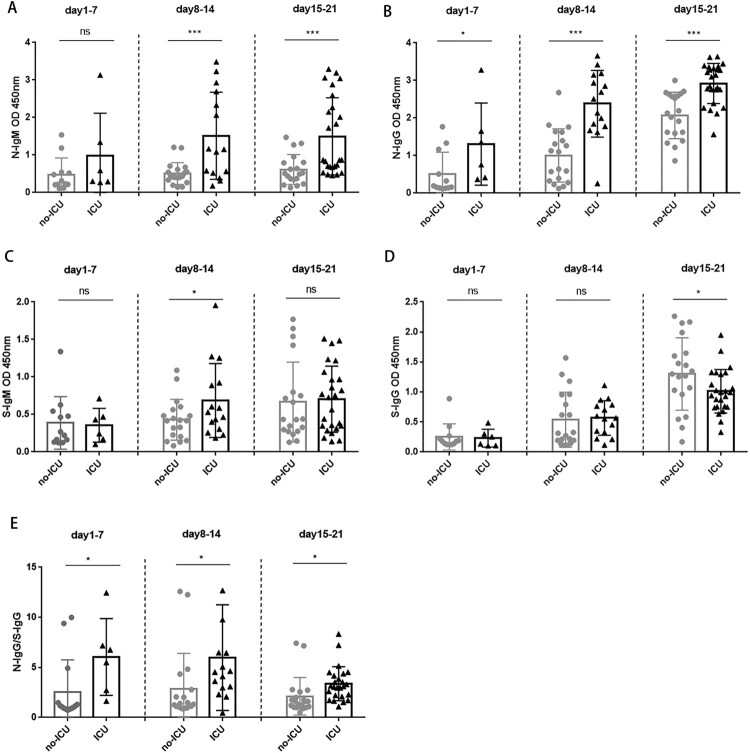
The emerging COVID-19 caused by SARS-CoV-2 infection poses severe challenges to global public health. Serum antibody testing is becoming one of the critical methods for the diagnosis of COVID-19 patients. We investigated IgM and IgG responses against SARS-CoV-2 nucleocapsid (N) and spike (S) protein after symptom onset in the intensive care unit (ICU) and non-ICU patients. 130 blood samples from 38 COVID-19 patients were collected. The levels of IgM and IgG specific to N and S protein were detected by ELISA. A series of blood samples were collected along the disease course from the same patient, including 11 ICU patients and 27 non-ICU patients for longitudinal analysis. N and S specific IgM and IgG (N-IgM, N-IgG, S-IgM, S-IgG) in non-ICU patients increased after symptom onset. N-IgM and S-IgM in some non-ICU patients reached a peak in the second week, while N-IgG and S-IgG continued to increase in the third week. The combined detection of N and S specific IgM and IgG could identify up to 75% of SARS-CoV-2 infected patients in the first week. S-IgG was significantly higher in non-ICU patients than in ICU patients in the third week. In contrast, N-IgG was significantly higher in ICU patients than in non-ICU patients. The increase of S-IgG positively correlated with the decrease of C-reactive protein (CRP) in non-ICU patients. N and S specific IgM and IgG increased gradually after symptom onset and can be used for detection of SARS-CoV-2 infection. Analysis of the dynamics of S-IgG may help to predict prognosis.

Keywords: C-reactive protein; COVID-19; IgG; IgM; SARS-CoV-2.


Conflict of interest statement

No potential conflict of interest was reported by the authors.

Figures

Figure 1.
Figure 1.
The seropositive rates of N and S specific IgM and IgG antibody responses in non-ICU patients after symptom onset. A. The changes in seropositive rates of N-IgM, N-IgG, S-IgM and S-IgG in 27 non-ICU patients. B. The changes in seropositive rates of N-IgM + N-IgG, S-IgM + S-IgG, N-IgM + S-IgM, N-IgG + S-IgG, N-IgM + S-IgM + N-IgG + S-IgG in 27 non-ICU patients.
Figure 2.
Figure 2.
Kinetics of N and S specific IgM and IgG responses in non-ICU patients and ICU patients. (A) N-IgM, (B) N-IgG, (C) S-IgM, (D) S-IgG responses in 7 non-ICU patients; (E) N-IgM, (F) N-IgG, (G) S-IgM, (H) S-IgG antibodies response in 11 ICU patients.
Figure 3.
Figure 3.
The correlation between N and S specific IgM and IgG responses in non-ICU patients and ICU patients. A. The correlation between S-IgG and S-IgM in non-ICU patients; B. The correlation between N-IgG and N-IgM in non-ICU patients; C. The correlation between S-IgG and S-IgM in ICU patients; D. The correlation between N-IgG and N-IgM in ICU patients. The Pearson correlation coefficient was used to measure the strength of the correlation between IgM and IgG antibodies. The correlation coefficient was calculated using Student’s t-test, a P-value < 0.05 was considered statistically significant. *, P < 0.05; **, P < 0.01; ***, P < 0.001.
Figure 4.
Figure 4.
The correlation between N and S specific IgM and IgG responses with CRP in non-ICU patients. A. The correlation between N-IgG and the reduction of CRP; B. The correlation between S-IgG and the reduction of CRP; C. The correlation between N-IgM and CRP; D. The correlation between S-IgM and CRP. The Pearson correlation coefficient was used to measure the strength of the correlation between CPR and IgM or IgG antibodies.
Figure 5.
Figure 5.
The N and S specific IgM and IgG responses in non-ICU patients and ICU patients. A. Comparison of N-IgM responses between non-ICU and ICU patients; B. Comparison of N-IgG responses between non-ICU and ICU patients; C. Comparison of S-IgM responses between non-ICU and ICU patients; D. Comparison of S-IgG responses between non-ICU and ICU patients. E. Comparison of N-IgG/S-IgG ratio between non-ICU and ICU patients. Correlation coefficient was calculated using Student’s t test, a P-value < 0.05 was considered statistically significant. *, P < 0.05; **, P < 0.01; ***, P < 0.001.

References

    1. Wu A, Peng Y, Huang B, et al. Genome composition and divergence of the novel coronavirus (2019-nCoV) originating in China. Cell Host Microbe. 2020;27(3):325–328. doi: 10.1016/j.chom.2020.02.001 - DOI - PMC - PubMed
    1. Lu R, Zhao X, Li J, et al. Genomic characterisation and epidemiology of 2019 novel coronavirus: implications for virus origins and receptor binding. The Lancet. 2020;395(10224):565–574. doi: 10.1016/S0140-6736(20)30251-8 - DOI - PMC - PubMed
    1. Wrapp D, Wang N, Corbett KS, et al. Cryo-EM structure of the 2019-nCoV spike in the prefusion conformation. Science. 2020;10:1126. - PMC - PubMed
    1. Gallagher TM, Buchmeier MJ.. Coronavirus spike proteins in viral entry and pathogenesis. Virology. 2001;279(2):371–374. doi: 10.1006/viro.2000.0757 - DOI - PMC - PubMed
    1. Li F. Structure, function, and evolution of coronavirus spike proteins. Annu Rev Virol. 2016;3(1):237–261. doi: 10.1146/annurev-virology-110615-042301 - DOI - PMC - PubMed

MeSH terms