. 2020 May 1;11(1):2148.
doi: 10.1038/s41467-020-15978-3.

MD2 activation by direct AGE interaction drives inflammatory diabetic cardiomyopathy

Affiliations

MD2 activation by direct AGE interaction drives inflammatory diabetic cardiomyopathy

Yi Wang et al. Nat Commun. .

Abstract

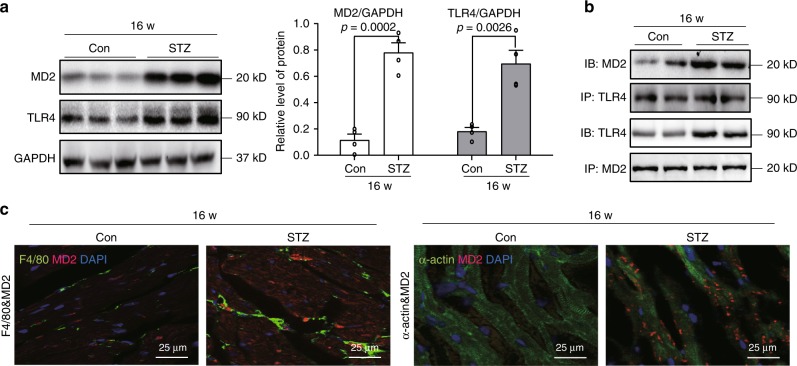
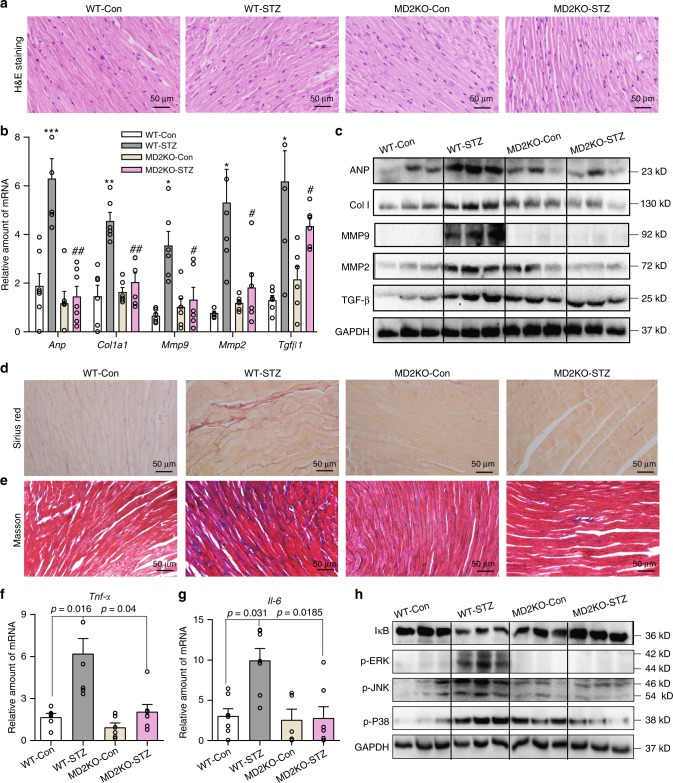
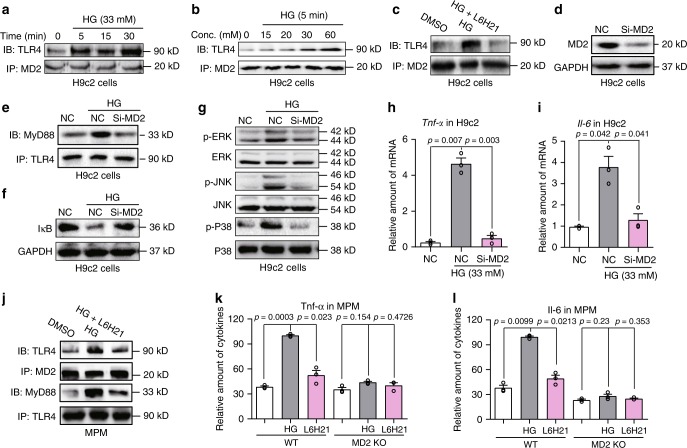
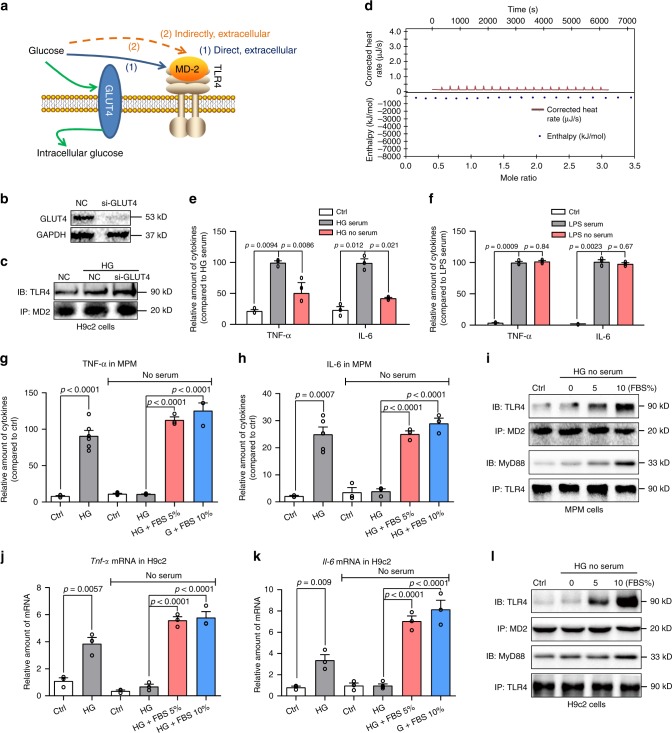
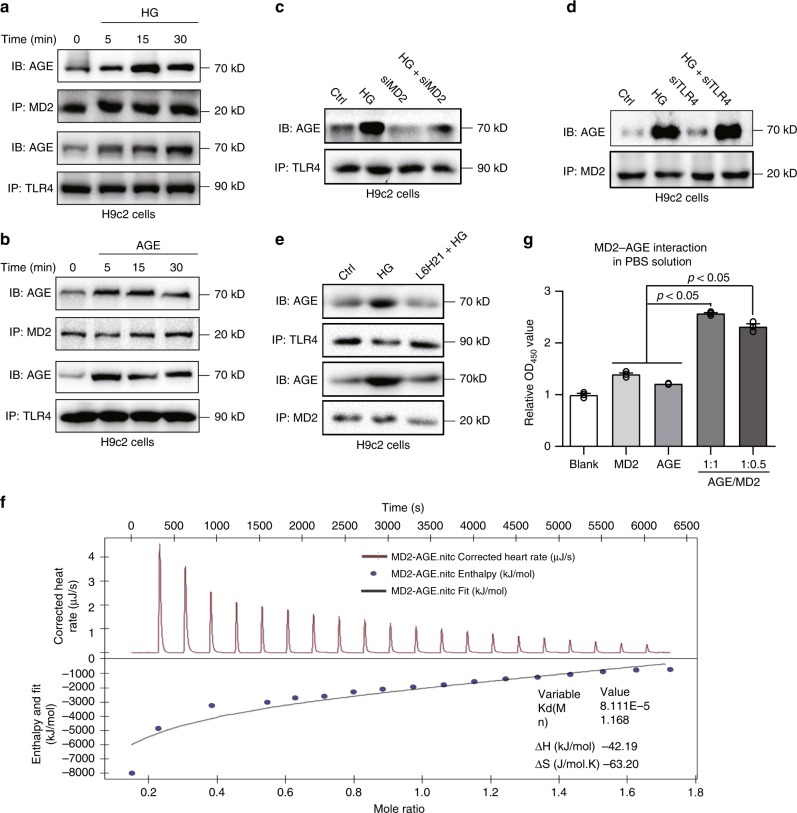
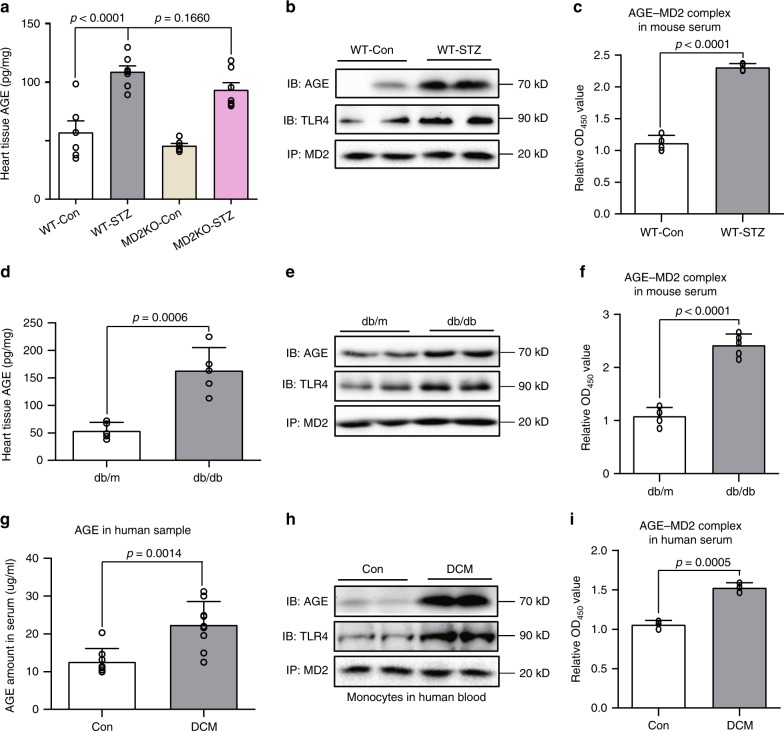
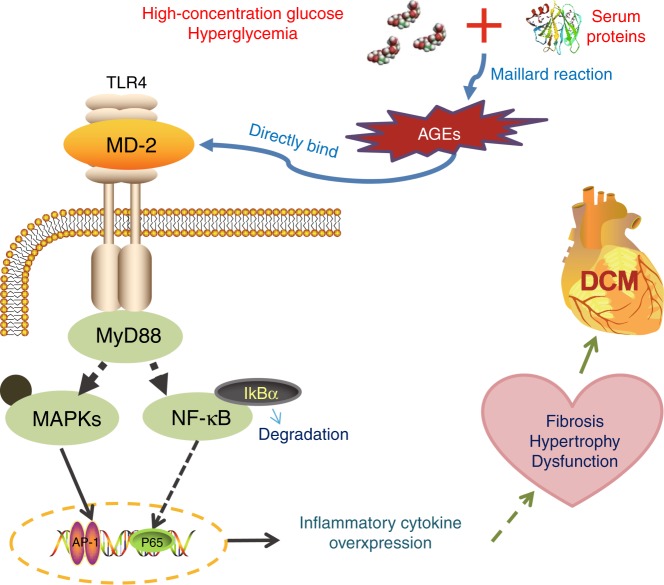
Hyperglycemia activates toll-like receptor 4 (TLR4) to induce inflammation in diabetic cardiomyopathy (DCM). However, the mechanisms of TLR4 activation remain unclear. Here we examine the role of myeloid differentiation 2 (MD2), a co-receptor of TLR4, in high glucose (HG)- and diabetes-induced inflammatory cardiomyopathy. We show increased MD2 in heart tissues of diabetic mice and serum of human diabetic subjects. MD2 deficiency in mice inhibits TLR4 pathway activation, which correlates with reduced myocardial remodeling and improved cardiac function. Mechanistically, we show that HG induces extracellular advanced glycation end products (AGEs), which bind directly to MD2, leading to formation of AGEs-MD2-TLR4 complex and initiation of pro-inflammatory pathways. We further detect elevated AGE-MD2 complexes in heart tissues and serum of diabetic mice and human subjects with DCM. In summary, we uncover a new mechanism of HG-induced inflammatory responses and myocardial injury, in which AGE products directly bind MD2 to drive inflammatory DCM.


Conflict of interest statement

The authors declare no competing interests.

Figures

Fig. 1
Fig. 1. MD2-TLR4 complex activation in hearts of diabetic mice.
A mouse model of type 1 diabetes mellitus was developed by administering streptozotocin to C57BL/6 mice. Heart tissues were harvested at 16 weeks [Con = non-diabetic controls, STZ = diabetic mice]. a Representative immunoblot for MD2 and TLR4 in mouse cardiac tissue. GAPDH was used as loading control. Densitometric quantification of blots showing MD2 (white bars) and TLR4 (black bars) [n = 4; 3 Con and 3 STZ samples shown in immunoblots; means ± SEM]. b Representative immunoblots showing co-immunoprecipitation of TLR4 and MD2 in mouse heart tissues at 16 weeks following onset of diabetes [IP = precipitating antibody, IB = immunoblot antibody; n = 4; 2 Con and 2 STZ samples shown in immunoblots]. c Representative immunofluorescence staining of mouse heart tissues at 16 weeks for MD2 (red), macrophage marker F4/80 (green), and myocyte marker α-actin (green). Slides were counterstained with DAPI (blue) [n = 4]. Source data are provided as a Source Data file.
Fig. 2
Fig. 2. MD2 deficiency prevents diabetes-induced cardiac injury.
Diabetes was induced in C57BL/6 wild-type and MD2−/− mice by streptozotocin. Heart tissues were harvested at 16 weeks [WT-Con = non-diabetic wild-type controls, WT-STZ = diabetic wild type, MD2KO-Con = non-diabetic MD2−/−, MD2KO-STZ = diabetic MD2−/−]. a Representative H&E staining of cardiac tissues [n = 6]. b mRNA levels of cardiac tissue Anp, Col1a1, Mmp9, Mmp2, and Tgfb1 normalized to Actb [means ± SEM; n = 6 per group; *p < 0.05, **p < 0.01, ***p < 0.001 compared with WT-Con; #p < 0.05, ##p < 0.01 compared with WT-STZ; P-values by unpaired t test are indicated]. c Representative immunoblots showing cardiac tissue ANP, Col 1, MMP-9, MMP-2, and TGF-β. GAPDH was used as a loading control [n = 6; 3 samples per group shown]. d, e Representative staining images of mouse heart sections showing Sirius Red (d) and Masson’s Trichrome (e) (n = 6 per group). f, g qPCR analysis of Tnfa and Il6 mRNA levels in cardiac tissues [means ± SEM; n = 6 per group]. h Representative immunoblots showing levels of IκB and phosphorylated ERK, JNK, and P38 in mouse cardiac tissues. GAPDH was used as loading control [n = 6; 3 samples per group shown]. Source data are provided as a Source Data file. P-values by one-way ANOVA in b, f, and g followed by Tukey’s post hoc test are indicated.
Fig. 3
Fig. 3. High glucose activates MD2-TLR4 signaling in cardiac cells.
a, b Representative immunoblots showing co-immunoprecipitation of MD2 and TLR4 in H9C2 cells exposed to HG for varying time points (a) and concentration (b) [n = 3]. c H9C2 cells were pretreated with 10 μM MD2 inhibitor L6H21 for 30 min before exposure to HG (33 mM glucose) for 5 min. Representative immunoblots showing co-immunoprecipitation of MD2 and TLR4 [n = 3]. d Western blot analysis showing levels of MD2 protein following transfection of H9C2 cells with MD2 siRNA [si-MD2 = MD2 targeting siRNA, NC = negative control; n = 3]. e Co-immunoprecipitation of TLR4 and MyD88 in H9C2 cells transfected with MD2 siRNA (si-MD2) and exposed to HG (33 mM glucose, 15 min) [n = 3]. f, g Representative blots of IκB and phosphorylation of ERK, JNK, and P38 in H9C2 cells transfected with MD2 siRNA and exposed to HG (33 mM glucose, 15 min). GAPDH and total MAPK proteins served as controls [n = 3]. h, i Tnfa and Il6 mRNA levels in H9C2 cells transfected with MD2 siRNA (si-MD2) and challenged with HG (33 mM glucose, 6 h) [means ± SEM; n = 3 independent examinations]. j Co-immunoprecipitation of TLR4, MyD88, and MD2 in mouse peritoneal macrophages (MPMs). MPMs were pretreated with 10 μM MD2 inhibitor L6H21 for 30 min before exposure to HG (33 mM glucose). MD2-TLR4 complex was assessed following 5 min of HG exposure and TLR4-MyD88 complex at 15 min of HG exposure [n = 3 examinations]. k, l Levels of TNF-α and IL-6 in culture media of MPMs isolated from non-diabetic WT and MD2KO mice. Cells were pretreated with 10 μM L6H21 for 1 h and then exposed to HG (33 mM glucose) for 24 h. TNF-α and IL-6 levels were determined by ELISA [means ± SEM; n = 3 examinations]. Source data are provided as a Source Data file. P-values by one-way ANOVA in h, i, k, and l followed by Tukey’s post hoc test are indicated.
Fig. 4
Fig. 4. HG-mediated MD2-TLR4 activation requires serum.
a Schematic illustrating the potential modes of HG activating MD2-TLR4. b Immunoblot showing GLUT4 levels in H9C2 cells following siRNA transfection [si-GLUT4 = GLUT4 siRNA, NC = negative control; n = 3]. c TLR4-MD2 complex in H9C2 cells transfected with si-GLUT4 and exposed to HG for 5 min [n = 3]. d Isothermal titration calorimetry to detect glucose and human recombinant MD2 protein interaction (three independent experiments). e, f MPMs were exposed to HG in the presence or absence of serum for 24 h (e). Similarly, MPMs were exposed to LPS (f). Levels of TNF-α and IL-6 in culture media were determined [Ctrl = control with 10% FBS, HG/LPS serum = 33 mM glucose or 0.5 μg/mL LPS with 10% FBS, HG/LPS no-serum = 33 mM glucose or 0.5 μg/mL LPS with no-serum; means ± SEM; n = 3 examinations]. g, h MPMs were exposed to HG in the presence or absence of FBS for 24 h. MPMs in serum (first two bars on left) were expanded in media containing 10% FBS and exposed to HG in media containing 10% FBS. MPMs in no-serum (four bars on right) were expanded in media containing 10% FBS, serum-starved for 24 h, and the exposed to HG with indicated levels of FBS. Levels of TNF-α (g) and IL-6 (h) were determined in culture medium [means ± SEM; n = 3 examinations]. i Immunoblot showing TLR4-MyD88 and MD2-TLR4 complexes in MPMs exposed to HG in media containing FBS [Ctrl=media without serum; n = 3 independent experiments]. j, k H9C2 cells were exposed to HG in the presence or absence of FBS for 24 h. H9C2 cell treatments were carried out as described for MPMs. Levels of TNF-α (i) and IL-6 (k) were determined [means ± SEM; n = 3 examinations]. l Immunoblot showing TLR4-MyD88 and MD2-TLR4 complexes in H9C2 cells exposed to HG in media containing FBS [Ctrl=media without serum; n = 3]. Source data are provided as a Source Data file. P-values by one-way ANOVA in e, f, g, h, j, and k followed by Tukey’s post hoc test are indicated.
Fig. 5
Fig. 5. AGE products stimulate MD2-dependent inflammatory responses.
a AGE product formation in MPMs exposed to HG in the presence or absence of serum. MPMs were exposed to 33 mM glucose for different time periods in media containing 0 or 10% FBS. Levels of AGE products were determined in conditioned medium by ELISA [means ± SEM; n = 4 examinations]. b AGE product formation in H9C2 cells exposed to HG in the presence or absence of serum. H9C2 cells were exposed to 33 mM glucose for different time periods in media containing 0 or 10% FBS. Levels of AGE products were determined in conditioned medium by ELISA [means ± SEM; n = 4 examinations]. c Representative immunoblot showing co-immunoprecipitation of MD2-TLR4 complex in MPMs exposed to 33 μg/mL AGE-BSA [n = 6]. d Representative immunoblot showing co-immunoprecipitation of MD2-TLR4 complex in H9C2 cells exposed to 33 μg/mL AGE-BSA [n = 3]. e Levels of TNF-α and IL-6 in condition media of MPMs exposed to 33 μg/mL AGE-BSA for 24 h. MPMs isolated from WT or MD2KO mice were tested [means ± SEM; n = 4 examinations]. f Levels of Tnfa and Il6 mRNA in H9C2 cells exposed to 33 μg/mL AGE-BSA for 6 h. H9C2 cells were transfected with control siRNA or siRNA targeting MD2 (siMD2) before treatments [means ± SEM; n = 6 examinations]. Source data are provided as a Source Data file. P-values by one-way ANOVA in a, b, e, f followed by Tukey’s post hoc test are indicated.
Fig. 6
Fig. 6. AGE products bind to MD2.
a Representative immunoblot showing co-immunoprecipitation of AGE-MD2 and AGE-TLR4 complexes in H9C2 cells exposed to HG (33 mM glucose) for indicated times [n = 3]. b Representative blots of co-immunoprecipitated AGE-MD2 and AGE-TLR4 complexes in H9C2 cells challenged with 33 μg/mL AGE-BSA for indicated times [n = 3]. c Representative blots of co-immunoprecipitated AGE-TLR4 complexes in H9C2 cells transfected with MD2 siRNA (siMD2) and exposed to HG (33 mM glucose) for 5 min [n = 3]. d Representative blots of co-immunoprecipitated AGE-TLR4 complexes in H9C2 cells transfected with TLR4 siRNA (siTLR4) and exposed to HG (33 mM glucose) for 5 min [n = 3]. e Co-immunoprecipitation of AGE-MD2 and AGE-TLR4 complexes in H9C2 cells pretreated with 10 μM L6H21 for 30 min and then challenged with HG (33 mM glucose) for 5 min [n = 3]. f Isothermal titration calorimetry analysis of interactions between AGE-BSA and rhMD2. Representative image was shown from three independent experiments. g Sandwich ELISA analysis of AGE-MD2 interaction. AGE-BSA and rhMD2 proteins were added at ratios of 1:1 or 1:0.5, or each alone to bovine AGE ELISA plates. Complexes were detected by anti-human MD2 antibody and TMB chromagen [means ± SEM; n = 3 examinations]. Source data are provided as a Source Data file. P-values by one-way ANOVA in g followed by Tukey’s post hoc test are indicated.
Fig. 7
Fig. 7. AGE-MD2 complexes in serum and cardiac tissues in diabetes.
a Levels of AGE products in heart tissues of type 1 mouse model of diabetes. C57BL/6 wild-type and MD2KO mice were made diabetic by streptozotocin. Heart tissues were harvested at 16 weeks and levels of AGE products were determined by ELISA [experimental groups are as described in Fig. 2; means ± SEM; n = 6 per group]. b Representative blots showing co-immunoprecipitation of MD2-AGE complexes in heart tissues from type 1 mouse model of diabetes. Tissues from WT-Con and WT-STZ mice at 16 weeks after confirmation of diabetes were examined [n = 6; two samples per group shown]. c MD2-AGE complexes were measured in serum of WT-Con and WT-STZ mice at 16 weeks [means ± SEM; n = 4]. d Levels of AGE products in heart tissues of type 2 mouse model of diabetes. Heart tissues from db/m (controls) and db/db (diabetic) mice were harvested at 16 weeks. AGE products were determined by ELISA [means ± SEM; n = 5 per group]. e Representative blots showing co-immunoprecipitation of MD2-AGE complexes in heart tissues from type 2 mouse model of diabetes [experimental groups are as shown in panel D; n = 6; two samples per group shown]. f MD2-AGE complexes were measured in serum of db/m and db/db mice at 16 weeks [means ± SEM; n = 5]. g Serum levels of AGE products in healthy human subjects and diabetic subjects with cardiomyopathy [Co = healthy subjects (n = 8), DCM = diabetic subjects with cardiomyopathy (n = 9); means ± SEM]. h Representative blots showing AGE-MD2 complexes in human blood mononuclear cells isolated from healthy subjects (Con) and diabetic subjects (n = 6; two samples per group shown). i MD2-AGE complexes in serum samples from human subjects [means ± SEM; n = 3 per group]. Source data are provided as a Source Data file. P-values by one-way ANOVA in a followed by Tukey’s post hoc test are indicated. P-values by unpaired t test are indicated in c, d, f, g and i.
Fig. 8
Fig. 8. Working model of AGE-induced MD2-TLR4 activation in diabetes.
Schematic illustration showing the key findings of the study. High levels of glucose generate AGE products in the extracellular environment. AGE products bind directly to MD2 and lead to activation of the immune signaling complex MD2-TLR4. Intracellular adaptor proteins such as myeloid differentiation primary response protein-88 (MyD88) are recruited to AGE-MD2-TLR4 complex. TLR4 then leads to activation of mitogen-activated protein kinase (MAPK) and NF-κB signaling pathways, and regulation of genes involved in inflammatory and tissue remodeling responses.

References

    1. de Ferranti SD, et al. Type 1 diabetes mellitus and cardiovascular disease: a scientific statement from the American Heart Association and American Diabetes Association. Diabetes Care. 2014;37:2843–2863. doi: 10.2337/dc14-1720. - DOI - PMC - PubMed
    1. Bugger H, Abel ED. Molecular mechanisms of diabetic cardiomyopathy. Diabetologia. 2014;57:660–671. doi: 10.1007/s00125-014-3171-6. - DOI - PMC - PubMed
    1. Rajesh M, et al. Cannabinoid 1 receptor promotes cardiac dysfunction, oxidative stress, inflammation, and fibrosis in diabetic cardiomyopathy. Diabetes. 2012;61:716–727. doi: 10.2337/db11-0477. - DOI - PMC - PubMed
    1. Westermann D, et al. Contributions of inflammation and cardiac matrix metalloproteinase activity to cardiac failure in diabetic cardiomyopathy: the role of angiotensin type 1 receptor antagonism. Diabetes. 2007;56:641–646. doi: 10.2337/db06-1163. - DOI - PubMed
    1. Westermann D, et al. Cardioprotective and anti-inflammatory effects of interleukin converting enzyme inhibition in experimental diabetic cardiomyopathy. Diabetes. 2007;56:1834–1841. doi: 10.2337/db06-1662. - DOI - PubMed

Publication types

MeSH terms

Substances