. 2020 May 1;11(1):2124.
doi: 10.1038/s41467-020-15980-9.

Effective combinatorial immunotherapy for penile squamous cell carcinoma

Affiliations

Effective combinatorial immunotherapy for penile squamous cell carcinoma

Tianhe Huang et al. Nat Commun. .

Abstract

Penile squamous cell carcinoma (PSCC) accounts for over 95% of penile malignancies and causes significant mortality and morbidity in developing countries. Molecular mechanisms and therapies of PSCC are understudied, owing to scarcity of laboratory models. Herein, we describe a genetically engineered mouse model of PSCC, by co-deletion of Smad4 and Apc in the androgen-responsive epithelium of the penis. Mouse PSCC fosters an immunosuppressive microenvironment with myeloid-derived suppressor cells (MDSCs) as a dominant population. Preclinical trials in the model demonstrate synergistic efficacy of immune checkpoint blockade with the MDSC-diminishing drugs cabozantinib or celecoxib. A critical clinical problem of PSCC is chemoresistance to cisplatin, which is induced by Pten deficiency on the backdrop of Smad4/Apc co-deletion. Drug screen studies informed by targeted proteomics identify a few potential therapeutic strategies for PSCC. Our studies have established what we believe to be essential resources for studying PSCC biology and developing therapeutic strategies.


Conflict of interest statement

The authors declare no competing interests.

Figures
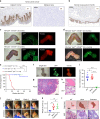
Fig. 1
Fig. 1. Smad4 and Apc co-deletion leads to penile squamous cell carcinoma in mice.
a, b IHC stain for AR in human penile tumors (n = 8) and normal mouse penis (n = 5). Scale bar 100 μm. c, d Morphology and fluorescence for resected mouse penises of indicated genotype and age. Scale bar 2 mm. e Penile prolapse free survival curves for mice of three genotypes with n indicated. ****P < 0.0001, log-rank test. f Morphology and fluorescence for resected mouse penis of SAm genotype at 6.4 months of age, with GFP+ tumor nodules clearly visible. Scale bar 2 mm. g, h H&E stain of penis and prostate lobes (anterior AP, dorsolateral DLP) of SA mouse at 6.8 month of age. White arrows denote keratin pearls. Scale bar 100 μm. i SA males at 8–12 weeks underwent castration or mock surgical procedure. After 4 weeks, the mice were euthanized. The serum testosterone was measured with ELISA for the mice and age-matched wild type (WT) males were used as control (n = 6 for each group). j Representative images of the mouse penis at each week post-surgery. k, l Weight, representative image and H&E staining of resected penises from WT control or SA mice 4 weeks post-surgery. Scale bar 10 mm and 200 μm (n = 8 for WT, n = 6 for mock and castration). In i, k, data represent mean ± SD. #P > 0.05, ***P < 0.001, ****P < 0.0001, two-sided Student’s t test.
Fig. 2
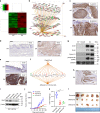
Fig. 2. Transcriptomic analysis reveals activation of β-catenin signaling and inflammatory pathways in mouse PSCC.
a Hierarchical clustering of differentially expressed genes between WT and SA mouse penile samples (n = 3 for each genotype). b Gene regulation network by β-catenin (i.e. CTNNB1), the top upstream regulator identified by IPA to account for differential gene expression changes in SA tumors compared with WT penis. Red and green colors indicate upregulation and downregulation, respectively. ce IHC stain for β-catenin, Sox2 and Cox2 in WT and SA penis, respectively. Scale bar 20 μm for c, 100 μm for d, 200 μm for e. f Mechanistic network for the top ranked master regulator Ptgs2/Cox2 by IPA to illustrate its effect on cytokine expression regulation and function in immune cells. g Western blot showing differential protein expression in penile tissues from WT, PB-Cre4+ Smad4L/L (Smad4) and SA mice. h IHC stain for Ki67 in SA penile tumor. Scale bar 200 μm. i Sox2 expression silenced by two independent shRNA in SA1 cell line, detected by western blot. j Growth curves of subcutaneous tumors formed by control or Sox2 knockdown sublines of SA1 in nude mice (n = 5). k, l Weight and gross images of subcutaneous tumors formed by control or Sox2 knockdown sublines of SA1 at endpoint (Day 83) (n = 5). In j, k, data represent mean ± SD. **P < 0.01, ****P < 0.0001, two-sided Student’s t test.
Fig. 3
Fig. 3. Infiltration of CD11b+ Gr1+ immunosuppressive myeloid cells in mouse penile cancer.
a Frequency of CD45+ immune cells of all live cells in penile tissues from Cre- littermates (control, n = 2) and SA mice (n = 7, 4–5 months of age), with data from CyTOF. b Frequency of indicated immune cell subpopulations of all immune cells for the same sets of penile samples as in a. c Representative viSNE plots of indicated markers for the same sets of penile samples as in a. Note that the sparse dots and numerous dots for Cre- littermate or SA mouse, respectively, reflect the vast difference of the total intratumoral immune cell frequency of the two genotypes. d Activity of CD11b+ Gr1+ cells from SA tumors to suppress proliferation of normal spleen T cells stimulated with anti-CD3/CD28 antibodies. T cells were preloaded with CFSE whose signals declined as T cells divided. Higher MDSC: T cell ratio led to lower percentage of CFSElow T cells (n = 4, 4, 6, and 3 for the ratios in order). e Representative viSNE plots of CD3e and PD1 (CD279) for SA tumors, showing the partial overlap of the two signals. In a, b, all data are shown with the line representing the median. In d, box plots visualize the five-number summary of a data set (minimum, lower quartile, median, upper quartile and maximum). *P < 0.05, **P < 0.01, ***P < 0.001, two-sided Student’s t test.
Fig. 4
Fig. 4. Combined targeted therapy and immunotherapy for spontaneous PSCC in mice.
a Weight of resected penis from SA mice at the endpoint of the treatment course with single or combination therapies (n = 6, 3, 5, 3, 3, and 4, respectively). b Representative images of penises for the SA mice before and after the 1-month treatment course. c, d Quantification of IHC staining for CD11b and Ly6G, markers of tumor infiltrating granulocytic MDSCs, using SA tumor samples treated differently (independent IHC images for CD11b: n = 4, 5, 4, 9, 4, and 4, respectively; independent IHC images for Ly6G: n = 24, 10, 12, 12, 13, and 9, respectively). e Representative IHC images of Ly6G from the experiment in d. Scale bar 50 μm. f Quantification of IHC staining for Foxp3, marker of Tregs, using SA tumor samples treated differently (independent IHC images: n = 11, 6, 4, 3, 8, and 6, respectively). In a, box plots visualize the five-number summary of a data set (minimum, lower quartile, median, upper quartile and maximum). In c, d, and f, all data are shown with the line representing the median. #P > 0.05, *P < 0.05, **P < 0.01, ***P < 0.001, ****P < 0.0001, two-sided Student’s t test.
Fig. 5
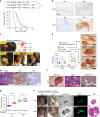
Fig. 5. SAP mice as a model to study chemoresistance of penile cancer.
a Penile prolapse free survival curves for mice of three genotypes with n indicated. ****P < 0.0001, #P > 0.05, log-rank test. b Representative IHC images of phospho-Akt (Ser473). Scale bar 100 μm. c SAP mouse at 8 weeks old with all prostate lobes removed (anterior AP, dorsolateral DLP, ventral VP) and penile tumor followed for 3 weeks before sacrifice. d Representative H&E and IHC images of Ki67 and cleaved caspase-3 (CC3) of the penile tumor from the prostate-removed SAP mouse (n = 3). Scale bar 200 μm. e Orthotopic injection of SAP1 cells under the penile epithelium, or into the prostate gland or at both sites of 6-week Rag1−/− males (n = 5). The mice were euthanized at Day 30 post-injection for organ weight measurement and imaging. Scale bar 10 mm. (f) Representative penile tumor formed by penile injection of SAP1 with H&E staining and IHC of cytokeratin-5 (n = 5). Scale bar 10 mm and 200 μm. g Weight of resected penis from SA and SAP mice at the endpoint of cisplatin treatment course (n = 4 for each group). h Representative images and H&E staining of penises for the SA and SAP mice before and after the 1-month cisplatin treatment. Scale bars 5 mm (bright field and GFP); 1 mm (H&E). In e, g, box plots visualize the five-number summary of a data set (minimum, lower quartile, median, upper quartile and maximum). #P < 0.05, **P < 0.01, ****P < 0.0001, two-sided Student’s t test.
Fig. 6
Fig. 6. RPPA profiling and drug screen using mouse penile cancer cells.
a Unsupervised hierarchical clustering of penile samples from mice of denoted genotypes and treatment (cisplatin) based on normalized RPPA data. One-way ANOVA identified 117 differentially expressed proteins (P < 0.05), which were used for the clustering. b Venn diagram showing the relationship of differentially expressed proteins between SA vs. WT and SAP vs. WT comparisons, with data from RPPA. two-sided Student’s t test was used to select significant proteins for each comparison (P < 0.05). c Normalized RPPA signals of selected proteins upregulated in both SA and SAP tumors compared with WT penises, with protein names and functions shown (n = 5, 8, and 4 for WT, SA and SAP, respectively). d Normalized RPPA signals of selected proteins downregulated in both SA and SAP tumors compared with WT penises (n = 5, 8, and 4 for WT, SA and SAP, respectively). e Normalized RPPA signals and ratios for phospho-Akt (S473) and total Akt in WT, SA and SAP penises (n = 5, 8 and 4 for WT, SA and SAP, respectively), validated by western blot of the tissues. f Dot plot comparing IC50 values of SA and SAP cell lines to 31 drugs, with three drugs highlighted. g, h Cell viability in vitro measured by MTT assay for indicated drugs, with IC50 noted (n = 5 for each concentration). i Western blot showing the upregulation of phospho-HER (Tyr1248 and Tyr1221) signaling in SAP tumors compared with SA tumors (n = 3 for each group). In ce, box plots visualize the five-number summary of a data set (minimum, lower quartile, median, upper quartile and maximum). In g, h, data represent mean ± SD. #P > 0.05, *P < 0.05, **P < 0.01, ***P < 0.001, two-sided Student’s t test.
Fig. 7
Fig. 7. Conserved gene expression pattern of human and mouse penile cancers.
a Conserved expression pattern of most up- and down-regulated genes in human penile cancer relative to normal human penis as compared with mouse penile cancer (SA, SAP) relative to normal mouse penis (n = 3, 3 and 2 for WT, SA and SAP, respectively). Human data were from GSE57955, n = 39 (12 are HPV+, 25 are HPV, 2 with unknown HPV status, all referenced to normal glan tissues). b Normalized RNA levels of representative upregulated genes in human and mouse PSCC. For human, HPV+ and HPV cases were plotted separately, but showed no statistically significant differences (n = 12 for human HPV+, 25 for human HPV, 3 for mouse SA, and 2 for mouse SAP). All data points are shown with the line representing the median. c IHC images of selected immune cell markers and signaling molecules in human penile tumors. In all cases, more than half of the eight cases were positive for the marker being stained (n = 8). Scale bar 100 μm.

References

    1. Clark PE, et al. Penile cancer: clinical practice guidelines in oncology. J. Natl Compr. Cancer Netw. 2013;11:594–615. doi: 10.6004/jnccn.2013.0075. - DOI - PMC - PubMed
    1. Daling JR, et al. Penile cancer: Importance of circumcision, human papillomavirus and smoking in in situ and invasive disease. Int. J. Cancer. 2005;116:606–616. doi: 10.1002/ijc.21009. - DOI - PubMed
    1. Olesen TB, et al. Prevalence of human papillomavirus DNA and p16INK4a in penile cancer and penile intraepithelial neoplasia: a systematic review and meta-analysis. Lancet Oncol. 2019;20:145–158. doi: 10.1016/S1470-2045(18)30682-X. - DOI - PubMed
    1. Ferrándiz-Pulido C, de Torres I, García-Patos V. Penile squamous cell carcinoma. Actas Dermo-Sifiliogr.áficas (Engl. Ed.) 2012;103:478–487. - PubMed
    1. Lont AP, et al. Presence of high-risk human papillomavirus DNA in penile carcinoma predicts favorable outcome in survival. Int. J. Cancer. 2006;119:1078–1081. doi: 10.1002/ijc.21961. - DOI - PubMed

Publication types

MeSH terms