. 2020 May 1;11(1):2142.
doi: 10.1038/s41467-020-16066-2.

Context specificity of the EMT transcriptional response

Affiliations

Context specificity of the EMT transcriptional response

David P Cook et al. Nat Commun. .

Abstract

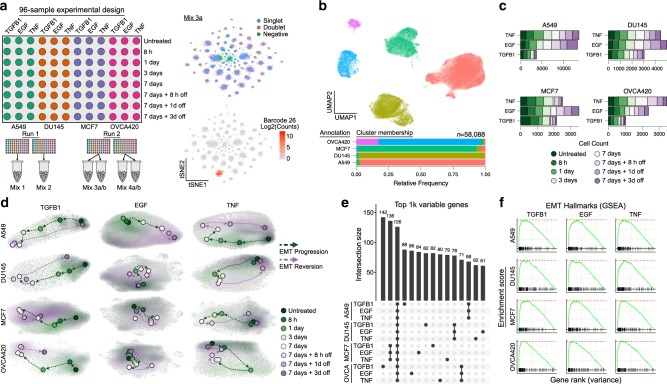
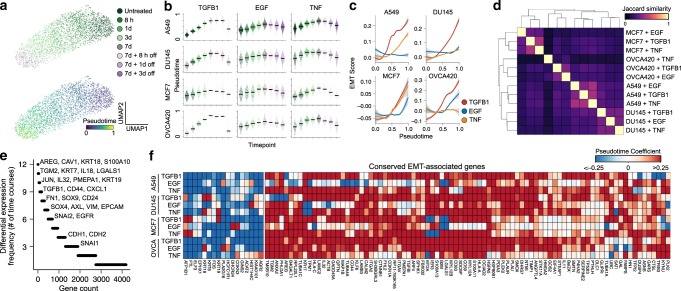
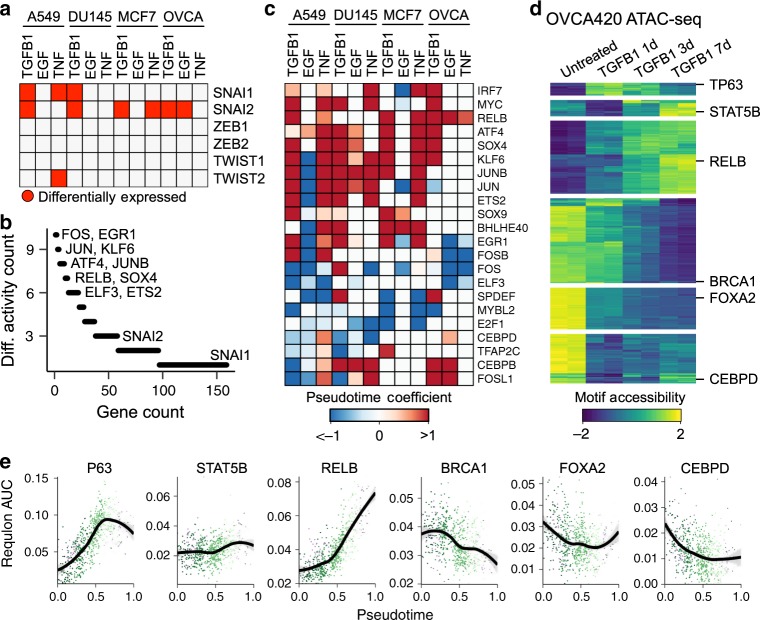
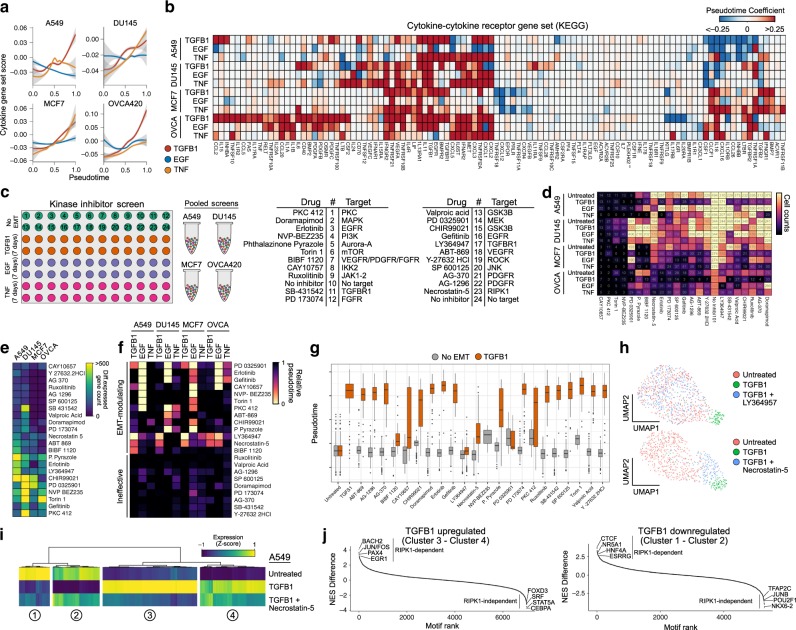
Epithelial-mesenchymal plasticity contributes to many biological processes, including tumor progression. Various epithelial-mesenchymal transition (EMT) responses have been reported and no common, EMT-defining gene expression program has been identified. Here, we have performed a comparative analysis of the EMT response, leveraging highly multiplexed single-cell RNA sequencing (scRNA-seq) to measure expression profiles of 103,999 cells from 960 samples, comprising 12 EMT time course experiments and independent kinase inhibitor screens for each. We demonstrate that the EMT is vastly context specific, with an average of only 22% of response genes being shared between any two conditions, and over half of all response genes were restricted to 1-2 time course experiments. Further, kinase inhibitor screens revealed signaling dependencies and modularity of these responses. These findings suggest that the EMT is not simply a single, linear process, but is highly variable and modular, warranting quantitative frameworks for understanding nuances of the transition.


Conflict of interest statement

The authors declare no competing interests.

Figures

Fig. 1
Fig. 1. Multiplexed scRNA-seq profiling of 12 EMT time course experiments.
a Schematic of the 96-well experimental design for the 12 EMT time course experiments (left), and t-SNE embeddings of the MULTI-seq barcode counts, demonstrating strong signal for demultiplexing (right). b UMAP embedding of aggregated expression data of all data, colored by unsupervised clustering (top), and a graph showing the relative proportion of annotations for each cell line assigned to each cluster after demultiplexing (bottom). c Graph showing the number of cells captured for each time course experiment. d UMAP embeddings of each of the 12 time course experiments. Grey dots correspond to individual cells, shaded regions represent the related sample density for each time point, and colored dots correspond to the maxima of the density function. e UpSet plot showing the intersections of the top 1000 variable genes of each time course experiment. f GSEA plots showing the NES for the EMT hallmark genes in the variance-ranked genes for all conditions.
Fig. 2
Fig. 2. EMT transcriptional responses are largely context specific.
a UMAP embeddings of A549 cells treated with TGFB1. Each point represents an individual cell, and colors correspond to time point (top) or pseudotime value (bottom). b Sina plot showing the distribution of pseudotime values across time points for all 12 time course experiments, with time points colored the same as in a. Horizontal black bars represent mean expression values for each group and each point corresponds to a single cell. c Smoothed model of the EMT hallmark gene set score throughout the pseudotime. Shaded bands for each line correspond to the standard error for each model. d Clustered heatmap of all pairwise Jaccard similarity values for the differentially expressed genes in each condition. e Counts of how frequently each gene is differentially expressed among time course experiments. f Heatmap showing EMT-associated expression changes associated with a gene set of all genes that are differentially expressed in at least eight time course experiments. The colormap corresponds to the pseudotime beta coefficient of the linear model for each gene.
Fig. 3
Fig. 3. Inferring transcription factor activity throughout the EMT.
a Plot showing in which time course experiments various canonical EMT transcription factors are differentially expressed. b Counts of how frequently various transcription factors and their associated regulons are differentially active among time course experiments. c Heatmap showing EMT-associated changes of regulons that are differentially active in at least six time course experiments. The colormap corresponds to the pseudotime beta coefficient of a linear model for each regulon. d Differential accessibility of transcription factor motifs from ATAC-seq data of OVCA420 cells treated with TGFB1 for 0, 1, 3, or 7 days. The colormap represents the accessibility Z-score for each transcription factor motif. Examples of transcription factors from each cluster are listed. e Regulon activity score of the same transcription factors listed in d inferred from the OVCA420 TGFB1 time course experiment. Each dot represents a single cell, colored by time point. The black line corresponds to the modeled trend from a generalized additive model. Shaded bands for each line correspond to the standard error for each model.
Fig. 4
Fig. 4. Kinase inhibitor screens identify signaling dependencies of the EMT.
a Gene set score of the KEGG pathway “cytokine–cytokine receptor interaction” over pseudotime for each time course experiment. Shaded bands for each line correspond to the standard error for each model. b Heatmap showing EMT-associated changes of the individual genes of the same gene set as in a, only listing those with a significant change in at least one time course experiment. c Schematic of the 384-sample experimental design for the kinase inhibitor screen. d Heatmap showing the number of cells annotated to each condition after demultiplexing the scRNA-seq data. e Summary of the number of genes that are differentially expressed in each cell line exposed to the inhibitors without EMT induction. f Average pseudotime values calculated for each condition. g Boxplots showing the distribution of pseudotime values for A549 cells treated with the inhibitors alone (grey) or in combination with TGFB1 (orange). The horizontal black line of the boxplot represents the median value, the box spans the 25th and 75th percentiles, and whiskers correspond to 1.5 times the interquartile range. h UMAP embeddings of untreated A549 cells with those had been treated with TGFB1 alone or in combination with the TGFBR1 inhibitor LY364947 (top), or the RIPK1 inhibitor necrostatin-5 (bottom). i Heatmap showing expression (Z-score) of genes differentially expressed in A549 cells by TGFB1 in untreated A549 cells, as well as those treated with TGFB1 alone or in combination with necrostatin-5. j Difference in normalized enrichment scores for transcription factor targets in genes that are successfully inhibited by necrostatin-5 compared to those that are not. Positive values correspond to regulons with that are enriched in necrostatin-5-inhibited genes, whereas negative values represent those are not affected by necrostatin-5.

References

    1. Nieto MA, Huang RY-J, Jackson RA, Thiery JP. EMT: 2016. Cell. 2016;166:21–45. doi: 10.1016/j.cell.2016.06.028. - DOI - PubMed
    1. Derynck R, Weinberg RA. EMT and cancer: more than meets the eye. Dev. Cell. 2019;49:313–316. doi: 10.1016/j.devcel.2019.04.026. - DOI - PMC - PubMed
    1. Kröger C, et al. Acquisition of a hybrid E/M state is essential for tumorigenicity of basal breast cancer cells. Proc. Natl Acad. Sci. USA. 2019;116:7353–7362. doi: 10.1073/pnas.1812876116. - DOI - PMC - PubMed
    1. Bocci F, Jolly MK, George JT, Levine H, Onuchic JN. A mechanism-based computational model to capture the interconnections among epithelial-mesenchymal transition, cancer stem cells and Notch-Jagged signaling. Oncotarget. 2018;9:29906–29920. doi: 10.18632/oncotarget.25692. - DOI - PMC - PubMed
    1. Lecharpentier A, et al. Detection of circulating tumour cells with a hybrid (epithelial/mesenchymal) phenotype in patients with metastatic non-small cell lung cancer. Br. J. Cancer. 2011;105:1338–1341. doi: 10.1038/bjc.2011.405. - DOI - PMC - PubMed

Publication types

MeSH terms

Grants and funding