. 2020 May 1;11(1):2157.
doi: 10.1038/s41467-020-15680-4.

Observation of the molecular response to light upon photoexcitation

Affiliations

Observation of the molecular response to light upon photoexcitation

Haiwang Yong et al. Nat Commun. .

Abstract

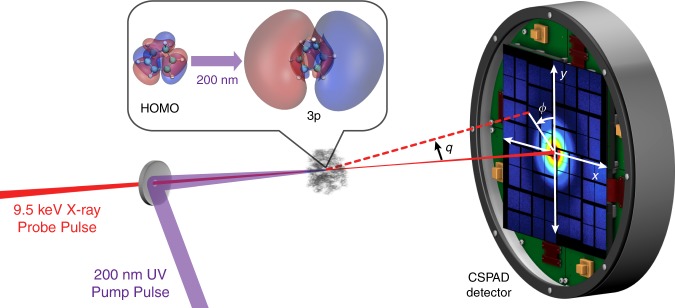
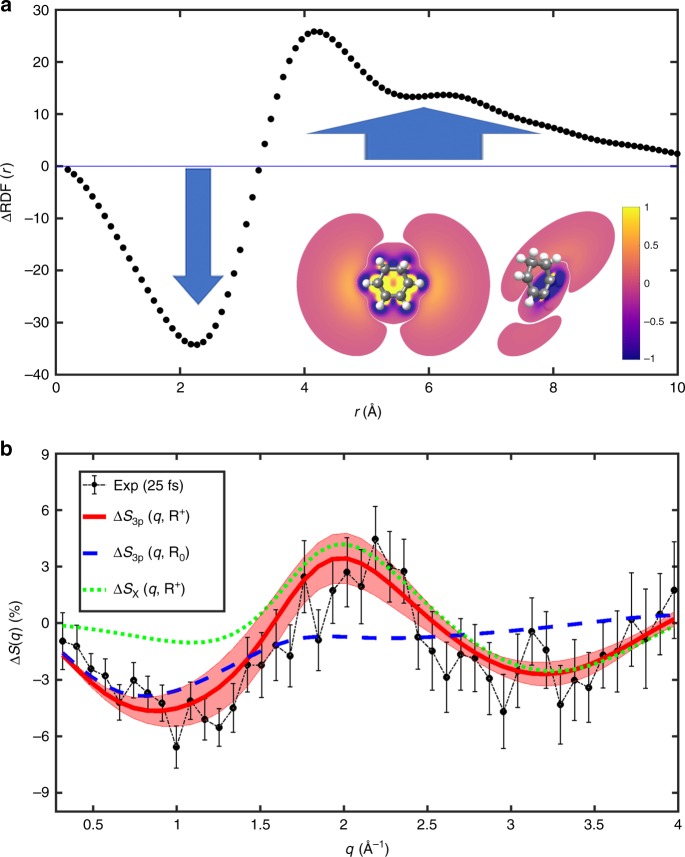
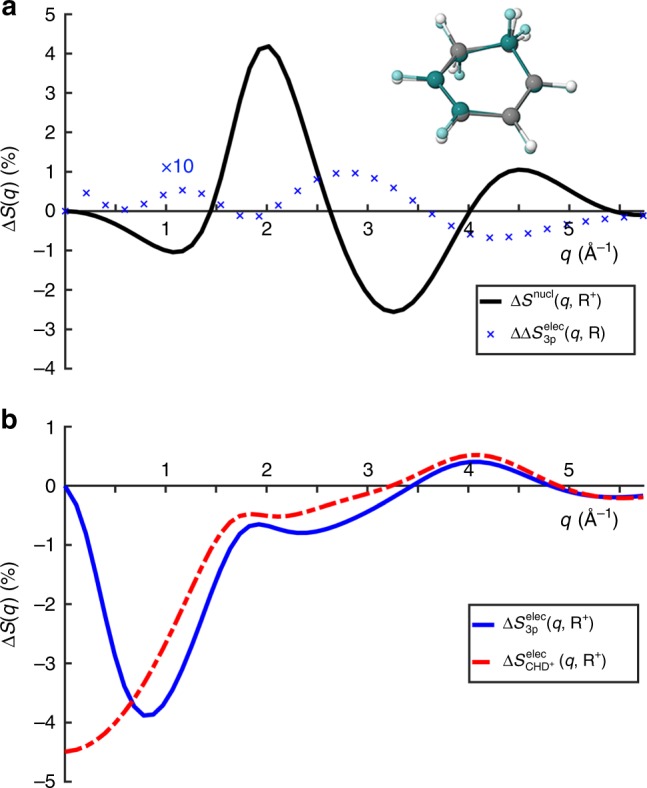
When a molecule interacts with light, its electrons can absorb energy from the electromagnetic field by rapidly rearranging their positions. This constitutes the first step of photochemical and photophysical processes that include primary events in human vision and photosynthesis. Here, we report the direct measurement of the initial redistribution of electron density when the molecule 1,3-cyclohexadiene (CHD) is optically excited. Our experiments exploit the intense, ultrashort hard x-ray pulses of the Linac Coherent Light Source (LCLS) to map the change in electron density using ultrafast x-ray scattering. The nature of the excited electronic state is identified with excellent spatial resolution and in good agreement with theoretical predictions. The excited state electron density distributions are thus amenable to direct experimental observation.


Conflict of interest statement

The authors declare no competing interests.

Figures

Fig. 1
Fig. 1. A schematic of the experimental set-up.
The CHD molecules are excited by a 200 nm UV pump pulse and the molecules are probed by 9.5 keV x-ray pulses with a variable time delay. The scattering signals are recorded on a CSPAD detector. The insert shows the highest occupied molecular orbital (HOMO), which has π character, and the excited 3p molecular orbital. Both orbitals are rendered at 5% of maximum ISO values at the ground-state molecular geometry.
Fig. 2
Fig. 2. Experimental and theoretical signals.
a The real-space difference radial distribution function, ΔRDF(r), obtained from the experimental data at 25 fs pump–probe delay time. The blue arrows point to the depletion and increase in electron density at short and long electron distances, respectively, as the molecule is excited from the tightly bound ground electronic state to the diffuse excited 3p state. The insert shows the corresponding contour slices of the electron density difference from electronic structure calculations. The left-hand slice shows the difference in a plane through the C=C-C=C atoms, which illustrates the density gains far from the molecule, while the perpendicular right-hand slice, taken through one of the C=C bonds, shows the corresponding loss of density in the HOMO π-orbital. The color intensity is renormalized between −1 and 1 and absolute values <0.01 are not shown. b Fractional difference signals, ΔS(q), shown in percent. The experimental signal at 25 fs delay time is shown in black with 1σ error bars. The corresponding theoretical ΔS3p(q,R+) signal for the electronic 3p state is shown in red with the shaded region accounting for the sampling of geometries in the excited state. For comparison, theoretical signals for the ground electronic state (X) at the 3p geometry, ΔSX(q,R+), and for the excited 3p state at equilibrium geometry, ΔS3p(q,R0), are included.
Fig. 3
Fig. 3. Separation of nuclear and electronic contributions.
Calculated fractional difference signals for the molecule CHD, assuming 100% excitation. a The nuclear contribution, ΔSnucl(q,R+), associated with the change in molecular geometry, R0R+, upon excitation (in black) and the small difference due to electronic effects, ΔΔS3pelec(q,R)=ΔS3pelec(q,R+)ΔS3pelec(q,R0) shown at ×10 magnification (in blue). The insert shows an overlap of the molecule in the excited state 3p geometry (R+, gray) and the ground-state equilibrium geometry (R0, dark green). b The electronic contribution for the 3p state, ΔS3pelec(q,R+), and for the molecular positive ion, ΔSCHD+elec(q,R+). Note that only the result for the 3px state is shown since the 3px and 3py states have nearly identical signals.

References

    1. Zhang W, et al. Tracking excited-state charge and spin dynamics in iron coordination complexes. Nature. 2014;509:345–348. doi: 10.1038/nature13252. - DOI - PMC - PubMed
    1. Minitti MP, et al. Imaging molecular motion: femtosecond x-ray scattering of an electrocyclic chemical reaction. Phys. Rev. Lett. 2015;114:255501. doi: 10.1103/PhysRevLett.114.255501. - DOI - PubMed
    1. Kim KH, et al. Direct observation of bond formation in solution with femtosecond X-ray scattering. Nature. 2015;518:385–389. doi: 10.1038/nature14163. - DOI - PubMed
    1. Wernet P, et al. Orbital-specific mapping of the ligand exchange dynamics of Fe(CO)5 in solution. Nature. 2015;520:78–81. doi: 10.1038/nature14296. - DOI - PubMed
    1. Pande K, et al. Femtosecond structural dynamics drives the trans/cis isomerization in photoactive yellow protein. Science. 2016;352:725–729. doi: 10.1126/science.aad5081. - DOI - PMC - PubMed

Publication types