. 2020 May 1;11(1):2123.
doi: 10.1038/s41467-020-15915-4.

Lipid metabolism adaptations are reduced in human compared to murine Schwann cells following injury

Affiliations

Lipid metabolism adaptations are reduced in human compared to murine Schwann cells following injury

Sofia Meyer Zu Reckendorf et al. Nat Commun. .

Abstract

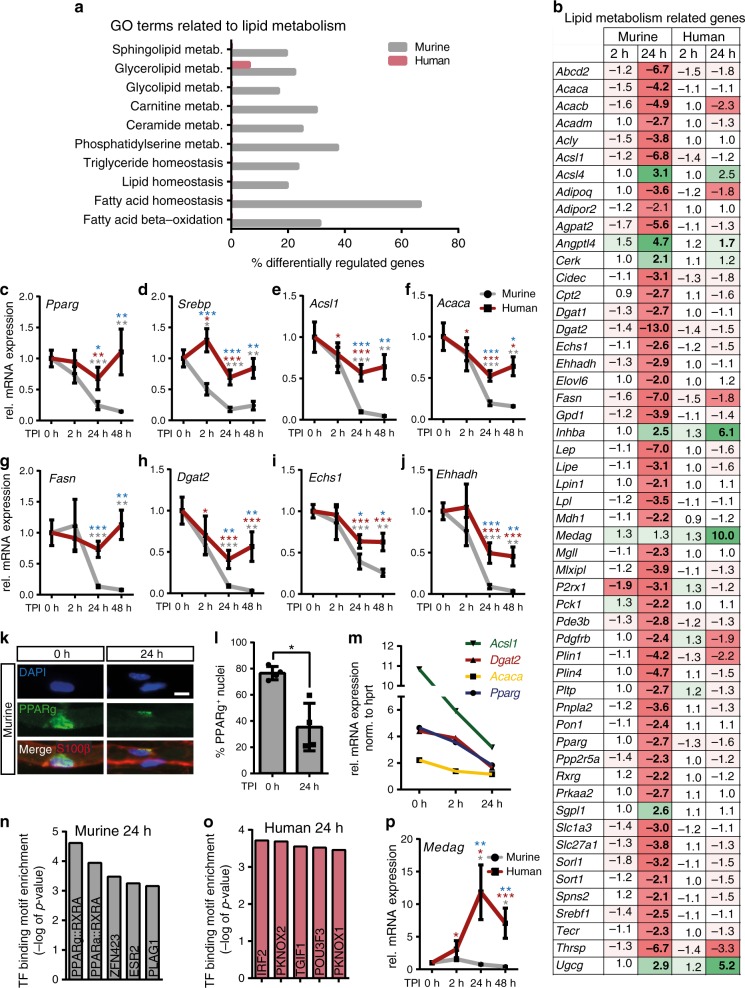
Mammals differ in their regeneration potential after traumatic injury, which might be caused by species-specific regeneration programs. Here, we compared murine and human Schwann cell (SC) response to injury and developed an ex vivo injury model employing surgery-derived human sural nerves. Transcriptomic and lipid metabolism analysis of murine SCs following injury of sural nerves revealed down-regulation of lipogenic genes and regulator of lipid metabolism, including Pparg (peroxisome proliferator-activated receptor gamma) and S1P (sphingosine-1-phosphate). Human SCs failed to induce similar adaptations following ex vivo nerve injury. Pharmacological PPARg and S1P stimulation in mice resulted in up-regulation of lipid gene expression, suggesting a role in SCs switching towards a myelinating state. Altogether, our results suggest that murine SC switching towards a repair state is accompanied by transcriptome and lipidome adaptations, which are reduced in humans.


Conflict of interest statement

The authors declare no competing interests.

Figures

Fig. 1
Fig. 1. Histological analysis of murine and human nerve explants.
a Experimental setup. TPI timepoint post injury, EM electron microscopy. b Age and sex distribution of patients. Red and black dots represent female and male patients respectively (n = 40 patients; 22 males, 18 females). Box shows 25th to 75th percentiles and median patient age (yellow line), whiskers show min (18 years) to max (72 years). cn Murine (ch) or human (in) nerves stained for axons (βIIITUB) and SCs (S100β) before or 48 h after injury. Inserts in d, g, j, m show higher magnifications. Arrows indicate SCs with round morphology, arrowheads point at SCs with distorted morphology. ot EM pictures of murine (oq) or human (rt) nerves. Arrows (p, q, s, t) show degenerated myelin, arrowheads (q, t) demyelinated axons. u, v Quantification of axon numbers in murine (u) or human (v) nerves at different time points. (at 0 h, 2 h, 24 h, 48 h n = 10, 10, 9 and 7 biological replicates for murine and n = 31, 26, 19 and 13 for human samples respectively). w, x Quantification of SC numbers in murine (w) or human (x) nerves at different time points. (at 0 h, 2 h, 24 h and 48 h, n = 12, 9, 10 and 7 biological replicates for murine and n = 23, 19, 15 and 13 for human samples respectively). Each circle represents a single nerve sample. All error bars show SD. Two-sided Mann–Whitney test was used to calculate statistical significance (*P < 0.05, **P < 0.005, ***P < 0.001). y Quantification of intact or degenerated myelin sheaths of EM pictures of human and murine nerves as indicated. Numbers indicate independent biological replicates analysed. Two-sided T-test was used to calculate statistical significance (P value 24 h = 0.0004, P value 48 h = 0.0024). All bars show mean with SD. Statistical significance is shown by asterisks (*P < 0.05, **P < 0.005, ***P < 0.001). Scale bar in c is 50 µm and applies for cn. Scale bar in o is 10 µm and applies for ot. Source data (uy) are provided as a Source Data file.
Fig. 2
Fig. 2. Altered gene expression profile in human and murine Schwann cells (SCs) upon injury.
qPCR analysis in human (red line) and murine (grey line) nerve explants at different time point after injury for genes typically expressed in differentiated (ad) or repair SCs (eh). Expression at 0 h was set to one and the fold change was calculated for the time points post injury (TPI). Graphs show for each time point mean with SEM. Two-sided Mann–Whitney test was used to calculate statistical significance (*P < 0.05, **P < 0.005, ***P < 0.001). Grey or red asterisks indicate significance compared to 0 h time point for murine or human samples respectively. Blue asterisks indicate significant differences between mouse and human for the particular time point. Biological replicates: n at 0 h, 2 h, 24 h and 48 h was 7, 7, 7 and 4 for murine nerves respectively, 26, 26, 25 and 14 for human nerves in a, b, e and f, and 17, 17, 17, 11 in c, d, g and h. Source data are provided as a Source Data file.
Fig. 3
Fig. 3. Transcriptomic analysis of human vs. murine nerve explants.
a, b Volcano plots of differentially regulated genes in human (a) or murine nerves (b) 2 h upon injury compared to uninjured nerves. Blue numbers indicate the number of more than two-fold down (left side) or up (right side) regulated genes. c Fold change expression of selected IEGs in murine/human nerve explants at 2 h and 24 h after injury compared to 0 h. d, e Volcano plots of differentially regulated genes in human (d) or murine nerves (e) 24 h upon injury compared to uninjured nerves. f GO (Gene ontology) terms related to immune responses were significantly altered in human and murine nerves 24 h upon injury. Source data are provided as a Source Data file. g Fold change expression of selected inflammation-related genes in murine/human nerves at 2 h and 24 h after injury compared to 0 h. Fold change in c and g was calculated from the mean normalised intensities irrespective of significance. Significantly changed values are depicted in bold. h, i TF binding motif enrichment analysis for genes significantly up-regulated at least threefold in murine nerves 2 h and 24 h (h) and for human nerves 24 h (i) after injury. P-values were calculated by Pscan Ver. 1.5 software using a two-tailed Z-test.Analysed biological replicates in ai: human n = 5, murine n = 3 for each time point.
Fig. 4
Fig. 4. Down-regulation of lipid metabolism in injured murine but not human nerves.
a Alterations in GO (Gene Ontology) terms in murine/human nerves 24 h upon injury. b Fold change expression of lipid metabolism related genes in murine/human nerves after injury compared to 0 h. Significantly changed values are depicted in bold. cj qPCR validation of selected lipogenic genes at different time points post injury (TPI). Bars show mean with SEM. Grey or red asterisks indicate significance compared to 0 h time point for murine or human samples respectively. Blue asterisks indicate significant differences between mouse and human for the particular time point. k, l Down-regulation of PPARg+ in SCs of teased nerve fibres. Scale bar is 10 µm. Bars in l show mean with SD (P = 0.0286). m qPCR of selected lipogenic genes in nerves injured in vivo. Graph shows mean with SEM for each time point. n, o Transcription factor (TF) binding motif analysis for genes significantly down-regulated at least threefold in murine (n) or human (o) nerves 24 h after injury. P-values were calculated by Pscan Ver. 1.5 software using a two-tailed Z-test. p qPCR validation of expression of the gene Medag in human/murine nerves at different time points post injury. Analysed biological replicates: for (a, b, no) human n = 5, murine n = 3 for each time point, for (ch) n = 15, 15, 15 and 12 for human and 10, 10, 10 and 4 for mouse at 0 h, 2 h, 24 h and 48 h respectively, for (i, j, p) n = 7, 7, 7 and 7 for human and 10, 10, 10 and 4 for mouse at 0 h, 2 h, 24 h and 48 h respectively, for l n = 4 for each time point, for m n = 9, 3 and 3 at 0 h, 2 h and 24 h respectively. Two-sided Mann–Whitney test was used to calculate statistical significance (*P < 0.05, **P < 0.005, ***P < 0.001). Source data are provided as a Source Data file.
Fig. 5
Fig. 5. Lipidomic analysis in human and murine injured nerves.
a Heatmap of all analysed lipids in human (h) and murine (m) nerves without (0 h) or 24 h after injury. Significantly changed lipids at 24 h are indicated in bold and separately depicted in b. b Relative lipid level for all significantly changed lipids upon injury in human or murine nerves. For each lipid the mean level of all human or murine samples at 0 h was set to 100% and the change was calculated at 24 h after injury. n = 5 biological replicates for each time point for human and murine samples. Each dot represents a single murine or human sample analysed. Bars show mean with SD. Source data are provided as a Source Data file.
Fig. 6
Fig. 6. S1P/PPARg dependent regulation of lipid metabolism and SC reprogramming in mice.
a, b qPCR analysis of genes involved in lipid metabolism in control or injured murine nerves treated with 4-deoxypyridoxine (DOP; a) or pioglitazone (PIO; b). Expression at 0 h was set to one and the fold change was calculated for the other time points. Biological replicates analysed: n = 9 and n = 4 for each condition for (a) and (b) respectively. ch qPCR analysis of the marker genes for repair SCs Shh and Gdnf and the myelin gene Mbp in control or injured murine nerves treated with DOP (ce) or PIO (fh). Expression at 0 h was set to one and the fold change was calculated for the other time points. Biological replicates analysed: n = 9 for ce and n = 4 for fh for each condition. ik Histological analysis of cJUN protein expression (i), MBP (j) and βIII tubulin+ axons (k) in murine nerves without injury (0 h) or 48 h after injury with control (w/o PIO) or with pioglitazone (+ PIO) treatment. Scale is 25 µm. l Quantification of cJUN+ cells per nerve area. Biological replicates: n = 9, 7 and 4 for 0 h, 48 h and 48 h + PIO. m Quantification of MBP+ area per nerve area. Biological replicates: n = 7, 7 and 4 for 0 h, 48 h and 48 h + PIO. n Quantification of the relative βIIITUB+ area per nerve area. Time point 0 h was set to 100%. Biological replicates: n = 7, 7 and 4 for 0 h, 48 h and 48 h + PIO. Each dot represents a single mouse nerve. Bars in all graphs show mean with SD. Two-sided Mann–Whitney test was used to calculate statistical significance (*P < 0.05, **P < 0.005, ***P < 0.001). Source data for ah, lm are provided as a Source Data file.
Fig. 7
Fig. 7. Human SCs are responsive to pharmacological PPARg modulation.
a qPCR analysis of genes involved in lipid metabolism in control or injured human nerves treated with pioglitazone (PIO). Expression at 0 h was set to one and the fold change was calculated for the other time points. Numbers in bars indicate independent samples analysed. P value for 48 h vs. 48 h + PIO = 0.0043 each for Pparg, Acaca, Fasn and Dgat2. bd Histological analysis of cJUN protein expression (b), MBP+ area (c) and βIIITUB+ axons (d) in human nerves without injury (0 h) or 48 h after injury with control (w/o PIO) or with pioglitazone (+ PIO) treatment. Scale: 25 µm. eg Quantification of cJUN+ cells per nerve area (e), MBP+ area per nerve area (f) and relative βIIITUB+ area per nerve area (g). Time point 0 h was set to 100% for (g). h qPCR analysis of genes involved in lipid metabolism in control or injured human nerves treated with the PPARg antagonists SR16832 (SR) and GW9662 (GW). Expression at 0 h was set to one and the fold change was calculated for the other time points. Numbers in bars indicate independent samples analysed (n.a., not available). Each dot or circle represents a single human nerve analysed. Biological replicates analysed: for a n = 6, 6 and 5 for 0 h, 48 h and 48 h + PIO respectively, for eg n = 3 for each condition, for h n = 6, 6, 3 and 3, 0 h, 48 h, 48 h + GW and 48 h + SR respectively. Bars in all graphs show mean with SD. Two-sided Mann–Whitney test was used to calculate statistical significance (*P < 0.05, **P < 0.005, ***P < 0.001). Source data for a, eh are provided as a Source Data file.
Fig. 8
Fig. 8. Proposed mechanism for lipid metabolism regulation in SCs upon injury.
a After injury, SCs switch from a myelinating (dark green) to a repair (light green) phenotype. In human SCs (red area), induction of the repair SC phenotype is decreased or at least delayed, which might lead to impaired regeneration and delayed re-differentiation compared to murine SCs (grey area). b In murine repair SCs, PPARg expression is down-regulated after injury. In addition, intracellular S1P is decreased which might involve enhanced enzymatic degradation to PE and HD by the enzyme SGPL1. Both, decreased PPARg and S1P levels result in blunted PPARg activity, which in turn leads to decreased expression of lipid metabolism associated genes. Pharmacological repression of PPARg activity in human SCs by SR and GW decreased lipogenic gene transcription. c Later during regeneration SCs re-differentiate into myelinating SCs. In this case PPARg expression and S1P levels have to be raised again, thereby enhancing PPARg activity and lipogenic gene expression. Pharmacological elevation of S1P by DOP-, THI-, C31-mediated SGPL1 inhibition, as well as PIO-mediated PPARg activation were able elevate lipogenic gene transcription and led to suppression of the repair SC phenotype. C31 (compound 31), DOP (4-deoxypyridoxine), GW (GW9662), HD (hexadecanal), PE (phosphoethanolamine), PIO (pioglitazone), PPARg (peroxisome proliferator-activated receptor gamma), S1P (sphingosine-1 phosphate), SC (Schwann cells), SGPL1 (sphingosine-1 phosphate lyase 1), SR (SR16832) and THI (2-acetyl-5-tetrahydroxybutyl imidazole).

References

    1. Kouyoumdjian JA, Graça CR, Ferreira VFM. Peripheral nerve injuries: A retrospective survey of 1124 cases. Neurol. India. 2017;65:551. doi: 10.4103/neuroindia.NI_987_16. - DOI - PubMed
    1. López-Cebral R, Silva-Correia J, Reis RL, Silva TH, Oliveira JM. Peripheral nerve injury: current challenges, conventional treatment approaches, and new trends in biomaterials-based regenerative strategies. ACS Biomater. Sci. Eng. 2017;3:3098–3122. doi: 10.1021/acsbiomaterials.7b00655. - DOI - PubMed
    1. Palispis WA, Gupta R. Surgical repair in humans after traumatic nerve injury provides limited functional neural regeneration in adults. Exp. Neurol. 2017;290:106–114. doi: 10.1016/j.expneurol.2017.01.009. - DOI - PubMed
    1. Arthur-Farraj PJ, et al. c-Jun reprograms schwann cells of injured nerves to generate a repair cell essential for regeneration. Neuron. 2012;75:633–647. doi: 10.1016/j.neuron.2012.06.021. - DOI - PMC - PubMed
    1. Jessen KR, Mirsky R. The repair Schwann cell and its function in regenerating nerves. J. Physiol. 2016;594:3521–3531. doi: 10.1113/JP270874. - DOI - PMC - PubMed

Publication types

MeSH terms