. 2020 May 1;11(1):2177.
doi: 10.1038/s41467-020-15770-3.

Midkine activation of CD8+ T cells establishes a neuron-immune-cancer axis responsible for low-grade glioma growth

Affiliations

Midkine activation of CD8+ T cells establishes a neuron-immune-cancer axis responsible for low-grade glioma growth

Xiaofan Guo et al. Nat Commun. .

Abstract

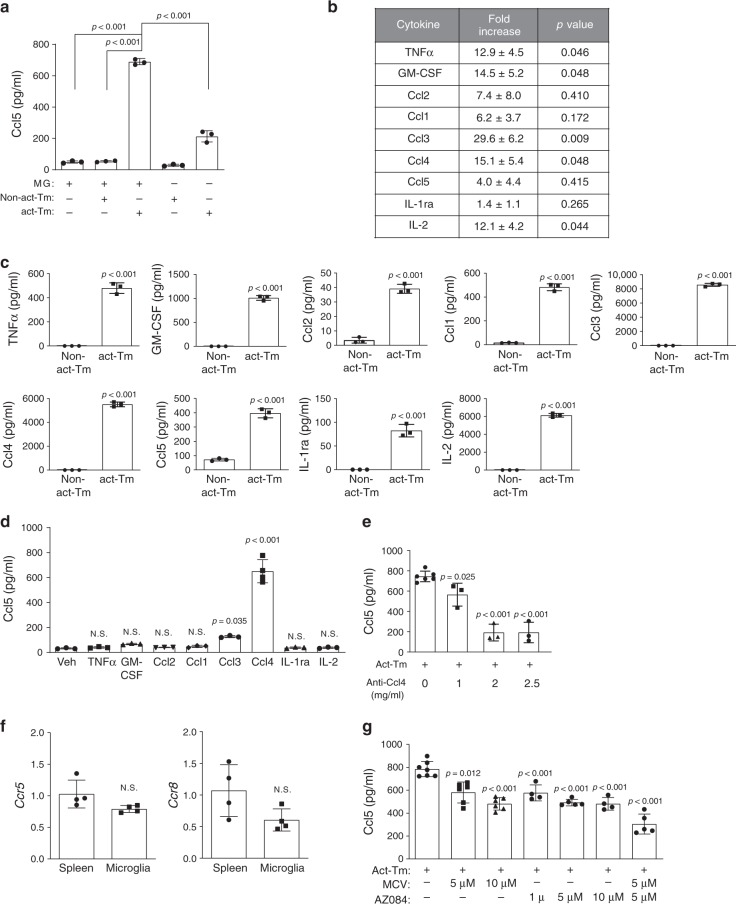
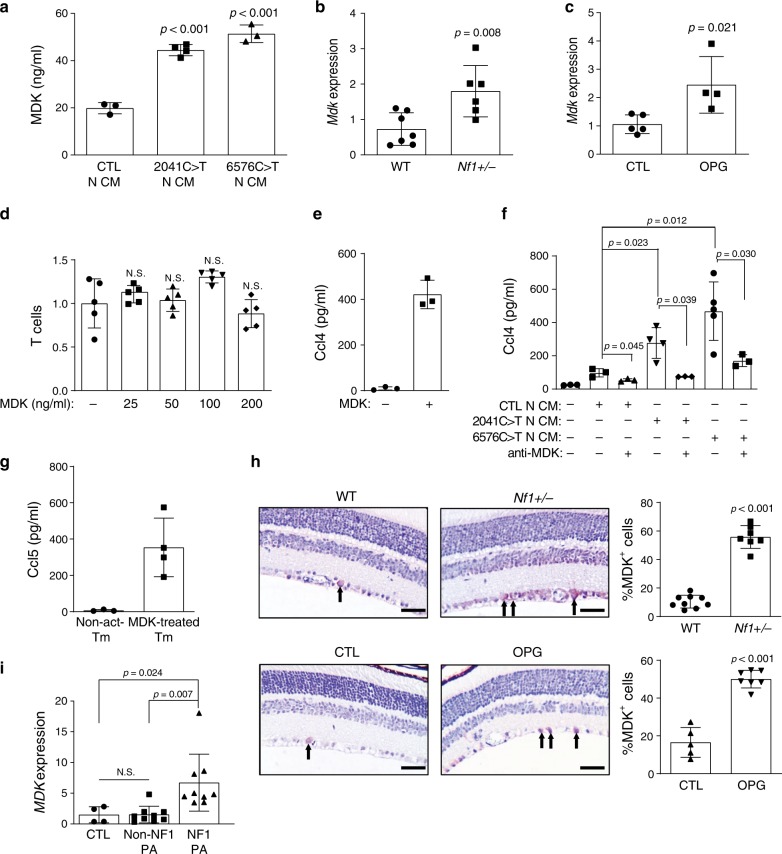
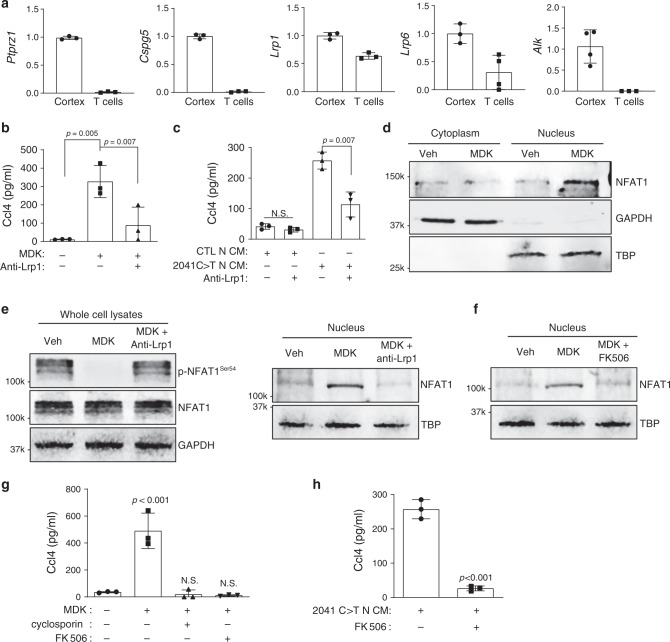
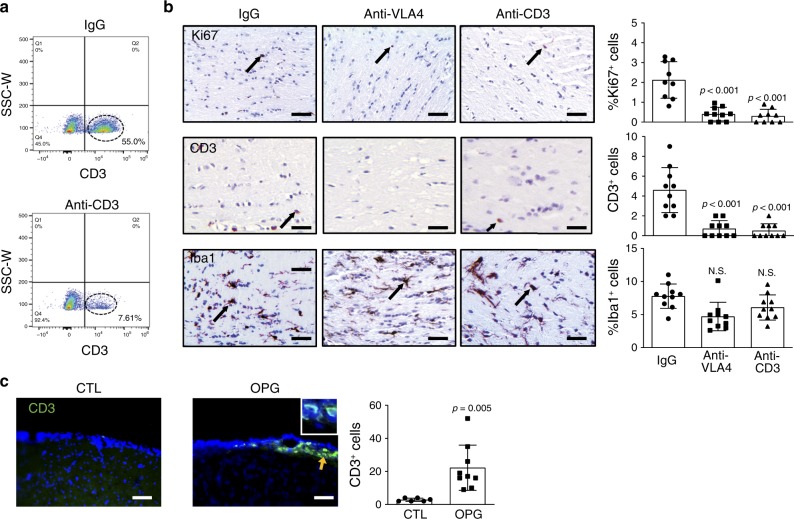
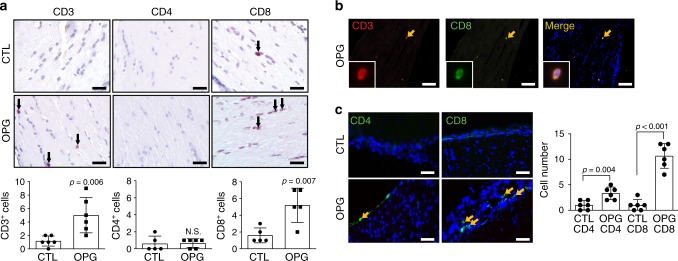
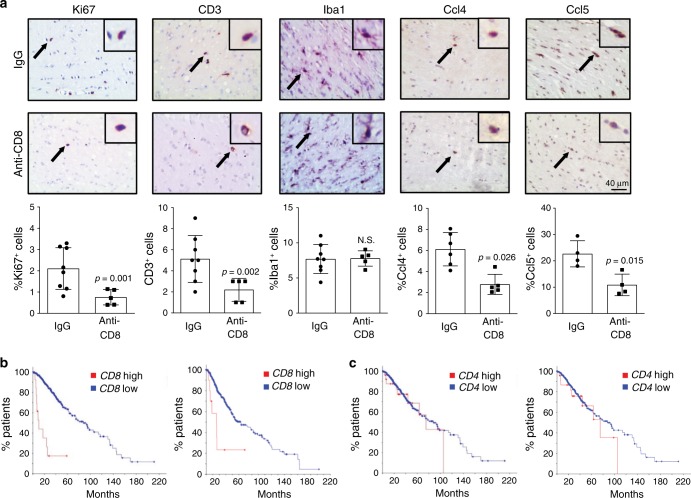
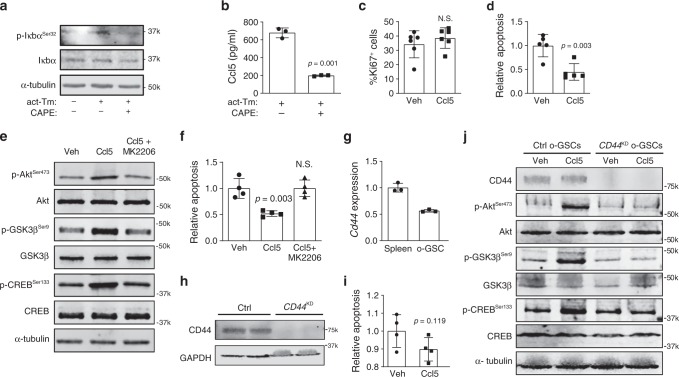
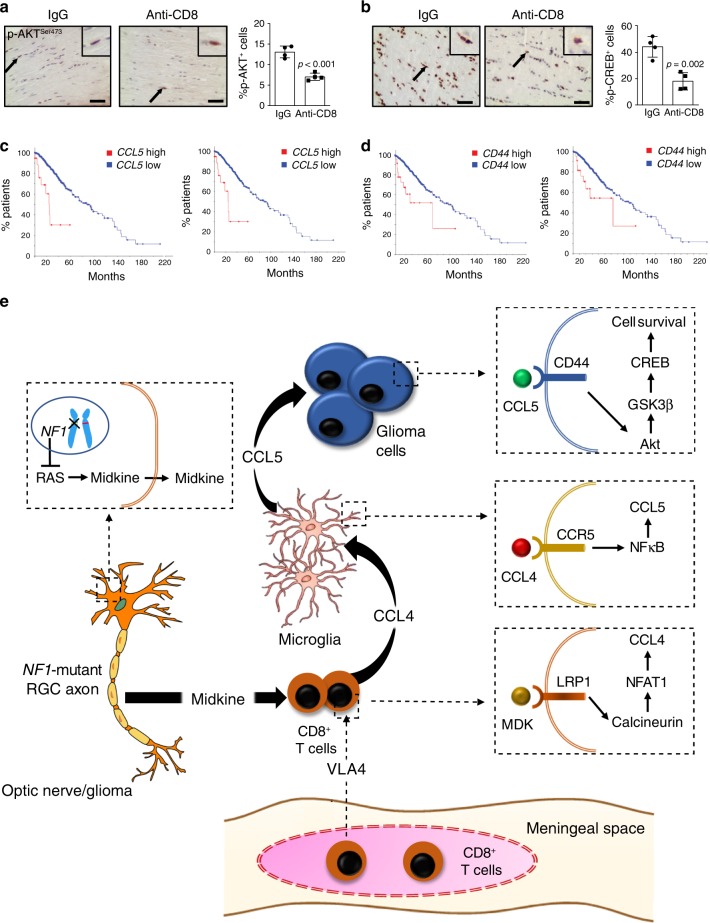
Brain tumors (gliomas) are heterogeneous cellular ecosystems, where non-neoplastic monocytic cells have emerged as key regulators of tumor maintenance and progression. However, relative to macrophages/microglia, comparatively less is known about the roles of neurons and T cells in glioma pathobiology. Herein, we leverage genetically engineered mouse models and human biospecimens to define the axis in which neurons, T cells, and microglia interact to govern Neurofibromatosis-1 (NF1) low-grade glioma (LGG) growth. NF1-mutant human and mouse brain neurons elaborate midkine to activate naïve CD8+ T cells to produce Ccl4, which induces microglia to produce a key LGG growth factor (Ccl5) critical for LGG stem cell survival. Importantly, increased CCL5 expression is associated with reduced survival in patients with LGG. The elucidation of the critical intercellular dependencies that constitute the LGG neuroimmune axis provides insights into the role of neurons and immune cells in controlling glioma growth, relevant to future therapeutic targeting.


Conflict of interest statement

The authors declare no competing interests.

Figures

Fig. 1
Fig. 1. Activated T cells secrete Ccl4 and prime microglia to produce Ccl5.
a Activated T cell conditioned medium (act-Tm CM) treatment stimulated WT microglia (MG) to produce a higher level of Ccl5 (ELISA) compared to non-activated T cell-conditioned medium (non-act-Tm CM). Non-activated and activated T cell CM, and CM collected from microglia alone served as controls for these experiments. b WT T cells isolated from the mouse spleen were seeded at the concentration of 2.5 × 106 cells ml−1 in complete PRIM1640 medium followed by 2 days of CD3/CD28 stimulation (activated; act-Tm) or vehicle (PBS) treatment (non-activated; non-act-Tm). CM was collected for chemokine array triplicates. Increased levels of TNF-α, GM-CSF, Ccl2, Ccl1, Ccl3, Ccl4, Ccl5, Il-1ra, and Il-2 expression were observed in activated T cell CM relative to non-activated T cell CM. The fold increases and P values relative to control groups for all three replicates (Supplementary Fig. 1a) are collated in the table. c ELISA assays reveal increased levels of TNFα, GM-CSF, Ccl2, Ccl1, Ccl3, Ccl4, Ccl5, Il-1ra, and Il-2 in the CM of activated, relative to non-activated, T cells. d WT microglia were stimulated with these differentially expressed cytokines [TNF-α (400 pg ml−1), GM-CSF (1000 pg ml−1), Ccl2 (80 pg ml−1), Ccl1 (500 pg ml−1), Ccl3 (8000 pg ml−1), Ccl4 (6000 pg ml−1), Il-1ra (80 pg ml−1), and Il-2 (6000 pg ml−1)] for 24 h at the concentrations detected in the activated T cell CM. Ccl5 production by microglia was increased following Ccl4 (6000 pg ml−1) treatment. Veh: vehicle. e Ccl5 ELISA revealed that activated T cell CM induction of microglial Ccl5 production was reduced following treatment with increasing concentrations of Ccl4 neutralizing antibody. f Microglial Ccr5 and Ccr8 expression was validated using spleen as a positive control. g Increasing concentrations of maraviroc (MCV, Ccr5 receptor inhibitor) and AZ084 (Ccr8 receptor inhibitor) reduced T cell induction of microglial Ccl5 expression. The combination of MCV and AZ084 exhibited the greatest inhibition of microglial Ccl5 expression. All data are presented as the mean ± SEM. a This representative experiment was conducted with n = 3 independent biological samples, and was replicated two additional times with similar results. b n = 3 independent biological samples were examined over three independent experiments, as illustrated in Fig. S1a. c and d Bar graphs represent the means ± SEM of n = 3 independent biological samples. e This representative experiment was conducted with 0 mg ml−1 anti-Ccl4, n = 6; 1, 2, 2.5 mg ml−1 anti-Ccl4, n = 3, independent biological samples, and was replicated two additional times with similar results. f Bar graphs represent the means ± SEM of n = 4 independent biological samples. g This representative experiment was conducted with (from left to right) n = 7, n = 6, n = 6, n = 4, n = 5, n = 4, and n = 5 independent biological samples, and was replicated two additional times with similar results. a, d, e, g One-way ANOVA with Bonferroni post-test correction; b, c, f Two-tailed Student’s t-test. Exact P values are indicated within each panel; N.S.; not significant. From left to right in each panel: a all P < 0.001, c all P < 0.001, d N.S., N.S., N.S., N.S., P = 0.035, P < 0.001, N.S., N.S.; e P = 0.025, P < 0.001, P < 0.001; f N.S.; g P = 0.012, P < 0.001, P < 0.001, P < 0.001, P < 0.001, P < 0.001.
Fig. 2
Fig. 2. NF1-mutant neurons express MDK, which activates T cells to produce Ccl4.
a Isogenic hiPSC-induced neurons with heterozygous NF1 patient NF1 gene mutations (2041C>T and 6576C>T) produced higher levels of midkine in the neuron conditioned medium (N-CM) compared to WT (CTL) hiPSC-induced neurons. b Mdk gene expression was higher in the optic nerves of Nf1+/− relative to WT mice. c Increased Mdk expression was observed in optic glioma (OPG)-containing relative to control (CTL) optic nerves. d No change in T cell migration was observed in response to various MDK concentrations. e MDK (50 ng ml−1) stimulation for 48 h increased T cell Ccl4 production. f CM from isogenic hiPSC-induced neurons with NF1 patient NF1 gene mutations (c.2041C>T-N-CM and c.6576C>T-N-CM) exhibited a stronger T cell Ccl4 induction compared to CM from control hiPSC-induced neurons (CTL-N-CM). Anti-MDK neutralizing antibodies reduced T cell Ccl4 production in response to hiPSC-induced neuron CM stimulation. g MDK-activated (50 ng ml−1) T cell CM (mid-treated Tm) increased microglial Ccl5 production relative to non-activated T cell CM (non-act-Tm). h Immunohistochemistry revealed an increased percentage of MDK-immunoreactive cells in the retinal ganglion cell layer of OPG-bearing and Nf1+/− mice relative to control (CTL) or WT mice, respectively. Scale bars, 40 µm. Arrows denote representative immunopositive cells. i MDK gene expression was examined in NF1 pilocytic astrocytomas (NF1-PAs, n = 9), non-NF1-PAs (n = 9), and non-neoplastic brain tissues (n = 4). Increased MDK expression was detected in NF1-PAs compared to normal brain tissue and non-NF1-PAs. Arrows denote representative immunopositive cells. All data are presented as the mean ± SEM. a–c These representative experiments were conducted with a CTL, n = 3, 2041C>T n = 4, 6576C>T, n = 3; b WT, n = 7, Nf1±, n = 6; c CTL, n = 5, OPG, n = 4, independent biological samples, and were replicated two additional times with similar results. d and e Bar graphs represent the means ± SEM of d n = 5, e n = 3, independent biological samples. f This representative experiment was conducted with (from left to right) n = 3, n = 3, n = 3, n = 4, n = 3, n = 5, and n = 3 independent biological samples, and were replicated two additional times with similar results. g Bar graphs represent the means ± SEM of non-activated Tm, n = 3; MDK-treated Tm, n = 4 independent biological samples. h Bar graphs represent the means ± SEM of WT n = 9, Nf1+/−, n = 7, CTL, n = 5, OPG, n = 7, independent biological samples. i Bar graphs represent the means ± SEM of CTL, n = 4, non-NF1, PA, n = 9, NF1, PA, n = 9, independent biological samples. a, d, f, i One-way ANOVA with Bonferroni post-test correction, b, c, h Two-tailed Student’s t-test. Exact P values are indicated within each panel; N.S.; not significant. From left to right in each panel: a all P < 0.00, 1 b P = 0.008, c P = 0.021, d all N.S.; f top P = 0.012, middle P = 0.023, P = 0.030, bottom P = 0.045, P = 0.039; i CTL:NF1 PA P = 0.024, non-NF1 PA:NF1-PA P = 0.007; h all P < 0.001.
Fig. 3
Fig. 3. MDK activates T cells to produce Ccl4 through Lrp1/calcineurin/NFAT1 signaling.
a T cells expressed only two (Lrp1 and Lrp6) of the putative MDK receptors [protein-tyrosine phosphatase ζ (Ptprz1), neuroglycan-C (Cspg5), low density-lipoprotein receptor-related protein-1 (Lrp1), low density-lipoprotein receptor-related protein-6 (Lrp6) and anaplastic lymphoma kinase (Alk)] by quantitative RT-PCR. Normal mouse cortex was used as an internal positive control. b Lrp1 blocking antibodies (30 µg ml−1) reduced MDK-induced Ccl4 production in T cells. c The 2041C>T neuron conditioned media (N-CM)-mediated Ccl4 production in T cells was attenuated following exposure to Lrp1 receptor blocking antibodies. d Immunoblotting revealed increased NFAT1 nuclear  localization in T cells following MDK treatment. Glyceraldehyde 3-phosphate dehydrogenase (GAPDH) and TATA-binding protein (TBP) served as loading controls for the cytoplasm and nuclear fractions, respectively. e Decreased levels of phosphorylated-NFAT1 (p-NFAT) were observed after MDK stimulation of T cells. Lrp1 blocking antibodies (anti-Lrp1, 30 µg ml−1) increased NFAT1 phosphorylation and impaired NFAT1 nuclear localization in MDK-stimulated T cells. f The calcineurin inhibitor FK506 (10 μM) inhibited MDK-induced NFAT1 nuclear localization. g Calcineurin inhibitors, cyclosporin (100 nM) and FK506 (10 μM), inhibited MDK-induced Ccl4 production in T cells. h FK506 (10 μM) reduced 2041C>T neuron conditioned media (N-CM)-induced Ccl4 production in T cells. All data are presented as the mean ± SEM. a Bar graphs represent the means ± SEM of n = 3 independent biological samples. b, c; g, h These representative experiments were conducted with n = 3 independent biological samples,and were replicated two additional times with similar results. b, c, g One-way ANOVA with Bonferroni post-test correction, h Two-tailed Student’s t-test. Exact P values are indicated within each panel; N.S.; not significant. From left to right in each panel: b P = 0.005, P = 0.007; c N.S., P = 0.007; g P < 0.001, N.S., N.S.; h P < 0.001. df These are representative images of n = 3 independent biological samples examined over three independent experiments with similar results. Molecular weight markers are denoted at the left side of each blot.
Fig. 4
Fig. 4. Nf1 optic glioma mice exhibit increased meningeal and parenchymal T cells.
a CD3+ T cells (circled with dash line) were depleted in splenocytes from anti-CD3 antibody-treated mice (7.6%) relative to IgG-treated mice (55%), as measured by flow cytometry. b Immunohistochemistry revealed that anti-VLA4 and anti-CD3, but not control IgG, antibody treatments reduced CD3+ T cell infiltration and the percentage of Ki67+ cells in murine Nf1 optic gliomas. No differences in microglia content (%Iba1+ cells) were observed in the anti-VLA4 and anti-CD3 groups compared to the IgG controls. Arrows denote representative immunopositive cells. Black arrows indicate representative immunopositive cells. c Immunofluorescence microscopy revealed increased meningeal CD3+ lymphocyte infiltration in optic glioma (OPG)-bearing mice, relative to the control (CTL) mice. Yellow arrow denotes representative immunopositive cells. DAPI (blue) is used as a nuclear counter stain. a, c Scale bars, 40 µm. b Bar graphs represent the means ± SEM of (top panel) IgG, n = 9; anti-VLA4, n = 10; anti-CD3, n = 9; (middle and bottom panels), all groups had n = 10 independent biological samples. c Bar graphs represent the means ± SEM of CTL, n = 6; OPG, n = 9; independent biological samples. b One-way ANOVA with Bonferroni post-test correction; c Two-tailed Student’s t-test. Exact P values are indicated within each panel; N.S.; not significant. From left to right in each panel: b top panel: all P < 0.001, middle panel: all P < 0.001, bottom panel: all N.S.; c P = 0.005.
Fig. 5
Fig. 5. Nf1 optic glioma mice exhibit increased numbers of CD8+ T cells in the meninges and optic nerve.
a Increased CD3+ and CD8+ T cell infiltration was observed in Nf1 optic glioma (OPG)-containing nerves relative to control (CTL) optic nerves. Few CD4+ T cells were detected in murine Nf1 OPG or control optic nerves. Black arrows denote representative immunopositive cells. Scale bars, 20 µm. b CD3+ (red); CD8+ (green) double-positive cells were found (yellow arrow) in murine Nf1 optic gliomas. c Increased numbers of meningeal CD4+ and CD8+ T cells (green) were present in Nf1 OPG mice relative to controls, where the number of CD8+ T cells was three-fold higher than CD4+ T cells. DAPI (blue) is used as a nuclear counter stain. Yellow arrows denote representative immunopositive cells. b, c Scale bars, 40 µm. a, c Bar graphs represent the means ± SEM of a (left panel) n = 6, (middle panel) CTL, n = 5; OPG, n = 6, (right panel) n = 5 or c n = 6 independent biological samples. a Two-tailed Student’s t-test, c One-way ANOVA with Bonferroni post-test correction. Exact P values are indicated within each panel; N.S.; not significant. From left to right in each panel: a left panel P = 0.006, middle panel N.S., right panel P = 0.007; c P = 0.004, P < 0.001.
Fig. 6
Fig. 6. CD8+ T cells control Nf1 optic glioma growth.
a Immunohistochemistry revealed that anti-CD8 antibody treatment reduced the number of CD3+ T cells, as well as the percentage of Ki67+ cells, Ccl4+ cells, and Ccl5+ cells, in Nf1 optic glioma specimens. Black arrows denote representative immunopositive cells. Scale bar, 40 µm. No differences in microglia (%Iba1+ cells) content were observed in anti-CD8 treated mice compared to the IgG control group. Bar graphs represent the means ± SEM of %Ki67+ cells, IgG, n = 8; anti-CD8, n = 5; CD3+ cells, IgG, n = 8; anti-CD8, n = 5; %Iba1+ cells, IgG, n = 8; anti-CD8, n = 5; %Ccl4+ cells, IgG, n = 6; anti-CD8, n = 5; %Ccl5+ cells, IgG, n = 4; anti-CD8, n = 4, independent biological samples. Two-tailed Student’s t-test. Exact P values are indicated within each panel; N.S.; not significant. From left to right in each panel: a % Ki67+ cells, P = 0.001; CD3+ cells, P = 0.002; %Iba1+ cells, N.S.; %Ccl4+ cells, P = 0.026; % Ccl5+ cells, P = 0.015. b Kaplan–Meier survival analysis (Brain Lower Grade Glioma TCGA Provisional [left panel; P = 6.72e–13] and TCGA PanCancer Atlas [right panel; P = 7.11e−14] datasets) demonstrates that non-overlapping patients with LGG and high tumor CD8 expression have shorter survival time, while c high CD4 expression was not associated with reduced survival time (Brain Lower Grade Glioma TCGA Provisional [left panel; P = 0.371] and TCGA PanCancer Atlas [right panel; P = 0.598] datasets).
Fig. 7
Fig. 7. T cell-mediated microglial Ccl5 production inhibits LGG apoptosis through CD44.
a Activated T cell CM (act-Tm) increased Iκbα phosphorylation in microglia, which was reduced following Caffeic acid phenethyl ester (CAPE; 100 µM) treatment. b CAPE treatment attenuated activated T cell CM (act-Tm)-mediated Ccl5 production in microglia. OPG o-GSCs were stimulated with Ccl5 at 300 pg ml−1 for 3 days. Whereas no increased optic glioma stem cell (o-GSC) proliferation (%Ki67+ cells) was observed c, o-GSC apoptosis (%TUNEL+ cells) was reduced in the Ccl5-treated group compared to vehicle (Veh, 0.1% BSA) treated controls d. e Immunoblotting reveals activation of the Akt-GSK3β-CREB anti-apoptosis pathway following Ccl5 treatment, which was inhibited by AKT inhibitor (20 μM MK2206) treatment. f 20 μM MK2206 treatment inhibited the anti-apoptosis effect of Ccl5 on o-GSCs (%TUNEL+ cells). g Cd44 expression in o-GSCs was detected by qRT-PCR using splenocytes as a positive control. Cd44 expression differences were not statistically analyzed. h CD44 knockdown (CD44KD) in o-GSCs reduces CD44 expression relative to the control shRNA-treated (Ctrl) cells. i Apoptosis (%TUNEL+ cells) of CD44KD o-GSCs was not inhibited by Ccl5 treatment. j Immunoblotting reveals that Ccl5 activation of the Akt/GSK3β/CREB anti-apoptosis pathway was inhibited by CD44 knockdown. All data are presented as the mean ± SEM. bd, f, i These representative experiments were conducted with b n = 3, c n = 6, d n = 5; f, i n = 4 independent biological samples and were replicated two additional times with similar results. g Bar graphs represent the means ± SEM of n = 3 independent biological samples. bd, i Two-tailed Student’s t-test; f One-way ANOVA with Bonferroni post-test correction. Exact P values are indicated within each panel; N.S.; not significant. From left to right in each panel: b P = 0.001; c N.S.; d P = 0.003; f P = 0.003, N.S.; i P = 0.119. a, e, h, j These are representative images of n = 3 independent biological samples examined over three independent experiments with similar results. Molecular weight markers are denoted at the right side of each blot.
Fig. 8
Fig. 8. T cell-induced Ccl5/CD44-mediated cell survival underlies Nf1 optic glioma growth.
a, b Immunohistochemistry revealed that anti-CD8 antibody treatment reduced the percentage of p-AKTSer473-expressing and p-CREBSer133-expressing cells in mouse Nf1 optic glioma specimens. Black arrows denote representative immunopositive cells. Scale bars, 20 µm. Bar graphs represent the means ± SEM of n = 4 independent biological samples. Two-tailed Students-t test. Exact P values are indicated within each panel; a P < 0.001; b P = 0.002. c, d Kaplan–Meier survival curves (Brain Lower Grade Glioma TCGA Provisional [2 left panels; c P = 1.29e−6, d P = 2.06e−3] and TCGA PanCancer Atlas [2 right panels; c P = 4.69e−13, d P = 9.86e−3] datasets) demonstrate that non-overlapping patients with LGG who harbor high CCL5 expression or CD44 expression have reduced survival time. e Schematic representation of the neuron–immune–cancer axis in NF1-LGG. Meningeal T cells infiltrate into the optic glioma in an integrin (VLA-4)-dependent manner, and are activated by MDK produced by Nf1-mutant retinal ganglion cells (neurons) through a RAS-dependent mechanism. This neuron-mediated T cell activation increases CD8+ T cell Ccl4 production through increased Lrp1/calcineurin signaling, and results in increased NFκB-dependent microglial Ccl5 expression, culminating in increased glioma growth through Akt/GSK3β/CREB pathway-mediated suppression of cancer (glioma) stem cell apoptosis and increased tumor growth.

References

    1. Su S, et al. CD10(+)GPR77(+) cancer-associated fibroblasts promote cancer formation and chemoresistance by sustaining cancer stemness. Cell. 2018;172:841–856e816. doi: 10.1016/j.cell.2018.01.009. - DOI - PubMed
    1. Erez N, Truitt M, Olson P, Arron ST, Hanahan D. Cancer-associated fibroblasts are activated in incipient neoplasia to orchestrate tumor-promoting inflammation in an NF-kappaB-dependent manner. Cancer Cell. 2010;17:135–147. doi: 10.1016/j.ccr.2009.12.041. - DOI - PubMed
    1. Yang FC, et al. Nf1-dependent tumors require a microenvironment containing Nf1+/− and c-kit-dependent bone marrow. Cell. 2008;135:437–448. doi: 10.1016/j.cell.2008.08.041. - DOI - PMC - PubMed
    1. El Andaloussi A, Lesniak MS. An increase in CD4+CD25+FOXP3+ regulatory T cells in tumor-infiltrating lymphocytes of human glioblastoma multiforme. Neuro Oncol. 2006;8:234–243. doi: 10.1215/15228517-2006-006. - DOI - PMC - PubMed
    1. Gutmann DH, Kettenmann DH. Microglia/brain macrophages as central drivers of brain tumor pathobiology. Neuron. 2019;104:442–449. doi: 10.1016/j.neuron.2019.08.028. - DOI - PMC - PubMed

Publication types

MeSH terms