. 2020 May 1;11(1):2130.
doi: 10.1038/s41467-020-16010-4.

Accelerating invasion potential of disease vector Aedes aegypti under climate change

Affiliations

Accelerating invasion potential of disease vector Aedes aegypti under climate change

Takuya Iwamura et al. Nat Commun. .

Abstract

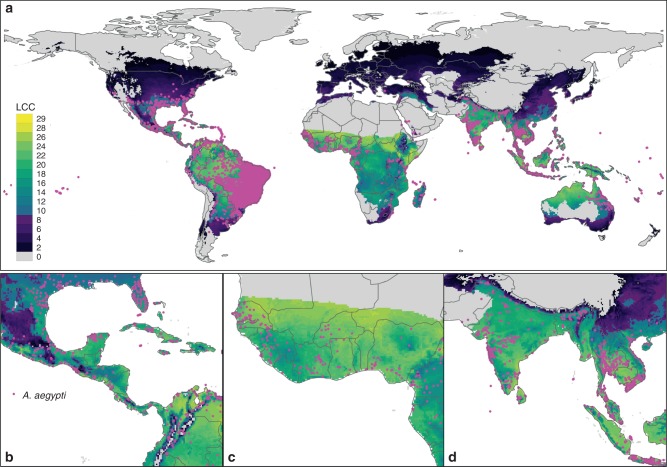
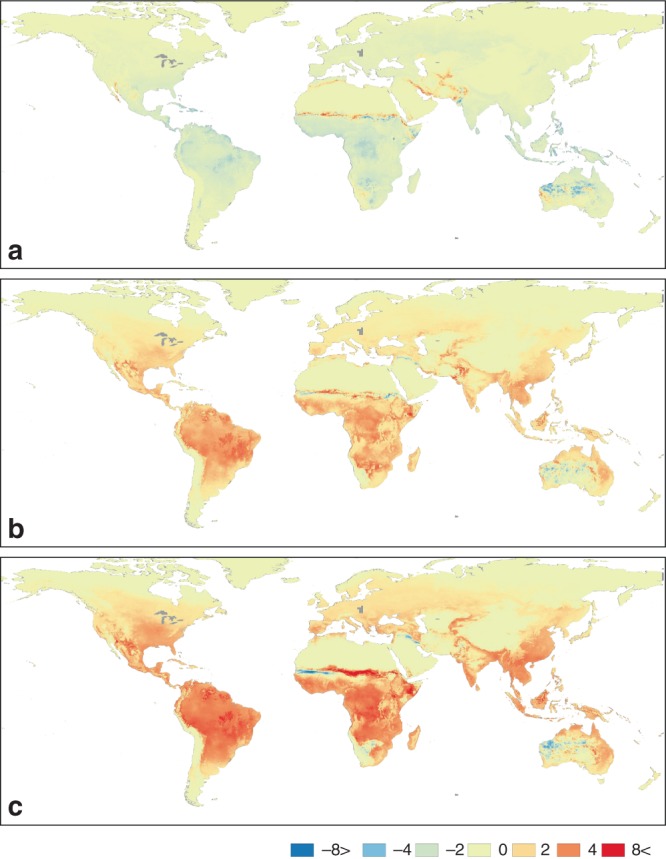
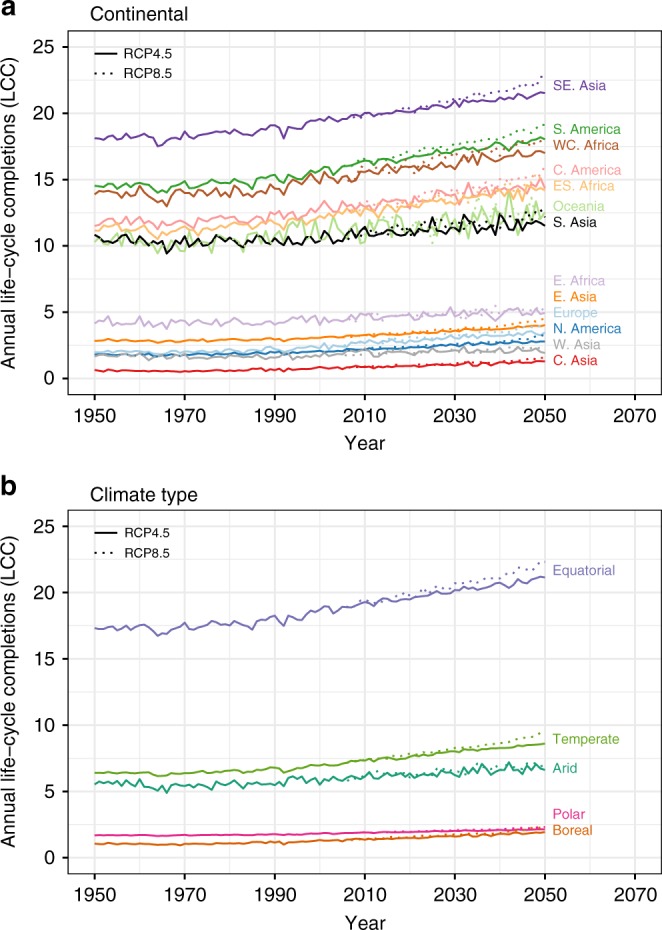
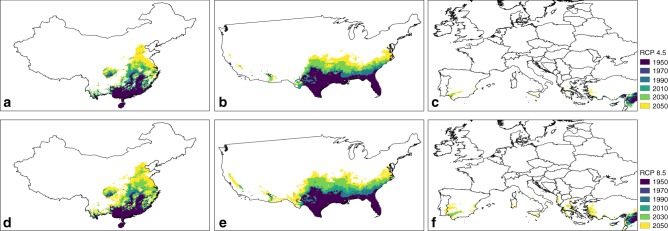
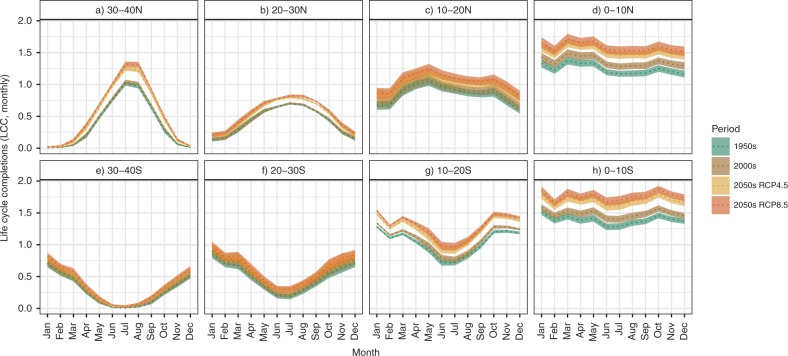
Vector-borne diseases remain a major contributor to the global burden of disease, while climate change is expected to exacerbate their risk. Characterising vector development rate and its spatio-temporal variation under climate change is central to assessing the changing basis of human disease risk. We develop a mechanistic phenology model and apply it to Aedes aegypti, an invasive mosquito vector for arboviruses (e.g. dengue, zika and yellow fever). The model predicts the number of life-cycle completions (LCC) for a given location per unit time based on empirically derived biophysical responses to environmental conditions. Results suggest that the world became ~1.5% more suitable per decade for the development of Ae. aegypti during 1950-2000, while this trend is predicted to accelerate to 3.2-4.4% per decade by 2050. Invasion fronts in North America and China are projected to accelerate from ~2 to 6 km/yr by 2050. An increase in peak LCC combined with extended periods suitable for mosquito development is simulated to accelerate the vector's global invasion potential.


Conflict of interest statement

The authors declare no competing interests.

Figures

Fig. 1
Fig. 1. Distribution of annual LCC of Ae. aegypti with occurrence data overlaid.
Maps indicate the total number of LCC per year at the global scale (a), Central America (b), West Africa (c) and South East Asia (d). Colour represents the number of LCC. Areas in which LCC < 10, corresponding to the threshold used in subsequent analysis (i.e. Fig. 4), are shown with a darker palette (indigo-black, note legend). Grey colour represents unsuitable areas for Ae. aegypti development. Magenta dots represent presence records of Ae. aegypti (refs. ,).
Fig. 2
Fig. 2. Changes of LCC of Ae. aegypti between 1950, 2000 and 2050.
Differences in LCC relative to LCC in 2000s (2000–2004 average). a Comparison with 1950s (1950–1954 average); b comparison with 2050s (2050–2054 average) under RCP 4.5; and c under RCP 8.5. Decreases in LCC are shown in ‘cool’ colours (blue and green) and the increases in ‘warm’ colours (orange and red).
Fig. 3
Fig. 3. Continental and climatic regional averages of annual LCC 1950–2050.
The annual LCC at each location was averaged over continental regions (a) and climatic regions (b) between 1950 and 2050. Data were calculated for each year with two climatic scenarios—solid lines represent the LCC prediction under RCP 4.5 scenario and dotted lines are under RCP 8.5 scenario. Confidence intervals indicating variability due to the underlying GCMs are not shown here to avoid overplotting and retain clarity of the mean trends—see text for 95% CIs on percentage change statistics over the time series and Fig. 5 for CIs on seasonal trends. Continental regions include Central Asia, East Asia, South Asia, South East Asia, West Asia, Central America, North America, South America, East Africa, East South Africa, West Central Africa, Europe and Oceania. The climatic regions include arid, boreal, equatorial, temperate and polar.
Fig. 4
Fig. 4. Expansion of invasion frontiers of Ae. aegypti in China, USA and Europe from 1950–2050 under RCPs 4.5 and 8.5.
Invasion frontiers of Ae. aegypti were estimated at decadal intervals for China, USA and Europe based on LCC predictions. The frontier threshold was set at ≥10 LCC based on the frequencies of LCC values extracted to the historical occurrence records of Ae. aegypti. The colour scheme represents the frontier contour lines in separate decadal intervals (1950, 1970, 1990, 2010, 2030 and 2050). Shifts in the invasion frontiers are shown for: (a) China under RCP 4.5, (b) USA under RCP 4.5, (c) Europe under RCP 4.5, (d) China under RCP 8.5, (e) USA under RCP 8.5 and (f) Europe under RCP 8.5.
Fig. 5
Fig. 5. Seasonal profiles of LCC based on monthly averages in latitudinal zones.
Monthly average LCC within the latitudinal zones are shown for the years 1950 (1950–54), 2000 (2000–2004) and 2050 (2050–2054) under RCP 4.5 and RCP 8.5 scenarios. The x axis represents months from January to December, and the y axis is monthly average LCC within each latitudinal zone (a)–(h) (40°S to 40°N). Colours indicate time period and climate change scenario, where dotted lines indicate means and ribbons around the lines represent 95% CIs to illustrate variability attributable to underlying GCMs.

References

    1. Campbell-Lendrum D, Manga L, Bagayoko M, Sommerfeld J. Climate change and vector-borne diseases: what are the implications for public health research and policy? Philos. Trans. R. Soc. B Biol. Sci. 2015;370:20130552. doi: 10.1098/rstb.2013.0552. - DOI - PMC - PubMed
    1. Kilpatrick AM, Randolph SE. Drivers, dynamics, and control of emerging vector-borne zoonotic diseases. Lancet. 2012;380:1946–1955. doi: 10.1016/S0140-6736(12)61151-9. - DOI - PMC - PubMed
    1. Hales S, De Wet N, Maindonald J, Woodward A. Potential effect of population and climate changes on global distribution of dengue fever: an empirical model. Lancet. 2002;360:830–834. doi: 10.1016/S0140-6736(02)09964-6. - DOI - PubMed
    1. Messina, J. P. et al. The many projected futures of dengue. Nat. Rev. Microbiol.10.1038/nrmicro3430 (2015). - PubMed
    1. Murray, K. A., Olivero, J., Roche, B., Tiedt, S. & Guégan, J. F. Pathogeography: leveraging the biogeography of human infectious diseases for global health management. Ecography, 10.1111/ecog.03625 (2018). - PMC - PubMed

Publication types