Comparative Study
. 2020 May;7(5):639-652.
doi: 10.1002/acn3.51015. Epub 2020 May 2.

Vorinostat in the acute neuroinflammatory form of X-linked adrenoleukodystrophy

Affiliations
Comparative Study

Vorinostat in the acute neuroinflammatory form of X-linked adrenoleukodystrophy

Bettina Zierfuss et al. Ann Clin Transl Neurol. 2020 May.

Abstract

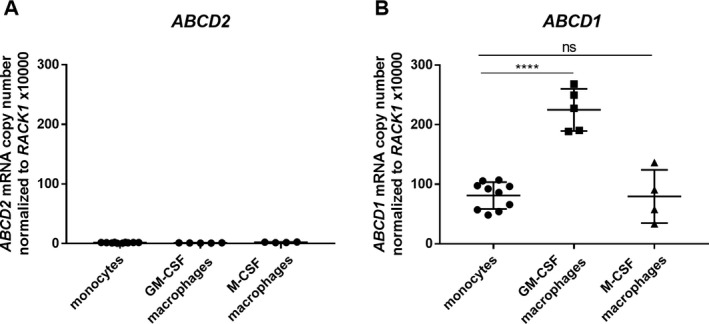
Objective: To identify a pharmacological compound targeting macrophages, the most affected immune cells in inflammatory X-linked adrenoleukodystrophy (cerebral X-ALD) caused by ABCD1 mutations and involved in the success of hematopoietic stem cell transplantation and gene therapy.

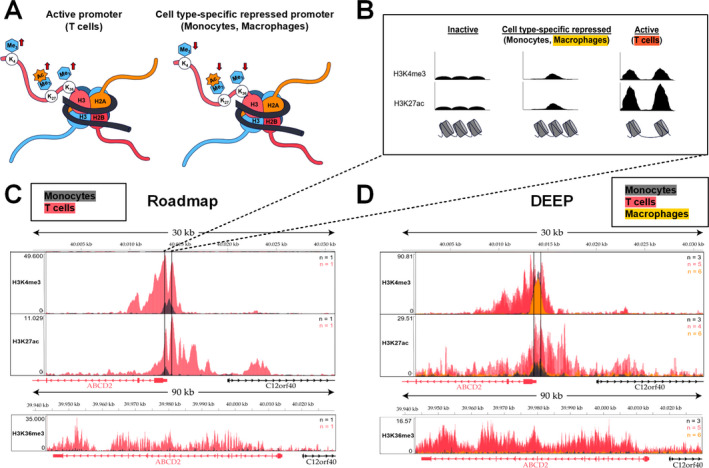
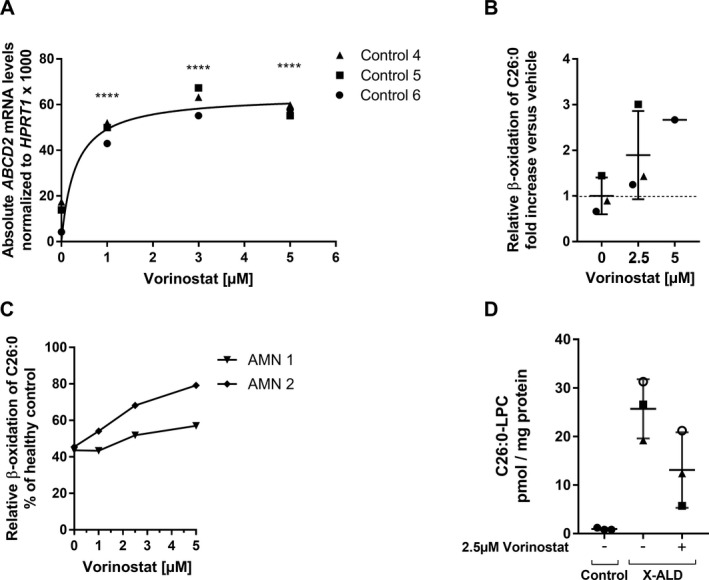
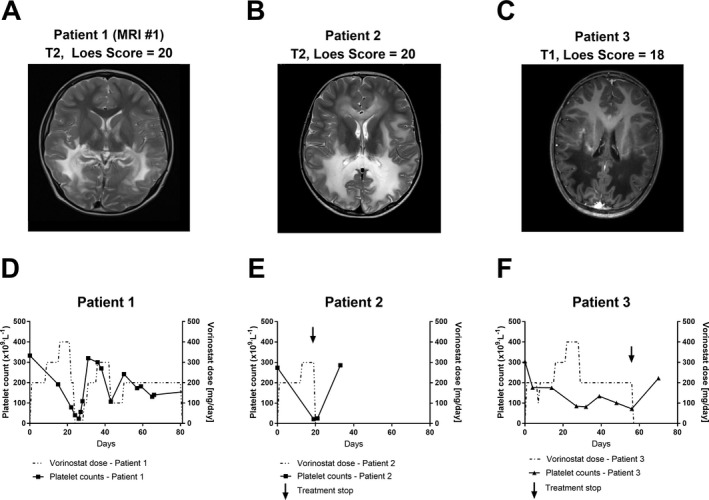
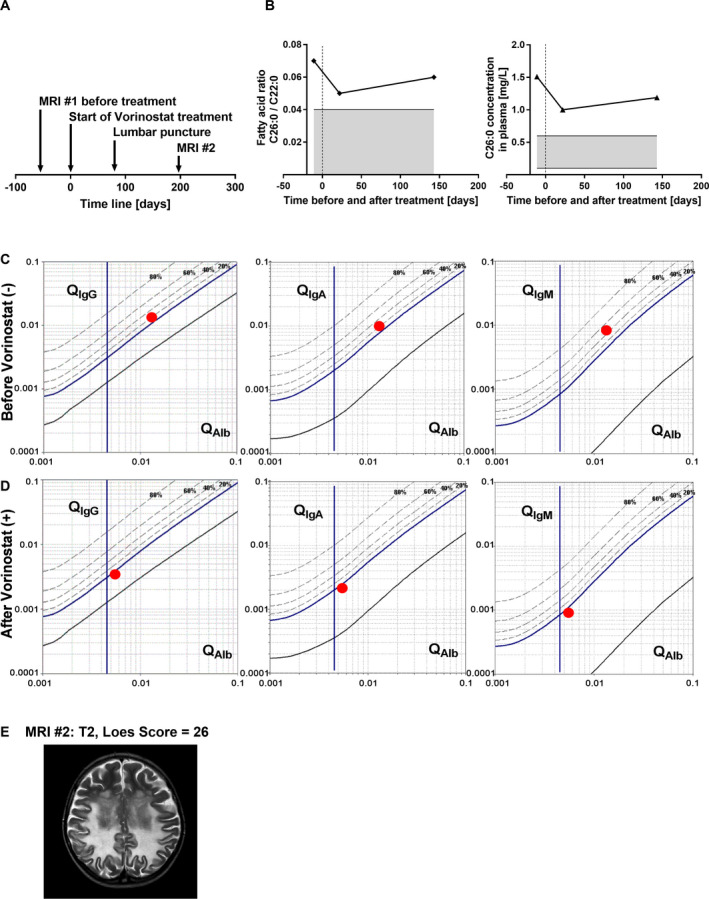
Methods: A comparative database analysis elucidated the epigenetic repressing mechanism of the related ABCD2 gene in macrophages and identified the histone deacetylase (HDAC) inhibitor Vorinostat as a compound to induce ABCD2 in these cells to compensate for ABCD1 deficiency. In these cells, we investigated ABCD2 and pro-inflammatory gene expression, restoration of defective peroxisomal β-oxidation activity, accumulation of very long-chain fatty acids (VLCFAs) and their differentiation status. We investigated ABCD2 and pro-inflammatory gene expression, restoration of defective peroxisomal ß-oxidation activity, accumulation of very long-chain fatty acids (VLCFA) and differentiation status. Three advanced cerebral X-ALD patients received Vorinostat and CSF and MRI diagnostics was carried out in one patient after 80 days of treatment.

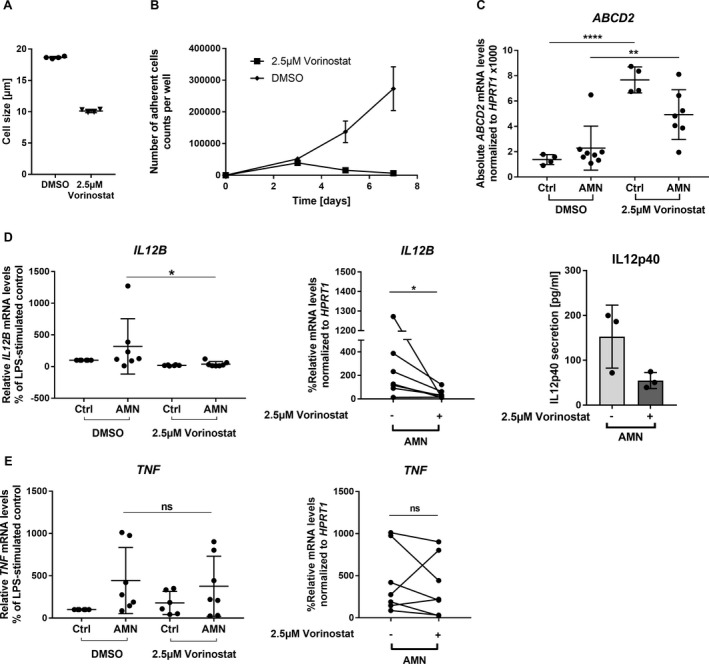
Results: Vorinostat improved the metabolic defects in X-ALD macrophages by stimulating ABCD2 expression, peroxisomal ß-oxidation, and ameliorating VLCFA accumulation. Vorinostat interfered with pro-inflammatory skewing of X-ALD macrophages by correcting IL12B expression and further reducing monocyte differentiation. Vorinostat normalized the albumin and immunoglobulin CSF-serum ratios, but not gadolinium enhancement upon 80 days of treatment.

Interpretation: The beneficial effects of HDAC inhibitors on macrophages in X-ALD and the improvement of the blood-CSF/blood-brain barrier are encouraging for future investigations. In contrast with Vorinostat, less toxic macrophage-specific HDAC inhibitors might improve also the clinical state of X-ALD patients with advanced inflammatory demyelination.


Conflict of interest statement

We declare that we have no competing interests.

Figures

Figure 1
Figure 1
ABCD2 gene expression remains at low levels compared to ABCD1 after differentiation using GM‐CSF or M‐CSF in human monocyte‐derived macrophages. Monocytes were isolated from leukocyte concentrates derived from healthy donors by plasmapheresis and were differentiated toward macrophages with 50 ng/mL GM‐CSF or M‐CSF for 7 days. Absolute mRNA levels were determined by RT‐qPCR using standard concentration curves of plasmids containing (A) ABCD2 and (B) ABCD1 and for normalization RACK1 cDNA. Each data point represents a replicate (well) from three healthy donors (controls 1–3). For statistical analysis one‐way ANOVA and Sidak’s multiple comparison test were used. ****P < 0.0001, ns = not significant.
Figure 2
Figure 2
Comparison of activating histone modifications indicates a cell type‐specific repressed state of the ABCD2 promoter in monocytes and macrophages. ChIP‐Seq data of activating histone modifications retrieved from the International Human Epigenome Consortium (IHEC) were compared in human monocytes (dark grey), macrophages (orange) and T cells (red) to analyse the mechanism of differential ABCD2 expression, which is high in T cells but barely detectable in monocytes/macrophages. (A) An active promoter is characterized by high trimethylation of histone 3 lysine 4 (H3K4me3) and acetylation (ac) of H3K27. In addition, active expression of a gene is associated with high H3K36me3 marks at intragenic regions. The vice versa pattern could indicate a cell type‐specific, repressed state as indicated in the scheme. (B) Nucleosome‐free regions of DNA are easily accessible for transcription factors and the RNA‐polymerase II and, thus, depending on flanking histone modifications can be linked with an active or poised promoter. Accordingly, the analysis of ChIP‐Seq data reveals the associated characteristic peak‐valley‐peak pattern of H3K4me3 and H3K27ac at a promoter linked to active gene expression. However, a peak spanning the promoter region is associated with a repressed state, while low levels of these modifications typically indicate an inactivated state. (C, D) In the upper panel, a 30‐kb region (GRCh37; Chr 12: 40,000,000–40,031,000) surrounding the ABCD2 promoter is depicted. Within the promoter region (marked with vertical lines) data from the consortia Roadmap (C) and DEEP (D) show a typical peak‐valley‐peak pattern for H3K4me3 and H3K27ac in T cells (red) indicating an active promoter. In monocytes (dark grey) and macrophages (orange), these modifications span a broader region around the promoter. The bottom panels show elevated H3K36me3 marks at intragenic regions of ABCD2 in T cells, indicating active expression, but barely detectable signals in monocytes/macrophages in datasets from both consortia (C, D). n = number of tracks per cell type.
Figure 3
Figure 3
Vorinostat treatment efficiently induces ABCD2 expression, improves β‐oxidation and accumulation of the VLCFA C26:0 in healthy controls and X‐ALD macrophages. (A) Macrophages (M‐CSF) from three healthy donors (Control 4, 5, and 6) were differentiated with 50 ng/mL M‐CSF for 7 days, then treated with 1, 3, and 5 µmol/L Vorinostat for 24 h and absolute ABCD2 mRNA levels were determined and normalized to HPRT1. (B) Macrophages from three healthy donors were differentiated as described in (A) and further activated by 100 ng/mL IL‐4 to obtain activated anti‐inflammatory macrophages. In the presence of IL‐4, macrophages were treated with 2.5 µmol/L Vorinostat (n = 3) or 5 µmol/L Vorinostat (n = 1) for 48 h prior to measuring C26:0 degradation levels via β‐oxidation. The obtained β‐oxidation rates for C26:0 (pmol/min/mg protein) of the added cells are depicted as fold increase versus the mean of DMSO‐treated controls (n = 3). (C) A dose–response curve for the β‐oxidation of C26:0 was generated with 1, 2.5, and 5 µmol/L Vorinostat in macrophages (as described in (B)) from two X‐ALD patients (AMN 1 and AMN 2). The measured activities are shown as % of the DMSO‐treated healthy control (Control 10) value. (D) Macrophages (M‐CSF) from X‐ALD patients (n = 3) were stimulated with 2.5 µmol/L Vorinostat for 5 days and the levels of C26:0‐LPC (pmol/ mg protein) were measured and compared to DMSO‐treated (n = 3) or untreated healthy control (n = 3) macrophages respectively. The statistical tests, one‐way ANOVA and Dunnett’s multiple comparison, were used to analyse induction of ABCD2 in macrophages from controls (n = 3). ****P < 0.0001.
Figure 4
Figure 4
Vorinostat interferes with the differentiation of monocytes to macrophages in vitro and shows differential anti‐inflammatory effects in LPS‐activated X‐ALD macrophages. (A and B) The ability of human blood‐derived monocytes to differentiate toward macrophages when applying M‐CSF in the presence of 2.5 µmol/L Vorinostat was analysed in control macrophages using two replicates from two different donors. For the differentiation analysis, we determined (A) the mean cell size after 7 days and (B) the adherence to the cell culture plate after 3, 5, and 7 days of cultivation. (C–E) To assess whether Vorinostat can efficiently reduce the elevated pro‐inflammatory gene expression of IL12B and TNF in X‐ALD, macrophages (M‐CSF) from healthy donors and X‐ALD patients were stimulated with 100 ng/mL LPS for 24 h. In the presence of LPS, macrophages (Ctrl, n = 4 or n = 6; AMN, n = 7) were treated with 2.5 µmol/L Vorinostat or its solvent DMSO before the mRNA levels of ABCD2 (C), and the pro‐inflammatory cytokines IL12B (D) and TNF (E) were determined by RT‐qPCR and normalized to HPRT1. In addition, supernatants of stimulated macrophages were harvested and IL12p40 secretion was measured by ELISA (D). The efficacy of ABCD2 induction in control and X‐ALD macrophages was analysed by one‐way ANOVA and Sidak’s multiple comparisons test. (D and E) For comparison purposes, the levels of LPS‐treated controls were set to 100% for each experiment and the Vorinostat‐induced changes of pro‐inflammatory gene expression in X‐ALD were subjected to statistical analysis applying the nonparametric Friedman test and Dunn’s multiple comparison test. The error bars in panel (A) represent SD. *P < 0.05, **P < 0.01, ****P < 0.0001, ns = not significant.
Figure 5
Figure 5
Vorinostat treatment withdrawal was required due to the severity of induced thrombocytopenia in two of three treated CALD patients who showed advanced lesions on brain MRIs. (A–C) The brain MRIs (T1‐ or T2‐weighted as indicated) obtained from three patients with advanced CALD with assigned Loes scores of 20, 20, and 18 are shown before they received 100–400 mg/day Vorinostat. (D–F) Vorinostat dose (dashed line) and platelet (thrombocyte) counts (solid line) are depicted for each patient during the treatment period. The arrow indicates the treatment stop for CALD patient 2 and 3.
Figure 6
Figure 6
Medication with Vorinostat reversed intrathecal immunoglobulin synthesis and the disturbed BCSFB/BBB permeability but did not stop disease progression in a patient with advanced CALD. (A) As shown in the scheme, blood serum and lumbar puncture‐derived CSF were collected from patient CALD1 at the start of treatment with Vorinostat (day 0) and after 80 days of treatment and processed for analysis of albumin (Alb) and Ig levels. (B) The values of the VLCFA C26:0, measured by GC–MS, in the plasma from patient CALD1 are depicted before and during Vorinostat treatment and were normalized to the fatty acid C22:0 or are shown as mg per L plasma. The grey area indicates the normal range during physiological conditions. (C‐D) The ratios (CSF/serum level) of IgG, IgA, and IgM are plotted against the CSF/serum ratio of albumin (red dot, patient CALD1) on logarithmic scales in the Reiber Scheme, (C) before (−) and (D) after (+) Vorinostat treatment. The vertical line indicates the age‐dependent threshold for Alb permeability under physiological conditions on the x‐axis. The dashed lines indicate the percentage of intrathecal synthesis for each Ig class on the y‐axis. (E) An additional brain MRI (#2, T2‐weighted) was obtained 197 days after starting Vorinostat medication and the assigned Loes score of 26 indicated progression of the inflammatory demyelination.
Figure 7
Figure 7
Perivascular B cell accumulation in CALD brain lesions. The light microscopy views depict immunohistochemical staining (brown) of (A) CD20+ B cells and (B) IgG+ plasma B cells (arrows) accumulating in the perivascular space in areas of active demyelinating lesions in postmortem brain tissue of a CALD patient. Perivascular CD20+ B cells were quantified in four untreated CALD cases (n = 4) and compared to controls lacking any signs of brain inflammation (n = 10). An occasional (very rare) parenchymal cell is shown in the magnified view (top right panel). For statistical analysis, the nonparametric Mann–Whitney test was performed. ***P < 0.001.

References

    1. Moser HW, Smith KD, Watkins PA, et al. X‐linked Adrenoleukodystrophy In: Scriver AL, Beaudet AL, Sly WS. and Valle DCR, eds. The metabolic and molecular bases of inherited disease. pp. 3257–3301. New York: McGraw Hill, 2001.
    1. Mosser J, Douar AM, Sarde CO, et al. Putative X‐linked adrenoleukodystrophy gene shares unexpected homology with ABC transporters. Nature 1993;361:726–730. - PubMed
    1. Wiesinger C, Kunze M, Regelsberger G, et al. Impaired very long‐chain acyl‐CoA β‐oxidation in human X‐linked adrenoleukodystrophy fibroblasts is a direct consequence of ABCD1 transporter dysfunction. J Biol Chem 2013;288:19269–19279. - PMC - PubMed
    1. Berger J, Gartner J. X‐linked adrenoleukodystrophy: clinical, biochemical and pathogenetic aspects. Biochim Biophys Acta 2006;1763:1721–1732. - PubMed
    1. Kemp S, Berger J, Aubourg P. X‐linked adrenoleukodystrophy: clinical, metabolic, genetic and pathophysiological aspects. Biochim Biophys Acta (BBA)‐Mol Basis Dis 2012;1822:1465–1474. - PubMed

Publication types

MeSH terms

Substances

LinkOut - more resources