. 2020 May 28;181(5):997-1003.e9.
doi: 10.1016/j.cell.2020.04.023. Epub 2020 Apr 30.

Genomic Epidemiology of SARS-CoV-2 in Guangdong Province, China

Affiliations

Genomic Epidemiology of SARS-CoV-2 in Guangdong Province, China

Jing Lu et al. Cell. .

Abstract

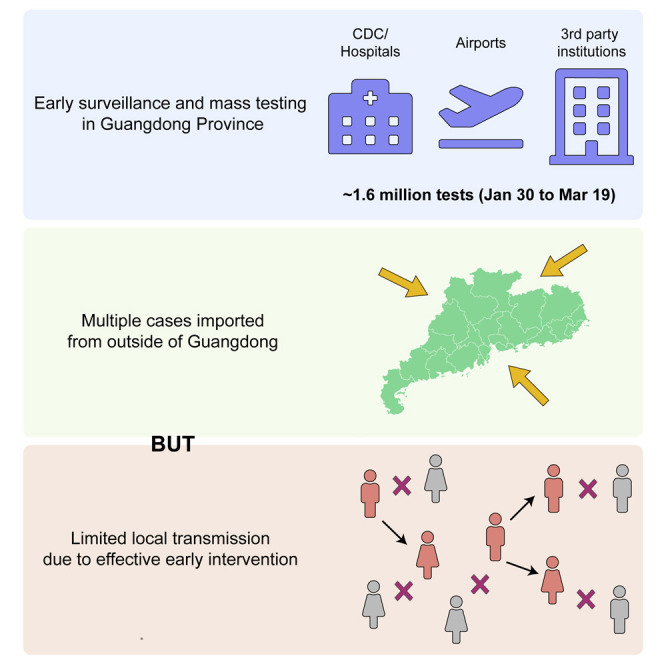
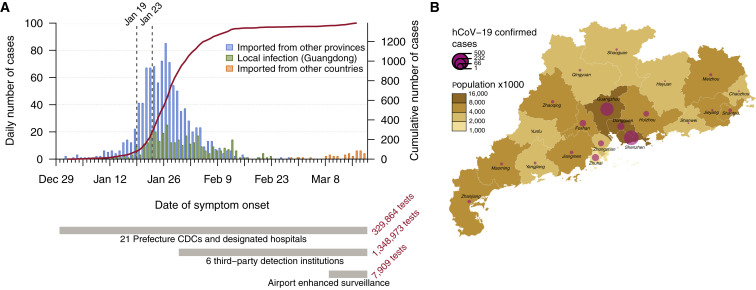
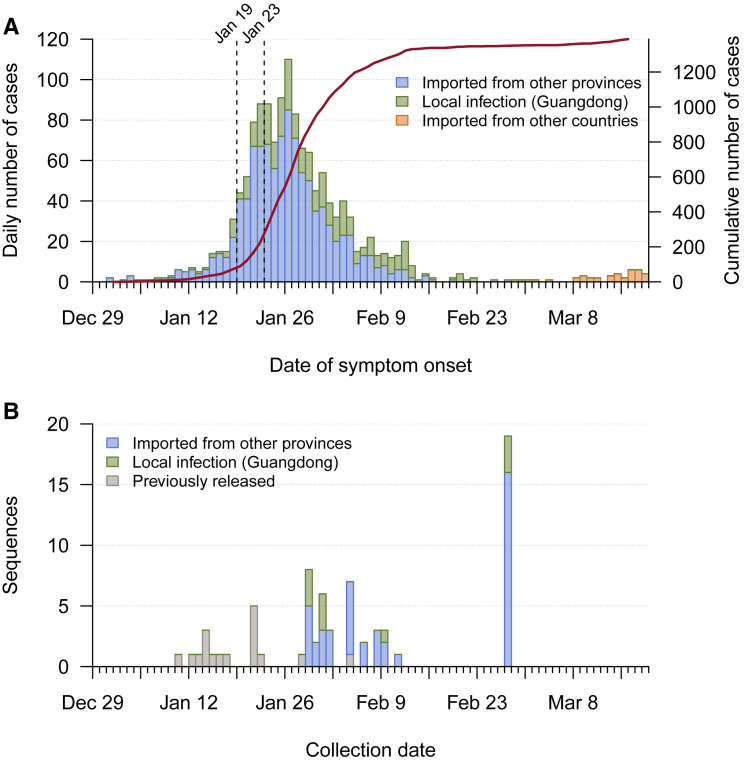
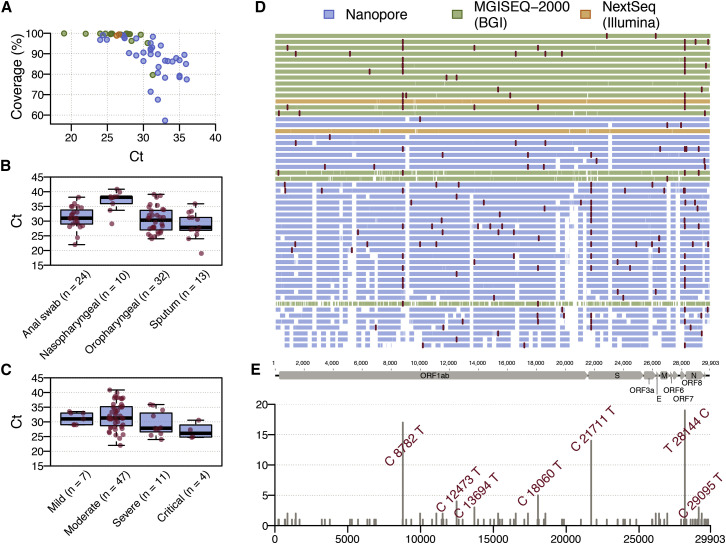
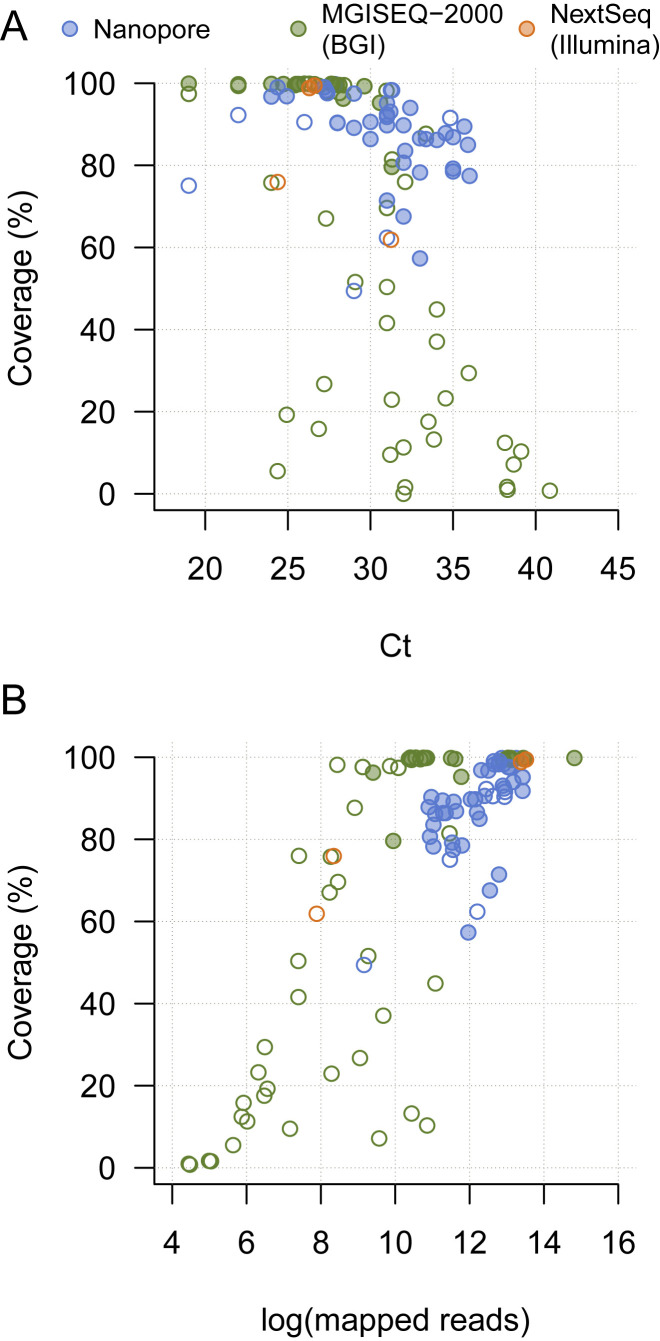
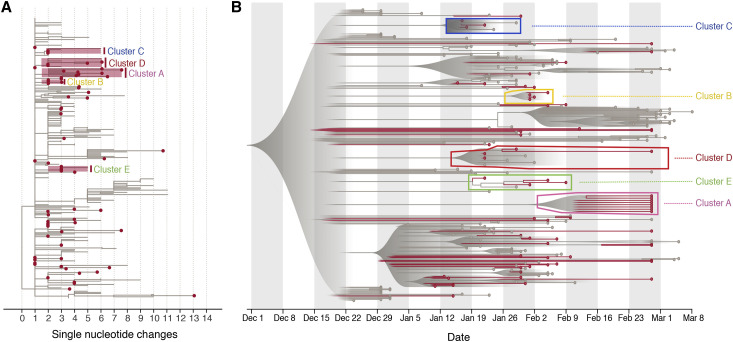
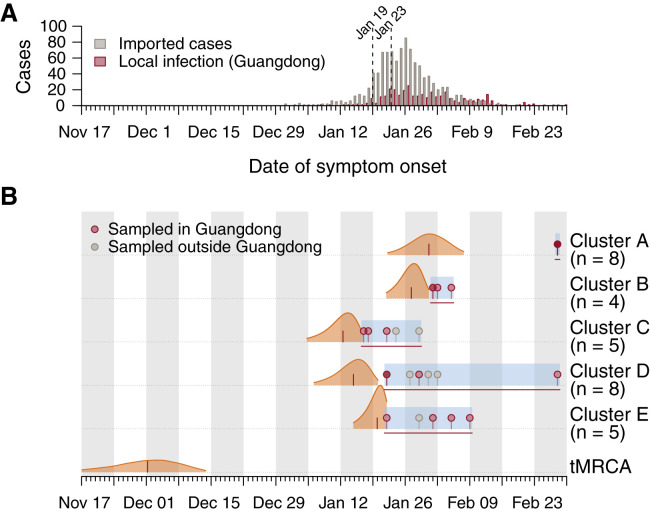
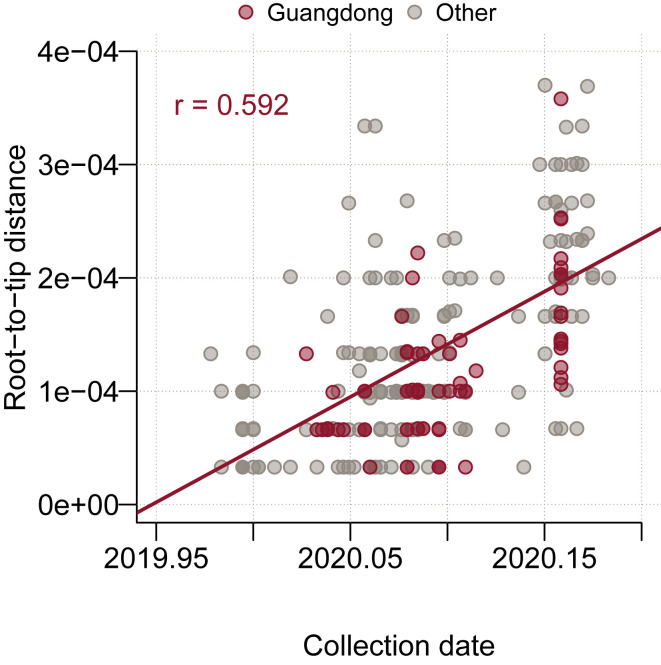
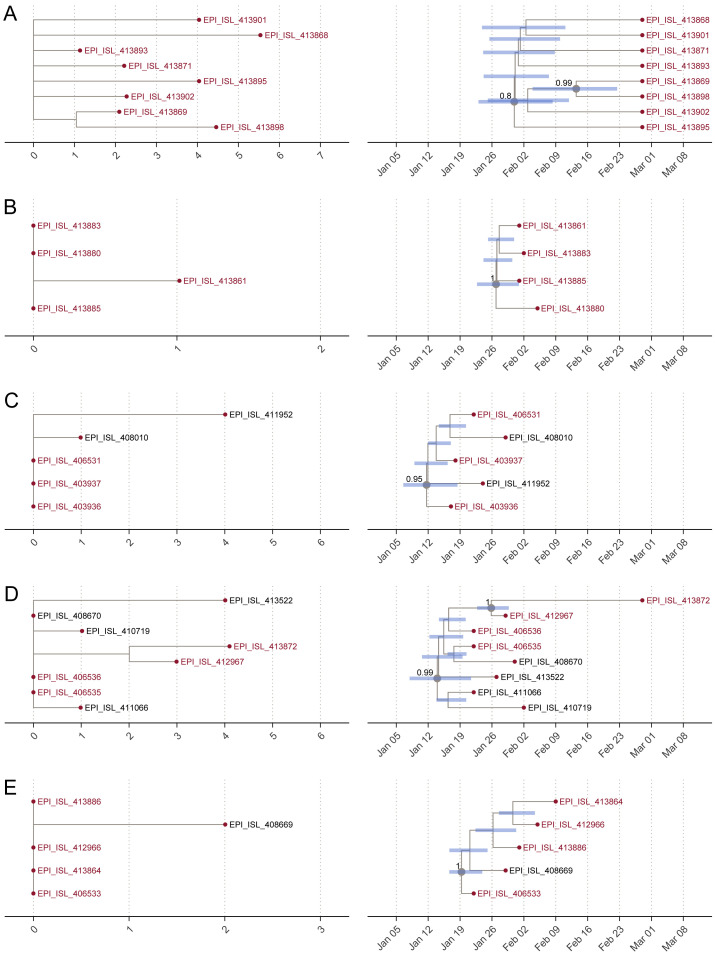
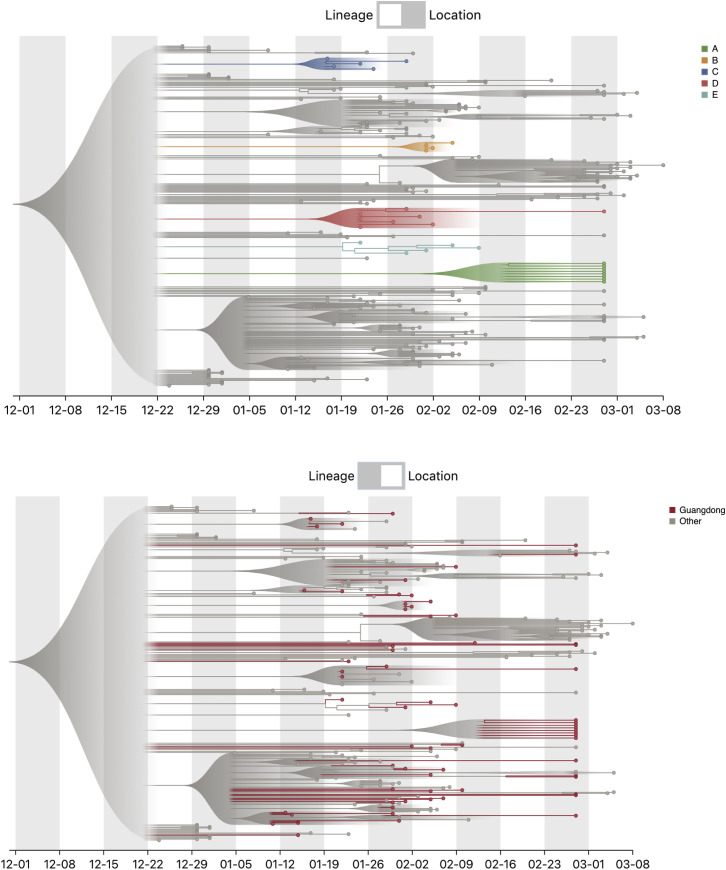
Coronavirus disease 2019 (COVID-19) is caused by SARS-CoV-2 infection and was first reported in central China in December 2019. Extensive molecular surveillance in Guangdong, China's most populous province, during early 2020 resulted in 1,388 reported RNA-positive cases from 1.6 million tests. In order to understand the molecular epidemiology and genetic diversity of SARS-CoV-2 in China, we generated 53 genomes from infected individuals in Guangdong using a combination of metagenomic sequencing and tiling amplicon approaches. Combined epidemiological and phylogenetic analyses indicate multiple independent introductions to Guangdong, although phylogenetic clustering is uncertain because of low virus genetic variation early in the pandemic. Our results illustrate how the timing, size, and duration of putative local transmission chains were constrained by national travel restrictions and by the province's large-scale intensive surveillance and intervention measures. Despite these successes, COVID-19 surveillance in Guangdong is still required, because the number of cases imported from other countries has increased.

Keywords: COVID-19; SARS-COV-2; genomic epidemiology; phylogenetics; real-time disease surveillance; virus evolution.


Conflict of interest statement

Declaration of Interests The authors declare no competing interests.

Figures

None
Graphical abstract
Figure 1
Figure 1
Summary of the COVID-19 Epidemic in Guangdong Province, China (A) Time series of the 1,388 laboratory-confirmed COVID-19 cases in Guangdong until 19th March 2020, by date of onset of illness. Cases are classified according to their likely exposure histories (see inset and main text). The dashed lines indicate the date the first Guangdong case was detected (19th January 2020) and the shutdown of travel from Wuhan (23rd January 2020). An overview of testing and surveillance strategies at different stages of the epidemic is illustrated below the time series, on the same timescale. (B) Geographic distribution of COVID-19 cases and human population density among the 21 prefecture-level divisions of Guangdong Province. See also Figure S1.
Figure S1
Figure S1
Time Series of Reported Cases and Sample Collection Dates, Related to Figure 1 (A) Time series of the 1388 laboratory-confirmed COVID-19 cases in Guangdong until 19th March, by date of onset of illness. Cases are classified according to their likely exposure histories (see inset). The solid line indicates the cumulative number of cases and the dashed lines indicate the date the first case was detected in Guangdong (19th January) and the shutdown of travel from Wuhan (23rd January). (B) Time series of the 53 SARS-CoV-2 genomes we report, by collection date. Genomes are classified according to patients’ likely exposure history. The collection dates of 17 previously released genomes sampled from patients in Guangdong are also shown.
Figure 2
Figure 2
Profile of SARS-CoV-2 Genome Sequences from Guangdong Province, China (A) Plot of SARS-CoV-2 genome coverage against real-time reverse transcription Ct value for the 53 genome sequences reported here. Each sequence is colored by sequencing approach: blue, BGI metagenomic sequencing; orange, multiplex PCR nanopore sequencing; green, Illumina metagenomic sequencing. (B) Real-time reverse transcription PCR Ct values for different sample types. (C) Real-time reverse transcription PCR Ct values for samples from patients with different disease severity; the “mild” category includes 2 asymptomatic cases. (D) Genome coverage map for the 53 genomes reported here, ordered by % genome coverage. Single nucleotide polymorphisms (with respect to the reference genome MN908947.3) are colored in red. Each genome is colored according to the sequencing approach used. (E) Genomic structure of SARS-CoV-2 and the genomic location and frequency of single nucleotide polymorphisms (with respect to the reference genome MN908947.3) among our 53 sequences. These mutations correspond to the red lines in (D). See also Figure S2, Table S1, and Data S1.
Figure S2
Figure S2
Plots of SARS-CoV-2 Genome Coverage against RT-PCR Ct Value and the Number of Mapped Reads for 104 Sequencing Runs Performed on 79 Clinical Samples, Related to Figure 2 Plots of SARS-CoV-2 genome coverage against RT-PCR Ct Value (A) and the number of mapped reads (B). Each sequence is colored by sequencing approach: blue = multiplex PCR nanopore sequencing, green = BGI metagenomic sequencing, orange = Illumina metagenomic sequencing. Open circles indicate sequences that were not reported here or used in phylogenetic analyses, either because of insufficient coverage, or because a higher-quality sequence existed for the same patient.
Figure 3
Figure 3
Phylogenetic Analyses of SARS-CoV-2 Genome Sequences from Guangdong Province, China (A) Estimated maximum likelihood phylogeny of SARS-CoV-2 sequences from Guangdong (red circles) and genomes from other countries and provinces (not circled). The axis is in units of nucleotide changes from the inferred root sequence. A phylogenetic bootstrap analysis was not performed due to the low number of phylogenetically informative sites and the number of missing bases (N) in the alignment. The position of clusters A–E discussed in main text are highlighted with red boxes and labeled. (B) Visualization of the corresponding time-scaled maximum clade credibility tree. Sequences from Guangdong and their terminal branches are in red and those from other locations in gray. The clusters (A–E) discussed in main text are highlighted with boxes and labeled. All nodes with posterior probabilities <0.5 have been collapsed into polytomies and their range of divergence dates are illustrated as shaded gray expanses. See also Figure S3, Figure S4, Figure S5.
Figure 4
Figure 4
Molecular Clock Analysis of the Five Phylogenetic Clusters of Guangdong Sequences that Were Supported with Posterior Probabilities >80% in Bayesian Phylogenetic Analysis (A) Daily number of local and imported COVID-19 cases in Guangdong province. The first reported case in Guangdong (January 19) and the shutdown of travel from Wuhan (January 23) are indicated by dashed lines. (B) Posterior distributions of the tMRCAs of the five phylogenetic clusters (A–E) from the molecular clock analysis (Figure 3B). Distributions are truncated at the upper and lower limits of the 95% HPD intervals; the vertical red lines indicate median estimates. Blue shading and horizontal red lines indicate the sampling period over which genomes in each cluster were collected. Dots indicate the collection dates of genomes, colored by sampling location (red, Guangdong; gray, other). See also Table S1.
Figure S3
Figure S3
Root-to-Tip Genetic Distance for 250 Sequences in the Maximum Likelihood Tree Plotted against Collection Date, Related to Figure 3 The Pearson correlation coefficient between root-to-tip distance and collection date is displayed in the top-right corner (r = 0.592). Sequences are colored by sampling location (Guangdong = red, other location = gray).
Figure S4
Figure S4
Details of the Clusters (A–E) of Guangdong Genome Sequences, Related to Figure 3 (A–E) Details of the clusters of Guangdong genome sequences. Extracts from the maximum-likelihood phylogeny are shown on the left and extracts from the maximum clade credibility (MCC) tree are shown on the right. Tip labels show GISAID accession number; those in red are from Guangdong and those in black are from other locations. Node bars on the MCC extracts indicate the 95% HPD interval of node ages. Nodes with posterior probability > 0.8 are labeled with a number and gray circle.
Figure S5
Figure S5
Screenshots of the Online Tree Visualization Tool, Related to Figure 3 The top image shows the 5 clusters A-E highlighted. The bottom image shows the genomes from Guangdong highlighted.

Comment in

References

    1. Ayres D.L., Darling A., Zwickl D.J., Beerli P., Holder M.T., Lewis P.O., Huelsenbeck J.P., Ronquist F., Swofford D.L., Cummings M.P. BEAGLE: an application programming interface and high-performance computing library for statistical phylogenetics. Syst. Biol. 2012;61:170–173. - PMC - PubMed
    1. Faria N.R., Kraemer M.U.G., Hill S.C., Goes de Jesus J., Aguiar R.S., Iani F.C.M., Xavier J., Quick J., du Plessis L., Dellicour S. Genomic and epidemiological monitoring of yellow fever virus transmission potential. Science. 2018;361:894–899. - PMC - PubMed
    1. Ferreira M.A., Suchard M.A. Bayesian analysis of elapsed times in continuous-time Markov chains. Can. J. Stat. 2008;36:355–368.
    1. Flightradar24 . 2020. Air traffic at China’s busiest airports down 80% since the beginning of the year.https://www.flightradar24.com/blog/air-traffic-at-chinas-busiest-airport...
    1. Grubaugh N.D., Ladner J.T., Kraemer M.U.G., Dudas G., Tan A.L., Gangavarapu K., Wiley M.R., White S., Thézé J., Magnani D.M. Genomic epidemiology reveals multiple introductions of Zika virus into the United States. Nature. 2017;546:401–405. - PMC - PubMed

Publication types