. 2020 Jun 4;78(5):951-959.e6.
doi: 10.1016/j.molcel.2020.04.006. Epub 2020 Apr 30.

BRCA1 Mutational Complementation Induces Synthetic Viability

Affiliations

BRCA1 Mutational Complementation Induces Synthetic Viability

Joseph Nacson et al. Mol Cell. .

Abstract

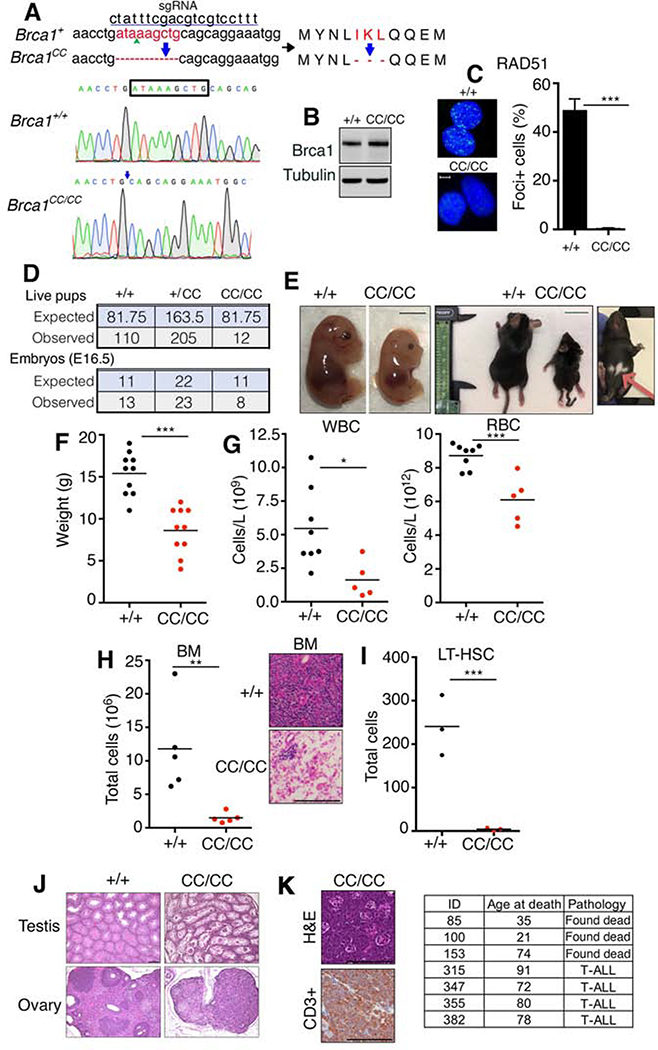
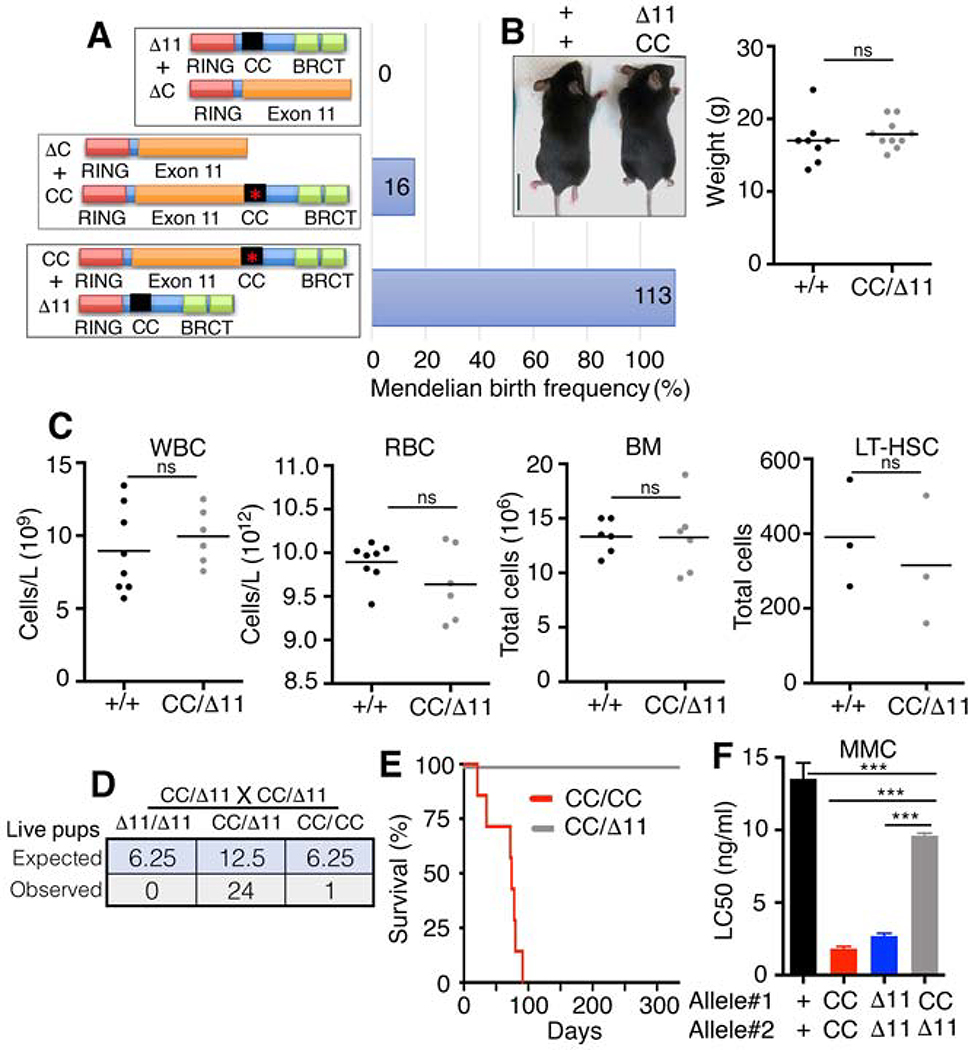
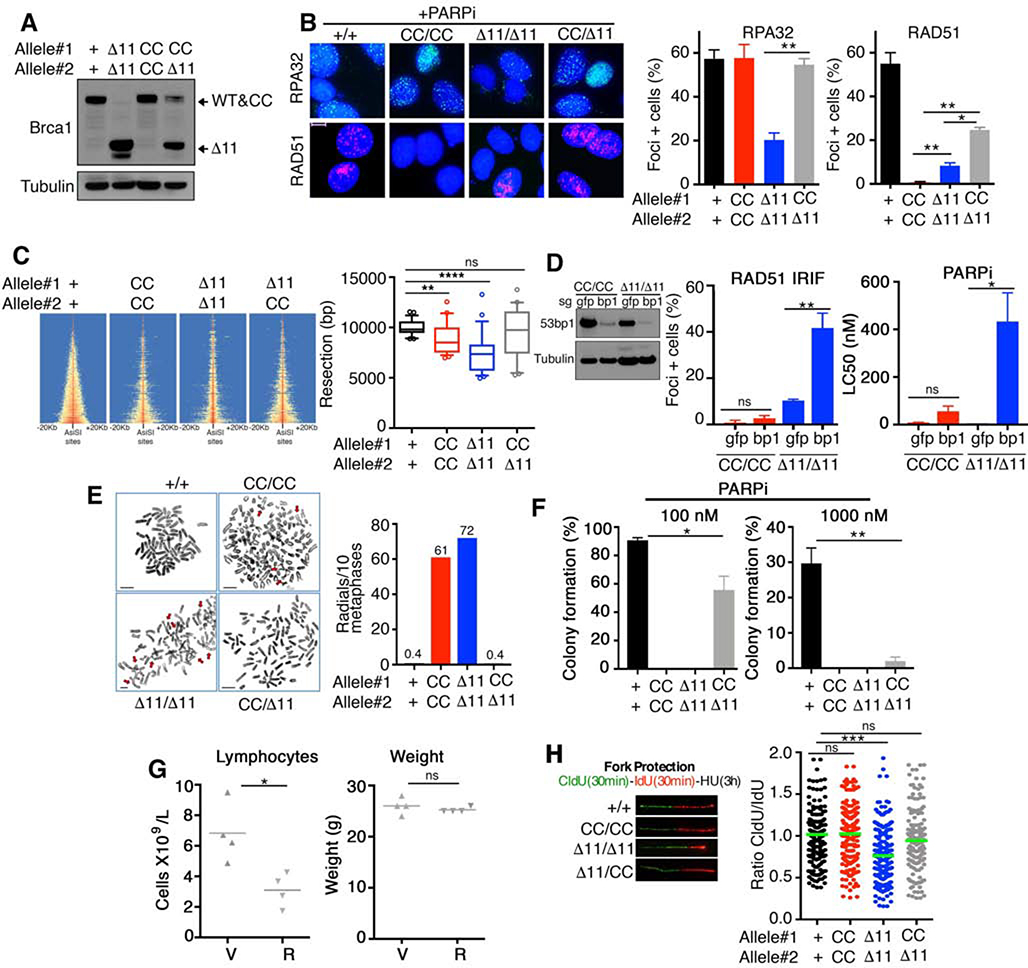
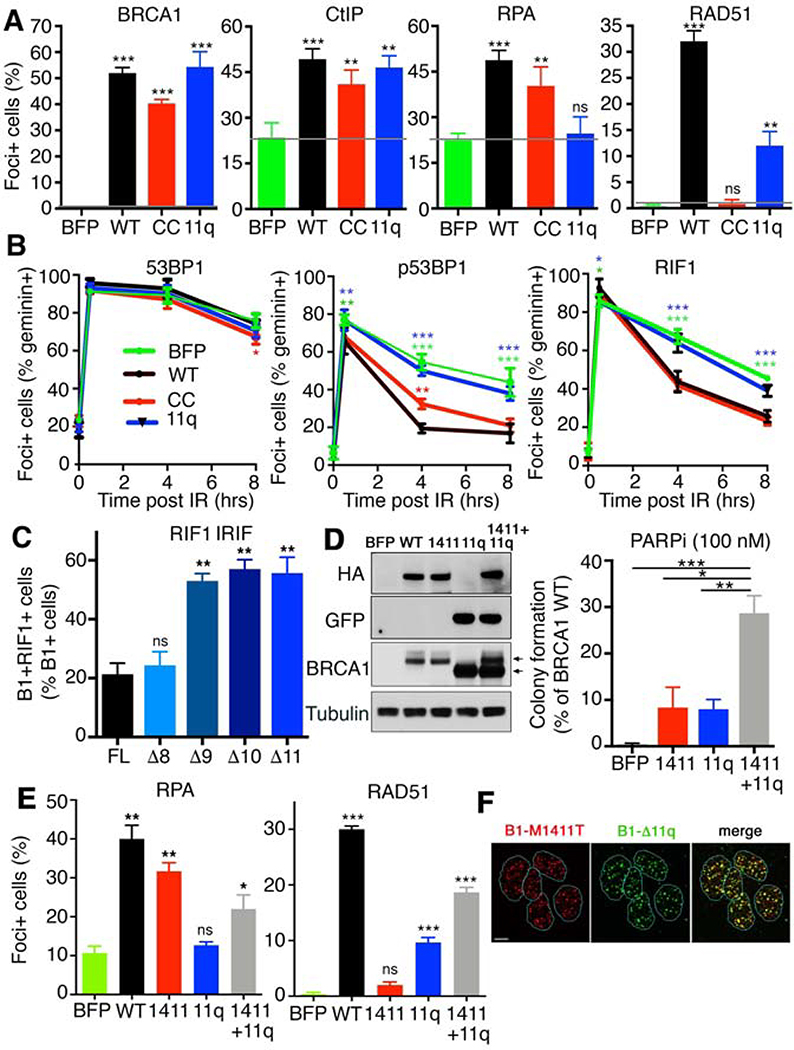
BRCA1 promotes the DNA end resection and RAD51 loading steps of homologous recombination (HR). Whether these functions can be uncoupled, and whether mutant proteins retaining partial activity can complement one another, is unclear and could affect the severity of BRCA1-associated Fanconi anemia (FA). Here we generated a Brca1CC mouse with a coiled-coil (CC) domain deletion. Brca1CC/CC mice are born at low frequencies, and post-natal mice have FA-like abnormalities, including bone marrow failure. Intercrossing with Brca1Δ11, which is homozygous lethal, generated Brca1CC/Δ11 mice at Mendelian frequencies that were indistinguishable from Brca1+/+ mice. Brca1CC and Brca1Δ11 proteins were individually responsible for counteracting 53BP1-RIF1-Shieldin activity and promoting RAD51 loading, respectively. Thus, Brca1CC and Brca1Δ11 alleles represent separation-of-function mutations that combine to provide a level of HR sufficient for normal development and hematopoiesis. Because BRCA1 activities can be genetically separated, compound heterozygosity for functional complementary mutations may protect individuals from FA.


Conflict of interest statement

Declaration of Interests The authors declare no conflicts of interest.

Figures

Fig 1.
Fig 1.. Brca1CC/CC mice have FA.
(A) The Brca1CC allele was generated using the indicated sgRNA sequence that targeted exon 13. DNA and amino acids deleted are shown (red). Below, electropherogram showing DNA sequences of Brca1+/+ and Brca1CC/CC mice, deleted base pairs (box) and deletion location (arrow) are indicated. (B) MEFs with the indicated genotypes were assessed for Brca1 protein expression by Western blotting. (C) MEFs with the indicated genotypes were assessed for RAD51 IRIF by immunofluorescence (IF). Nuclei with >5 foci were considered positive. Mean and S.E.M. are shown, n=3. Representative images, scale bar is 10 μm. (D) Summary of live pups born as well as live embryos at E16.5 generated from Brca1+/CC x Brca1+/CC intercross. (E) Representative photographs of E16.5 embryos, scale bar 0.5 cm; and 3-week old littermates, scale bar 2 cm. Hypopigmented fur area is indicated with an arrow. (F) Weights of individual mice at 3–4 weeks of age. (G) White blood cell (WBC), red blood cell (RBC) numbers from peripheral blood, and (H) mononuclear bone marrow (BM) cell numbers were measured in 3–4-week-old littermates with the indicated genotypes. Inset, representative H&E staining of BM, scale bar 100 μm. (I) Total number of long-term hematopoietic stem cells (LT-HSC) (Linlow; cKit+; Sca+; CD150+; CD48; CD34) analyzed by FACS in 3–4-week-old mice. See Fig. S1 for more information. (J) Representative H&E staining of testes and ovaries, scale bar 100 μm. (K) Representative images of T-ALL from a Brca1CC/CC mouse. H&E staining of thymic tumor and CD3+ staining of tumor cell infiltrates from the same mouse, scale bar 100 μm. Summary of Brca1CC/CC lifespans (days) and cause of death when known (inset). *p < 0.05 **p < 0.01, *** p < 0.001 (unpaired t-test).
Fig. 2.
Fig. 2.. Compound heterozygosity can rescue FA.
(A) Cartoon showing compound heterozygous allele combinations and potential Brca1 protein products with their observed live birth frequency as a percentage of the expected Mendelian live births. See Fig. S2A for tables. (B) Representative photographs of 3.5-week-old littermates, scale bar 2 cm. Weights of individual mice with the indicated genotypes at 3–4 weeks of age. (C) WBC, RBC, BM, and LT-HSCs were measured as described in Fig. 1. (D) Summary of live pups generated from Brca1CC/Δ11 x Brca1CC/Δ11 intercross. (E) Kaplan-Meyer analyses of survival showing Brca1CC/CC (n=7) and Brca1CC/Δ11 (n=20) mice. (F) MEFs were treated with MMC and colony formation assays performed. Mean and S.E.M. IC50 values are shown, n=3. *** p < 0.001 (unpaired t-test). Non-significant (ns) p > 0.05 (unpaired t-test).
Fig. 3.
Fig. 3.. Brca1 alleles confer distinct functional deficiencies.
(A) MEFs were assessed for Brca1 protein expression by Western blotting. Predicted isoform migration patterns are indicated. (B) RPA32 and RAD51 foci formation was measured by IF after treatment with 1 μM rucaparib for 24 hours. For each protein, a minimum of 100 nuclei per cell line were counted per experiment. Mean and S.E.M. percentages of cells containing 5 or more foci are shown (n=3). Representative foci images are inset, scale bar 10 μm. (C) Heatmap of END-seq signals across individual AsiSI sites in the indicated MEFs measured 5 h after AsiSI induction. (Right), boxplots showing the quantification of resection endpoints in the top 10% resected breaks in the indicated MEFs at AsiSI-cleaved DSB sites. Welch’s t test was used to determine statistical significance. (D) MEFs were subject to CRISPR/Cas9 and sgRNA targeting gfp or 53bp1 (bp1). Cells were subsequently assessed for RAD51 IRIF as described in Fig.1C (left), or treated with the PARPi rucaparib and colony formation assays performed (right), mean and S.D. are shown (n=3), inset western blotting showing 53bp1 (bp1) protein levels. (E) Metaphase spreads were prepared from the indicated genotypes of MEFs treated with 500 nM rucaparib for 24 hours. The mean number of radial chromosomes per 10 metaphases are shown. The number of metaphases assessed were 30 for Brca1+/+, 26 for Brca1CC/CC; 25 for Brca1Δ11/Δ11, and 25 for Brca1CC/Δ11 MEFs. Scale bars, 10 μm. Red arrows point to aberrations. (F) MEFs were treated with 100 nM (left) or 1000 nM (right) rucaparib for 2 weeks and assessed for colony formation. Mean and S.D. colony formation is shown as a percentage of DMSO treated cells, n = 3. (G) Brca1CC/Δ11 mice 5–6 weeks old were treated with vehicle (V) or 200 mg/kg rucaparib (R) bi-daily for 5 days and peripheral blood collected 2 days after the last dose. Blood was assessed for lymphocyte cell numbers (left) and mice measured for body weight (right). (H) MEFs were sequentially pulsed with 50 μM CldU for 30 min, 250 μM IdU for 30 min, and 2 mM hydroxyurea for 3h. DNA fiber tract lengths and are presented as CldU/ IdU length ratio. Inset, representative fibers. *p < 0.05 **p < 0.01, *** p < 0.001, ns p > 0.05 (unpaired t-test).
Fig. 4.
Fig. 4.. BRCA1 mutants have complimentary functions
(A) MDA-MB-436 cells expressing BFP control, HA-BRCA1WT, HA-BRCA1Δ11q, and HA-BRCA1CC were used to assess BRCA1, CtIP, RPA32, and RAD51 IRIF by IF. Mean and S.E.M. are shown, n=3, grey bar indicates BFP control levels. See Fig. S3B for representative foci images. (B) Cells from A were assessed for 53BP1, p(T543)53BP1, and RIF1 IRIF by IF after treatment with 2 Gy IR. Cells were also co-stained with geminin to distinguish S/G2 phase cells. Foci positive cells that were also geminin positive were quantified. Mean and S.D. are shown, n=3, *** p < 0.001; ** p < 0.01; * p < 0.05; no marking p > 0.05, compared to WT (two-way ANOVA corrected for multiple comparisons). See Fig. S3D for representative foci images. (C) BRCA1 cDNA constructs from Fig. S4A, including full-length (1863aa), and exon 11 deletions of the central 800 (Δ8), 900 (Δ9), 1000 (Δ10), 11000 aa’s (Δ11) were expressed in MDA-MB-436 cells and assessed for BRCA1 and RIF1 IRIF. The mean and S.E.M. number of BRCA1 foci positive cells that also contained RIF1 foci were quantified. Representative images are shown, see Fig. S4C for images. ** p < 0.01; ns p > 0.05, unpaired t-test compared to FL. (D) MDA-MB-436 cells expressing a BFP control, BRCA1*WT, BRCA1*M1411T, BRCA1Δ11q, and BRCA1*M1411T+ BRCA1Δ11q were incubated with 100 nM PARPi for 2 weeks and colony formation assessed. Mean and S.E.M. colonies relative to BRCA1*WT cells are shown, n=3. Inset, Western blot showing HA, GFP and BRCA1 protein expression, upper and lower arrows indicate migration of BRCA1* and BRCA1Δ11q, respectively. (E) Cells from D were assessed for RPA32 and RAD51 IRIF as described in A. *** p < 0.001; ** p < 0.01; * p < 0.05; ns p > 0.05, unpaired t-test compared to BFP. (F) BRCA1*M1411T+BRCA1Δ11q cells were assessed for HA (M1411T) and GFP (Δ11q) IRIF. Representative image of GFP and HA foci positive cells, scale bar is 10 μm.

References

    1. Anantha RW, Simhadri S, Foo TK, Miao S, Liu J, Shen Z, Ganesan S, and Xia B (2017). Functional and mutational landscapes of BRCA1 for homology-directed repair and therapy resistance. Elife 6. - PMC - PubMed
    1. Bryant HE, Schultz N, Thomas HD, Parker KM, Flower D, Lopez E, Kyle S, Meuth M, Curtin NJ, and Helleday T (2005). Specific killing of BRCA2-deficient tumours with inhibitors of poly(ADP-ribose) polymerase. Nature 434, 913–917. - PubMed
    1. Canela A, Sridharan S, Sciascia N, Tubbs A, Meltzer P, Sleckman BP, and Nussenzweig A (2016). DNA Breaks and End Resection Measured Genome-wide by End Sequencing. Mol Cell 63, 898–911. - PMC - PubMed
    1. Chapman JR, Sossick AJ, Boulton SJ, and Jackson SP (2012). BRCA1-associated exclusion of 53BP1 from DNA damage sites underlies temporal control of DNA repair. Journal of cell science 125, 3529–3534. - PMC - PubMed
    1. Chaudhuri AR, Callen E, Ding X, Gogola E, Duarte AA, Lee JE, Wong N, Lafarga V, Calvo JA, Panzarino NJ, et al. (2016). Replication fork stability confers chemoresistance in BRCA-deficient cells. Nature 535, 382–387. - PMC - PubMed

Publication types

MeSH terms