. 2020 May;30(5):368-388.
doi: 10.1016/j.nmd.2020.02.018. Epub 2020 Mar 4.

Cognitive impairment appears progressive in the mdx mouse

Affiliations

Cognitive impairment appears progressive in the mdx mouse

Emine Bagdatlioglu et al. Neuromuscul Disord. 2020 May.

Abstract

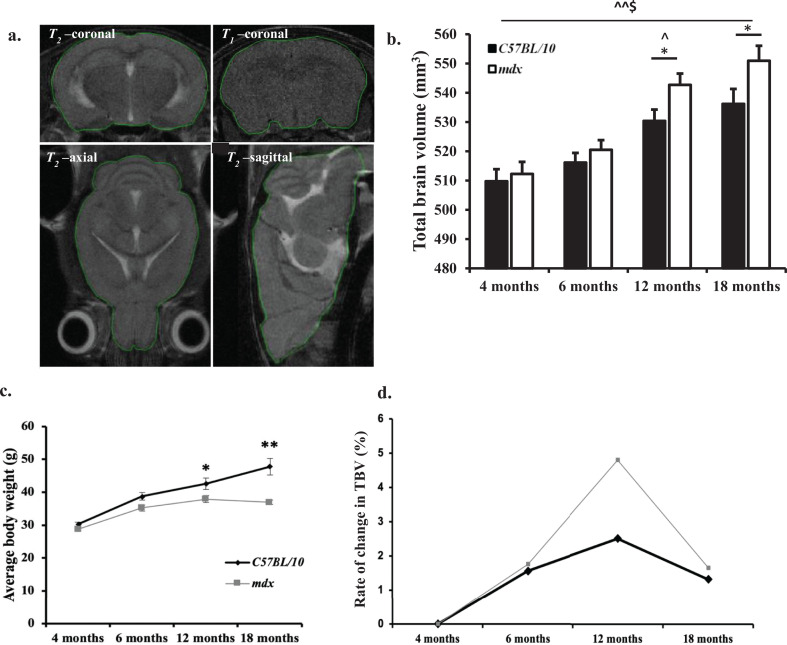
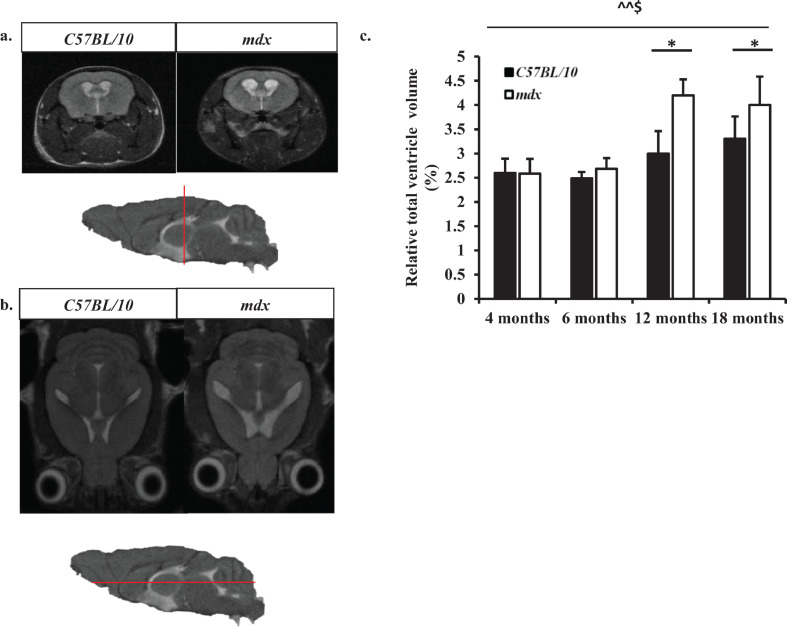
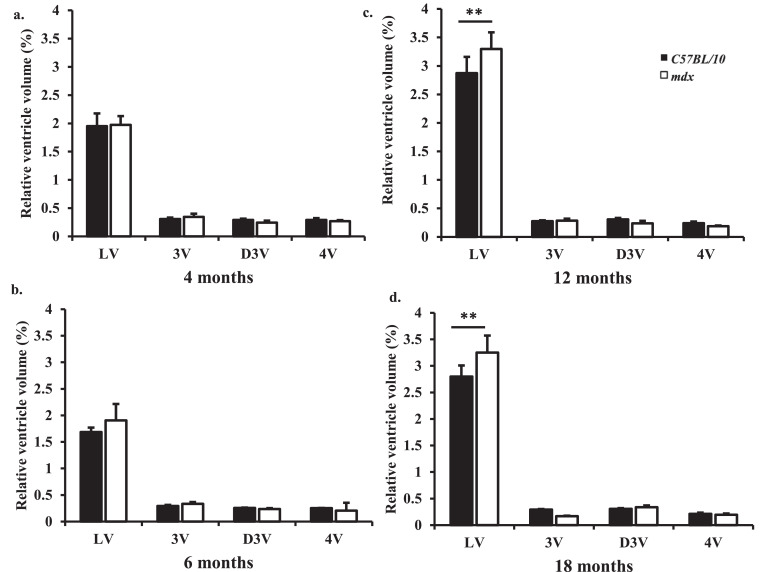
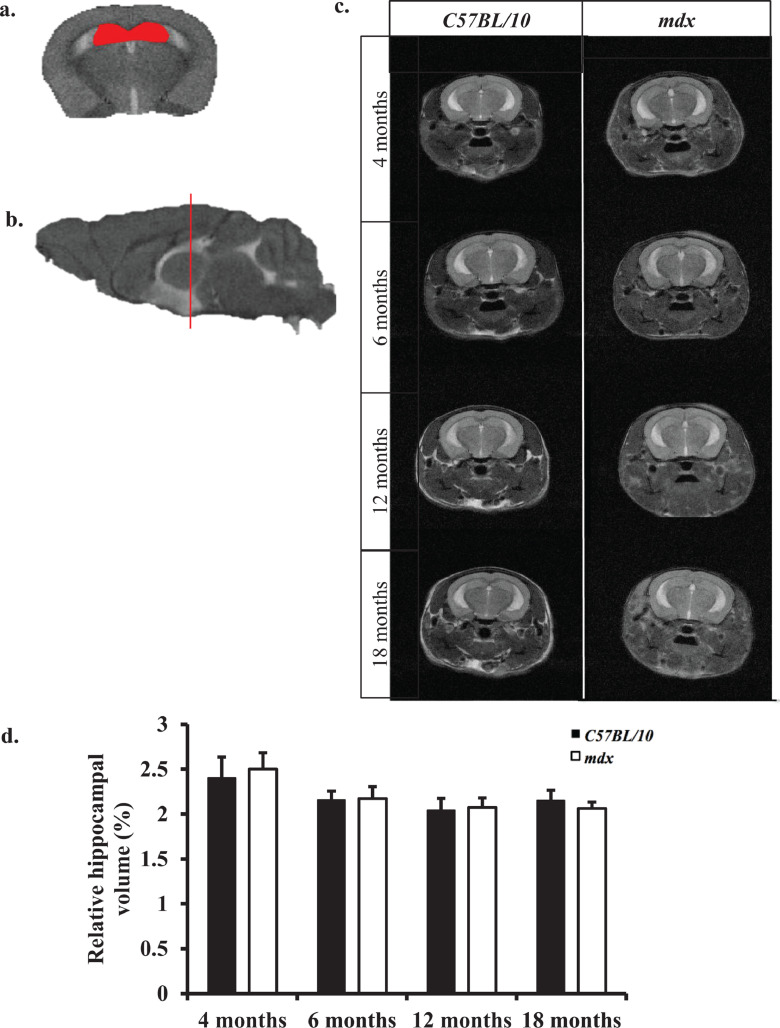
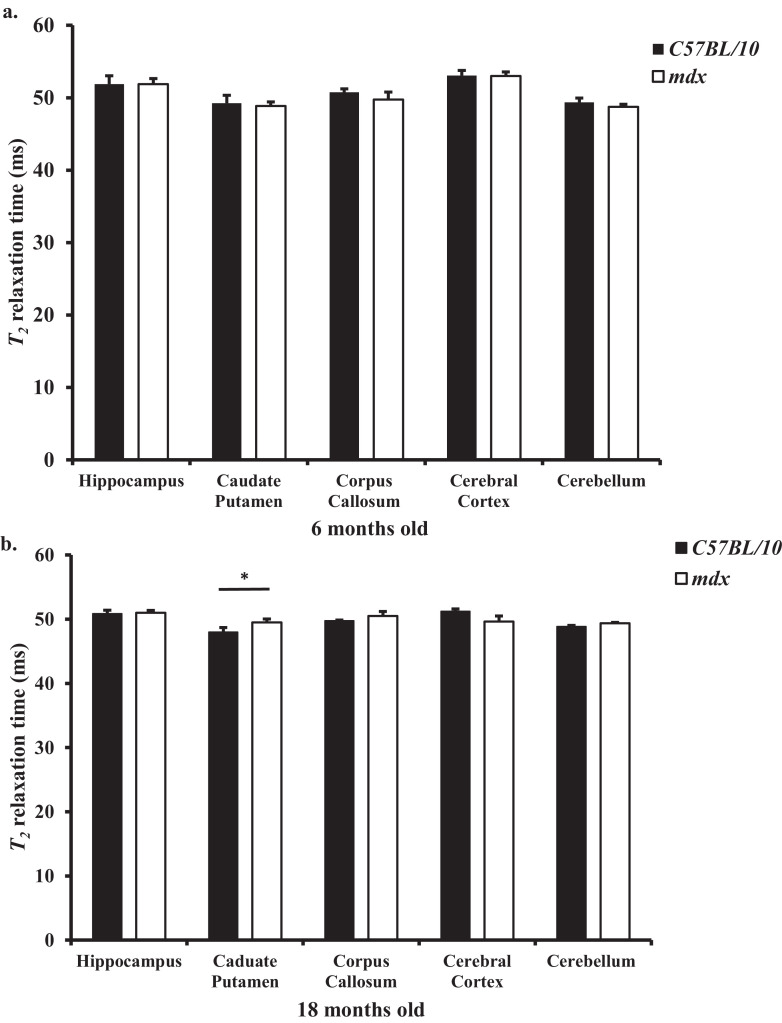
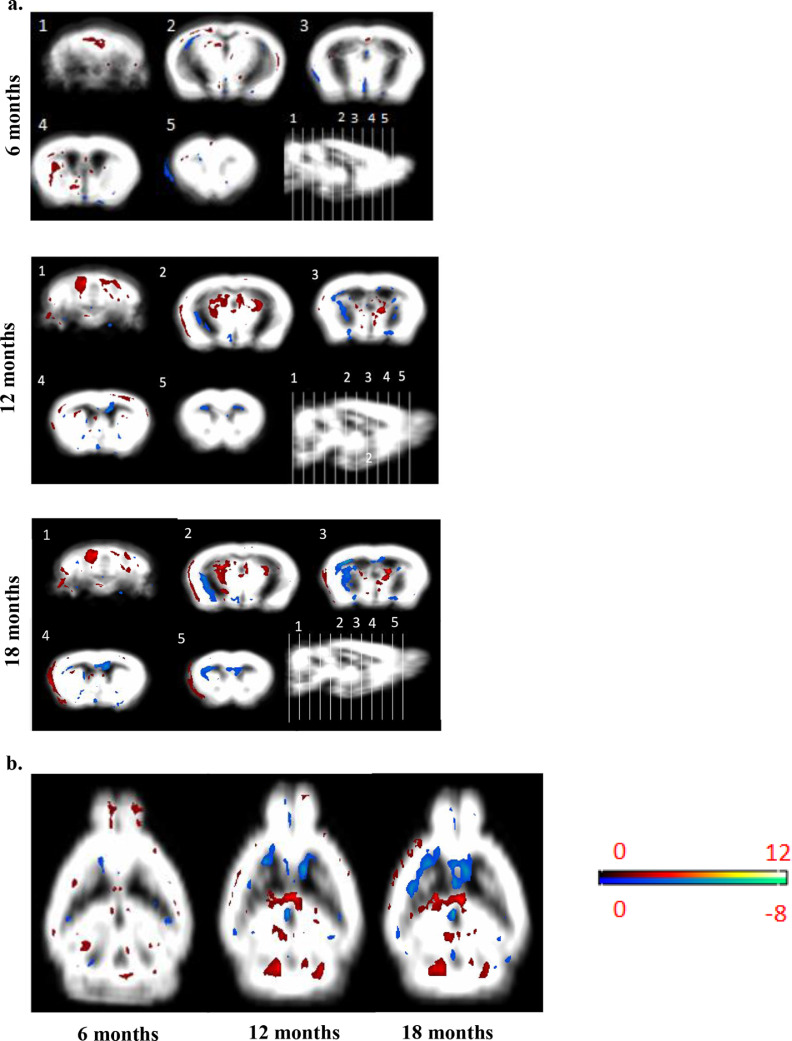
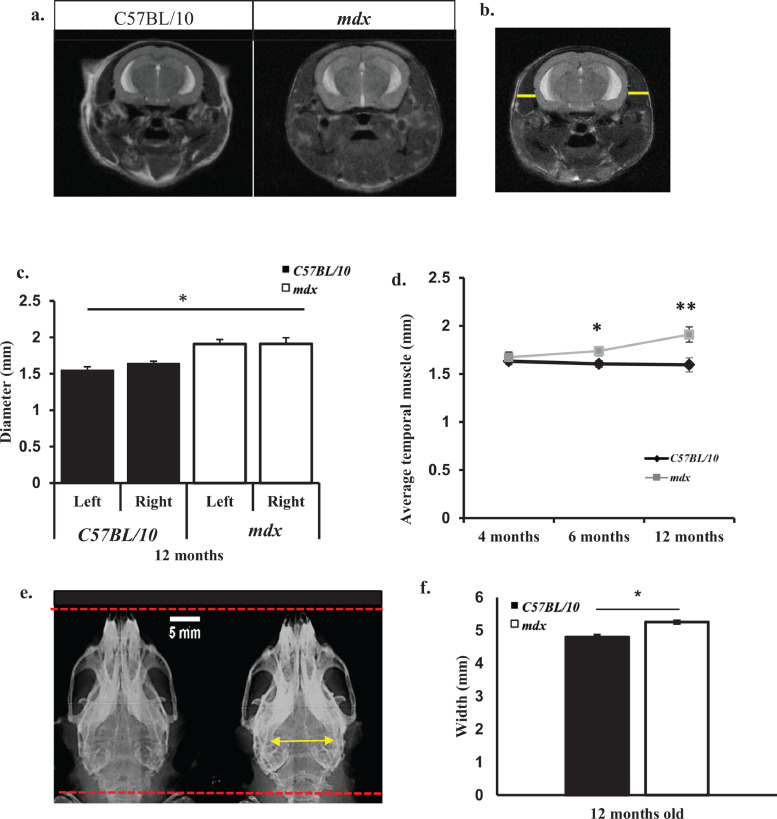
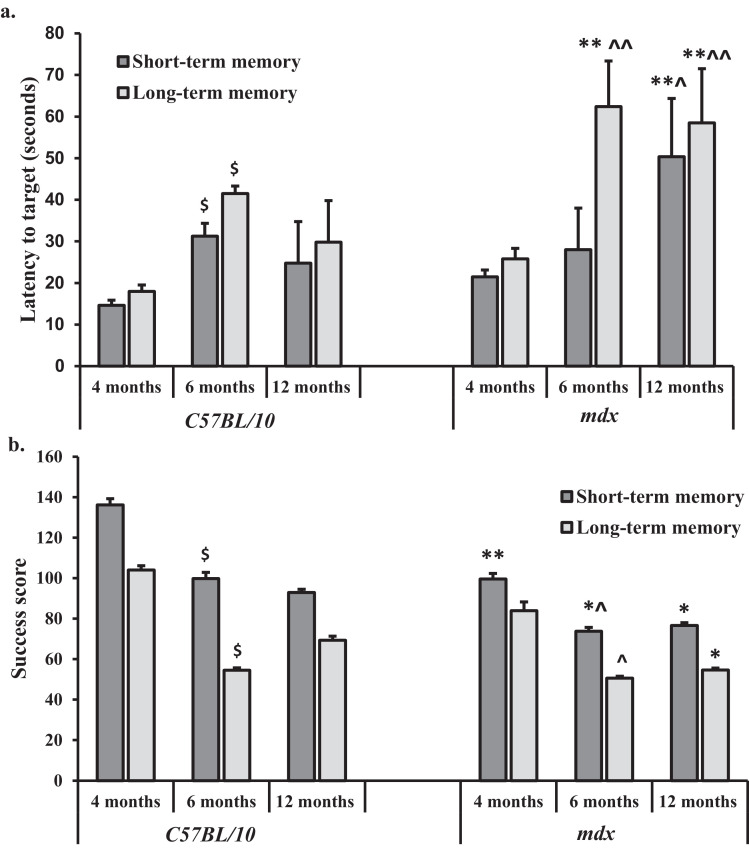
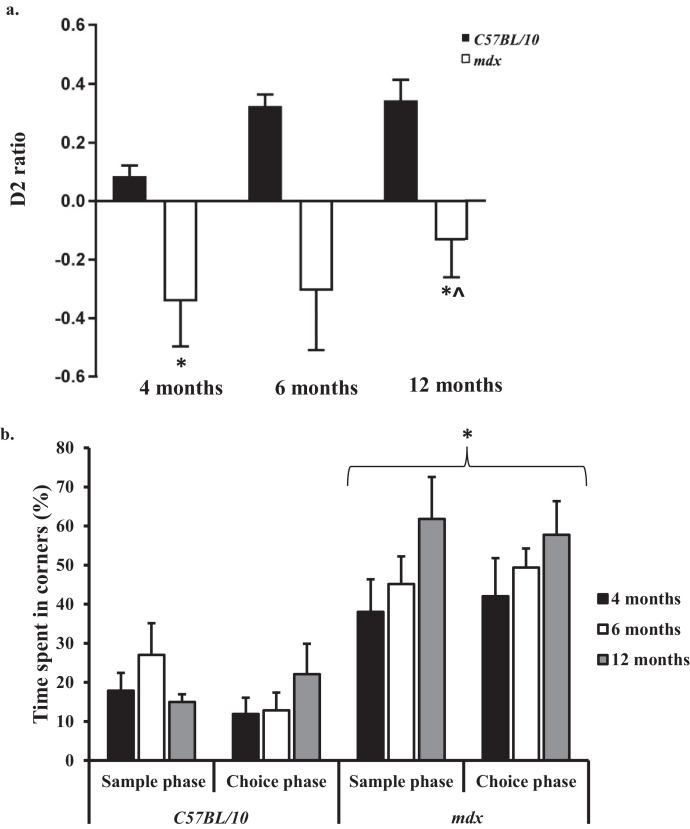
Duchenne muscular dystrophy (DMD) is an X-linked recessive muscle wasting disease caused by mutations in the DMD gene, which encodes the large cytoskeletal protein dystrophin. Approximately one-third of DMD patient's exhibit cognitive problems yet it is unknown if cognitive impairments worsen with age. The mdx mouse model is deficient in dystrophin demonstrates cognitive abnormalities, but no studies have investigated this longitudinally. We assessed the consequences of dystrophin deficiency on brain morphology and cognition in male mdx mice. We utilised non-invasive methods to monitor CNS pathology with an aim to identify changes longitudinally (between 4 and 18 months old) which could be used as outcome measures. MRI identified a total brain volume (TBV) increase in control mice with ageing (p < 0.05); but the mdx mice TBV increased significantly more (p < 0.01). Voxel-based morphometry (VBM) identified decreases in grey matter volume, particularly in the hippocampus of the mdx brain, most noticeable from 12 months onwards, as were enlarged lateral ventricles in mdx mice. The caudate putamen of older mdx mice showed increases in T2- relaxometry which may be considered as evidence of increased water content. Hippocampal spatial learning and memory was decreased in mdx mice, particularly long-term memory, which progressively worsened with age. The novel object recognition (NOR) task highlighted elevated anxiety-related behaviour in older mdx mice. Our studies suggest that dystrophin deficiency causes a progressive cognitive impairment in mice (compared to ageing control mice), becoming evident at late disease stages, and may explain why progressive CNS symptoms are not obvious in DMD patients.

Keywords: Cognitive behaviour; Duchenne muscular dystrophy (DMD); Magnetic resonance imaging (MRI); Mdx mouse.


Figures

Fig. 1
Fig. 1
a–c: Longitudinal total brain volume (TBV) measurements. a. Representative images demonstrating the method used for estimation of total brain volume (TBV) in all mice using the polygon tool in ImageJ. The outline of each brain structure from representative T1-w coronal and T2-w -coronal, -axial and -sagittal images are delineated in green. b. Bar graph displaying longitudinal comparison of TBV. MRI derived TBV for mice at 4 months old, 6 months old, 12 months old and 18 months old (n = 8 mice per genotype at each time point). The control mouse brain increased in volume between 4 and 18 months old (p < 0.05). The mdx mice had a larger TBV compared to control mice from 12 months onwards (p < 0.01). Between 12 and 18 months old the mdx mice had a significantly larger TBV compared to control mice (p < 0.05). c. Line graph showing average body weights of mice used for the longitudinal MR imaging study. At 4 months old all mice have a comparable body weight. Between 12 and 18 months mdx mice begin to lose weight whereas control mice gain weight. Data presented as mean ± SEM, *p < 0.05, **p < 0.01 for control vs. mdx, ^p < 0.05, ^^p < 0.01 for changes observed with ageing in mdx mice, $<p.0.05 for changes observed with ageing in control mice. d. Line graph displaying the rate of change in TBV between 4 and 18 months old in control C57BL/10 and mdx mice.
Fig. 2
Fig. 2
a–c: Longitudinal ventricular volume measurements a. Representative T2-w coronal MR images displaying increased lateral ventricles in mdx mice at 12 months old. Sagittal images where the red line indicates approximately where the coronal slice was acquired through the mouse brain. b. Representative T2-w axial MR images displaying increased lateral ventricle volume in mdx mice at 18 months old. Sagittal images where the red line indicates approximately where the axial slice was acquired through the mouse brain. c. Bar graph displaying the relative total ventricle volume between 4 and 18 months old. Relative total ventricle volume is calculated based on the total volume of the ventricle system expressed as a percentage of total brain volume. At 4 and 6 months old there was no difference between control and mdx total ventricle volume (p > 0.05). However, between 12 and 18 months old the mdx mice had a significantly higher total ventricle volume compared to age matched control mice (p < 0.05). Additionally, the relative total ventricle volume increased between 4 and 18 months old in both genotypes, but this increased volume was substantially larger in mdx mice (p < 0.01) compared to control mice (p < 0.05). Data presented as mean ± SEM, *p < 0.05, **p < 0.01 for control vs. mdx, ^p < 0.05, ^^p < 0.01 for changes observed with ageing in mdx mice, $<p.0.05 for changes observed with ageing in control mice.
Fig. 3
Fig. 3
a–d: Bar graphs displaying relative ventricle volume between 4 and 18 months old. LV= lateral ventricles, 3V= third ventricle, D3V= dorsal third ventricle and 4V= fourth ventricle. a. Relative ventricle volume at 4 months old showing no difference in ventricle volume between control and mdx mice. b. Relative ventricle volume at 6 months old showing increased volume of the LVs in mdx mice but was not found to be significant (P = 0.06). c. Relative ventricle volume at 12 months old showing increased LV volume in mdx mice compared to aged matched control mice (p<0.01). d. Relative ventricle volume at 18 months old showing increased LV volume in mdx mice compared to aged matched control mice (p < 0.01). Data presented as mean ± SEM, *p < 0.05, ** p < 0.01, n = 8 mice per genotype at each time point.
Fig. 4
Fig. 4
a–e: Longitudinal cerebellar volume measurements. a. Representative coronal T2- w MR image of control mouse cerebellum delineated in red following ROI analysis in ImageJ. b. T2-w coronal MR image showing the paraflocculus and floculus lobules of the lateral cerebellum (red arrows) included in total cerebellar volume measurements. c. Sagittal T2-w MR image where red line indicates approximately where the coronal slice was acquired through the mouse brain. d. Representative T2-w images displaying the cerebellum from the same control and mdx mice between 6 and 18 months old. No gross anatomical differences were observed. e. Bar graph displaying relative cerebellar volume at all-time points investigated. We detected no changes in the relative cerebellar volume between control and mdx mice between 6 and 18 months old (p > 0.05). Relative cerebellar volume is calculated based on the total volume of the cerebellum expressed as a percentage of total brain volume. Data presented as mean ± SEM, n = 8 mice per genotype at each time point.
Fig. 5
Fig. 5
a–d: Longitudinal hippocampal volume measurement. a. Representative coronal T2-w MR image of control mouse hippocampus (red insert) following ROI analysis in ImageJ. b. Sagittal T2-w MR image where red line indicates approximately where the coronal slice was acquired through the mouse brain. c. Representative T2-w images displaying the hippocampus from the same control and mdx mice between 6 and 18 months old. No gross anatomical differences were observed. d. Bar graph displaying relative hippocampal volume at all-time points investigated. Relative hippocampal volume is calculated based on the total volume of the hippocampus expressed as a percentage of total brain volume. We detected no changes in the relative hippocampal volume between control and mdx mice between 6 and 18 months old (p > 0.05). Data presented as mean ± SEM following students t-test for control vs. mdx mice, n = 8 mice per genotype at each time point.
Fig. 6
Fig. 6
a,b: Comparison of T2 relaxation times of each selected brain region between control and mdx mice. a. At 6 months old there was no difference in the relaxation rate in any ROI between the control and mdx mice. b. At 18 months there was an elevated T2 relaxation rate in the caudate putamen of mdx mice compared to aged matched control mice (p < 0.05). Data are presented as mean ± SEM, *p < 0.05, n = 4 mice per genotype at each time point.
Fig. 7
Fig. 7
a,b: Presentation of the VBM results produced by the SPM12 software with the SPMMouse plugin for grey matter of control versus mdx at various time points. The grey matter average shown is for the control mice and a coloured overlay showing the location of significant clusters. Red clusters indicate where control mouse brain is larger than mdx brain and blue indicates where mdx brain is larger than control brain. Colour intensity on the scale bar refers to the level of significance with a lighter colour indicating a higher level of significance (p < 0.05, student's t-test). a. Coronal images numbered 1–5 with corresponding sagittal image detailed image plane. (Grey matter average is from 8 control mice). b. Axial grey matter slices detailing VBM findings.
Fig. 8
Fig. 8
a–e: Bilateral temporal muscle hypertrophy in mdx mice. a. Representative T2-weighted coronal images showing changes in head shape of the mdx mouse. There is hypertrophy of the temporal muscle in mdx mice causing a change in head shape compared to age matched control mice. b. Representative image demonstrating temporal muscle thickness measurements (yellow lines). c. There is bilateral temporal muscle hypertrophy in mdx mice at 12 months old compared to aged matched control mice. d. Evolution of the temporal muscle thickness (averaged values for left and right) with age in control and mdx mice e. Representative radiographs of the mouse skull aged 12 months old (n = 4 mice per genotype). Yellow arrow represents widening of the squamosal bones. f. Bar graph displaying the widening of the squamosal bones in mdx mice at 12 months old compared to aged matched control mice (p<0.05). Data are presented as mean ± SEM, *p < 0.05, **p < 0.01 for control vs. mdx mice, n = 8 mice per genotype at each time point unless otherwise stated.
Fig. 9
Fig. 9
a,b: Latency to find the target hole (TH) and the success scores during Barnes maze testing. a. Short-term and long-term memory retention on the Barnes maze test. Short-term memory and long-term memory were assessed on day five and day twelve, respectively. A single trial was given to each mouse on the Barnes maze and the primary and total errors and latency(s) were evaluated as in the acquisition phase. b. Success score (hole value multiplied by the number of head pokes) observed during short and long-term memory retention trials. The highest success scores are observed during the short-term memory retention trials across all genotypes. The mdx mice had the lowest success score, at all-time points, for both short and long-term memory compared to aged matched control mice. Data presented as mean ± SEM, *p < 0.05, **p < 0.01 for control vs. mdx, ^p < 0.05, ^^p < 0.01 for changes observed with ageing in mdx mice, $<p.0.05 for changes observed with ageing in control mice.
Fig. 10
Fig. 10
a,b: Bar graphs displaying novel object recognition (NOR) task results. a. Comparison of D2 ratios between 4 and 12 months old. The control mice had an increasing D2 ratio between 4 and 12 months old demonstrating an increased preference for the novel object. The mdx mice showed an increased preference for the familiar object at all-time points; however, the D2 ratio increased over time as the mice spent less time exploring the object in total. b. Bar graph displaying the amount of time that mice spent in the corners of the NOR arena between 4 and 12 months old. The control mice spent considerably less time in the corners during both the sample and choice phase compared to the mdx mice. At 4, 6 and 12 months old the mdx mice spent significantly longer in the corners during the sample and choice phases of NOR and this time increased with increasing age compared to control mice (p < 0.05). Data presented as mean ± SEM, *p < 0.05, **p < 0.01 for control vs. mdx, ^p < 0.05, ^^p < 0.01 for changes observed with ageing in mdx mice, $<p.0.05 for changes observed with ageing in control mice.

References

    1. Emery A.E. Population frequencies of inherited neuromuscular diseases–a world survey. Neuromuscul Disord. 1991;1(1):19–29. - PubMed
    1. Mah J.K., Korngut L., Dykeman J., Day L., Pringsheim T., Jette N. A systematic review and meta-analysis on the epidemiology of Duchenne and Becker muscular dystrophy. Neuromuscul Disord. 2014;24(6):482–491. - PubMed
    1. Wallace G.Q., McNally E.M. Mechanisms of muscle degeneration, regeneration, and repair in the muscular dystrophies. Annu Rev Physiol. 2009;71:37–57. - PubMed
    1. Davies K.E., Smith T.J., Bundey S., Read A.P., Flint T., Bell M. Mild and severe muscular dystrophy associated with deletions in Xp21 of the human X chromosome. J Med Genet. 1988;25(1):9–13. - PMC - PubMed
    1. Hoffman E.P., Brown R.H., Jr., Kunkel L.M. Dystrophin: the protein product of the Duchenne muscular dystrophy locus. Cell. 1987;51(6):919–928. - PubMed

MeSH terms