

Prognostic and predictive value of a five-molecule panel in resected pancreatic ductal adenocarcinoma: A multicentre study
- PMID: 32361251
- PMCID: PMC7195527
- DOI: 10.1016/j.ebiom.2020.102767
Prognostic and predictive value of a five-molecule panel in resected pancreatic ductal adenocarcinoma: A multicentre study
Abstract
Background: Pancreatic ductal adenocarcinoma (PDAC) has a devastating prognosis. The performance of clinicopathologic parameters and molecules as prognostic factors remains limited and inconsistent. The present study aimed to construct a multi-molecule biomarker panel to more accurately predict post-resectional prognosis of PDAC patients.
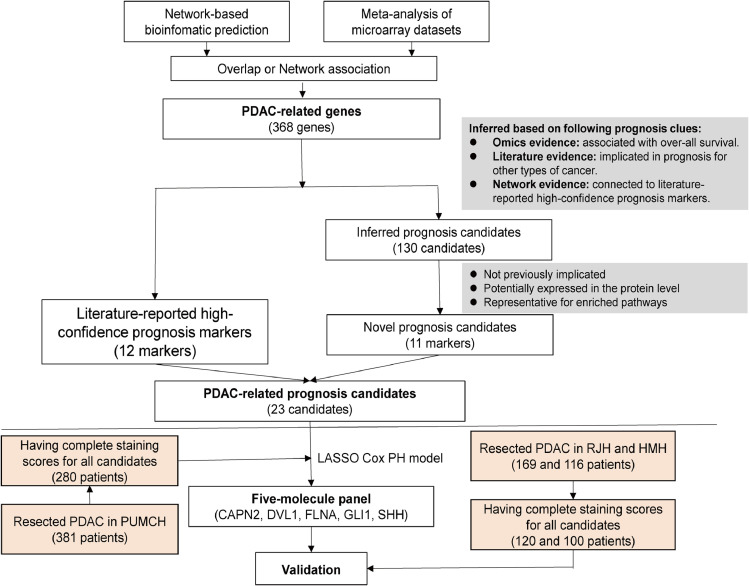
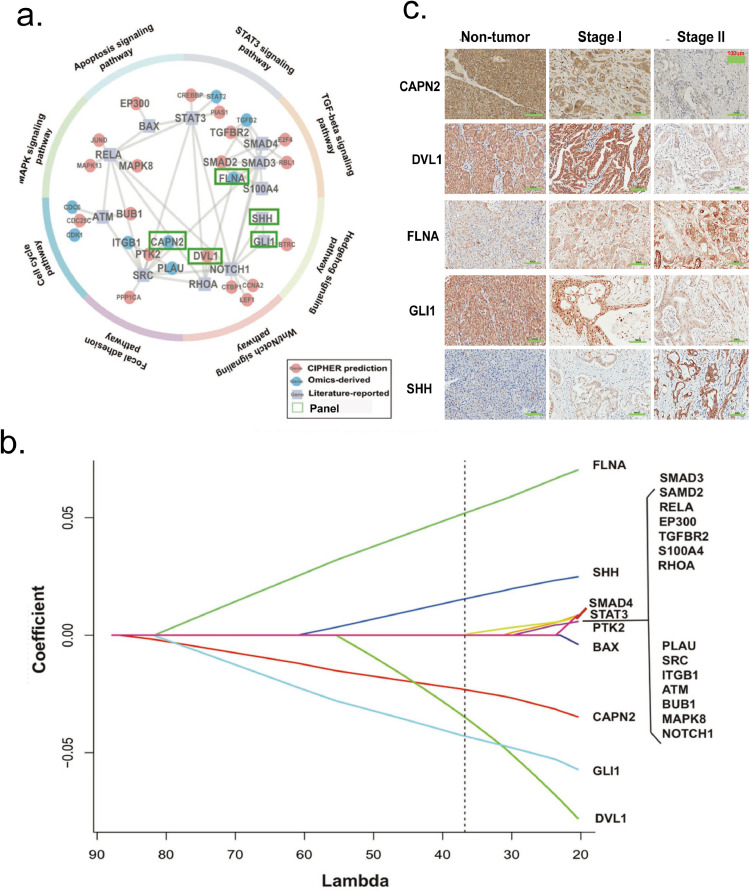
Methods: Firstly, a novel computational strategy integrating prognostic evidence from omics and literature on the basis of bioinformatics prediction (CIPHER) to generate the network, was designed to systematically identify potential high-confidence PDAC-related prognostic candidates. After specimens from 605 resected PDAC patients were retrospectively collected, 23 candidates were detected immunohistochemically in tissue-microarrays for the development cohort to construct a multi-molecule panel. Lastly, the panel was validated in two independent cohorts.
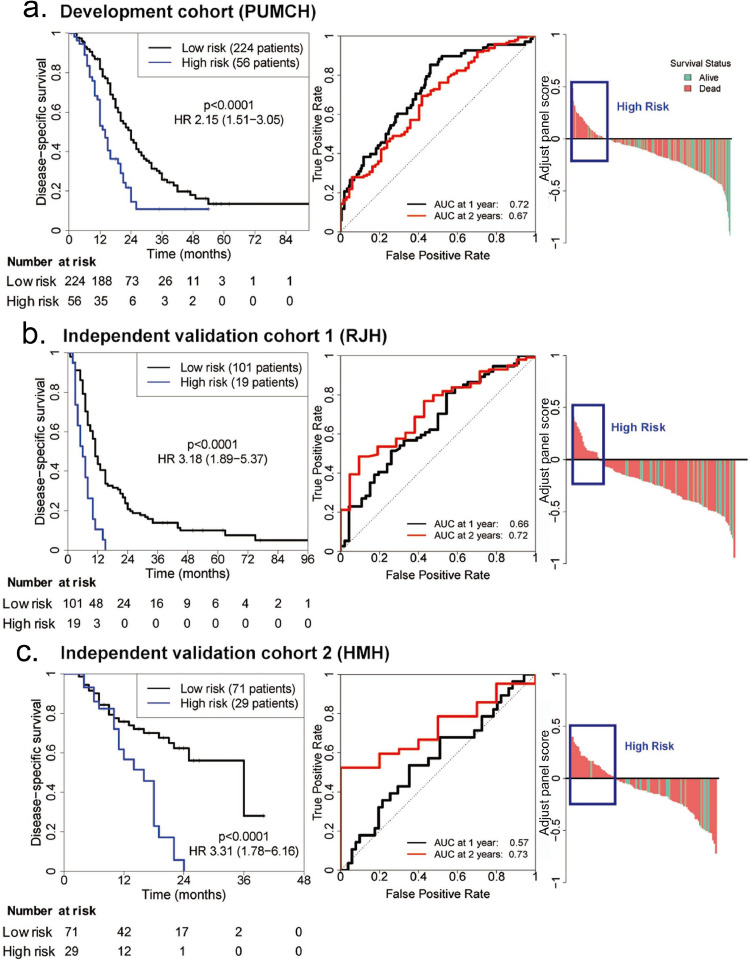
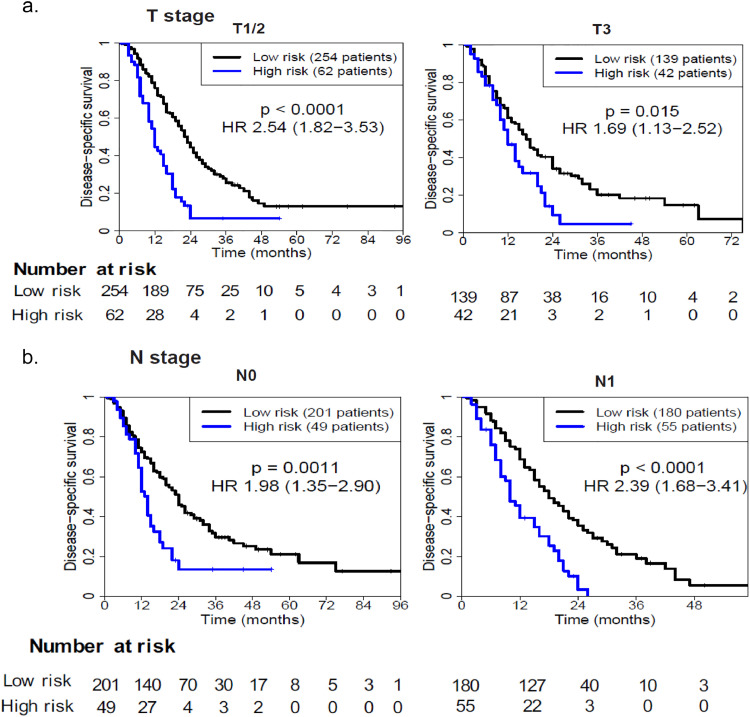
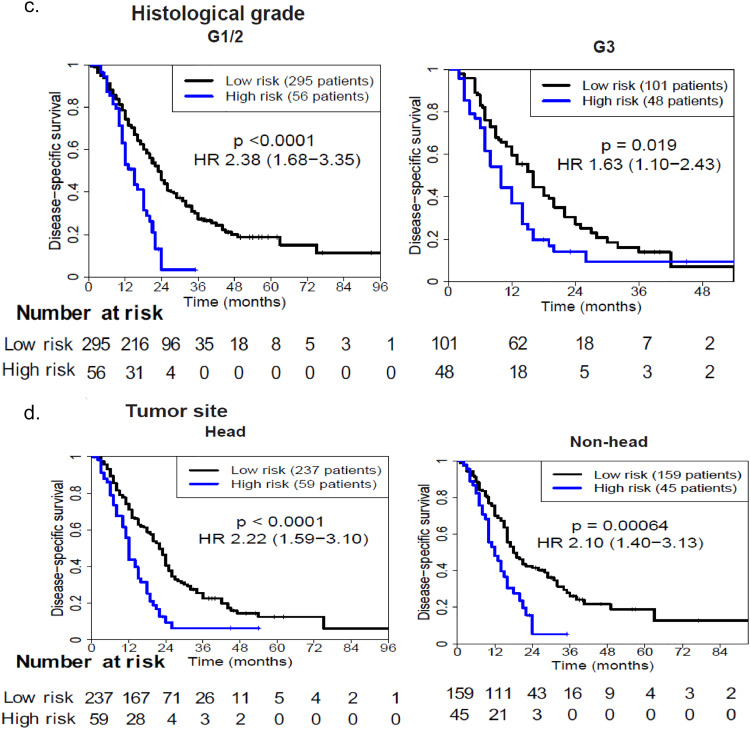
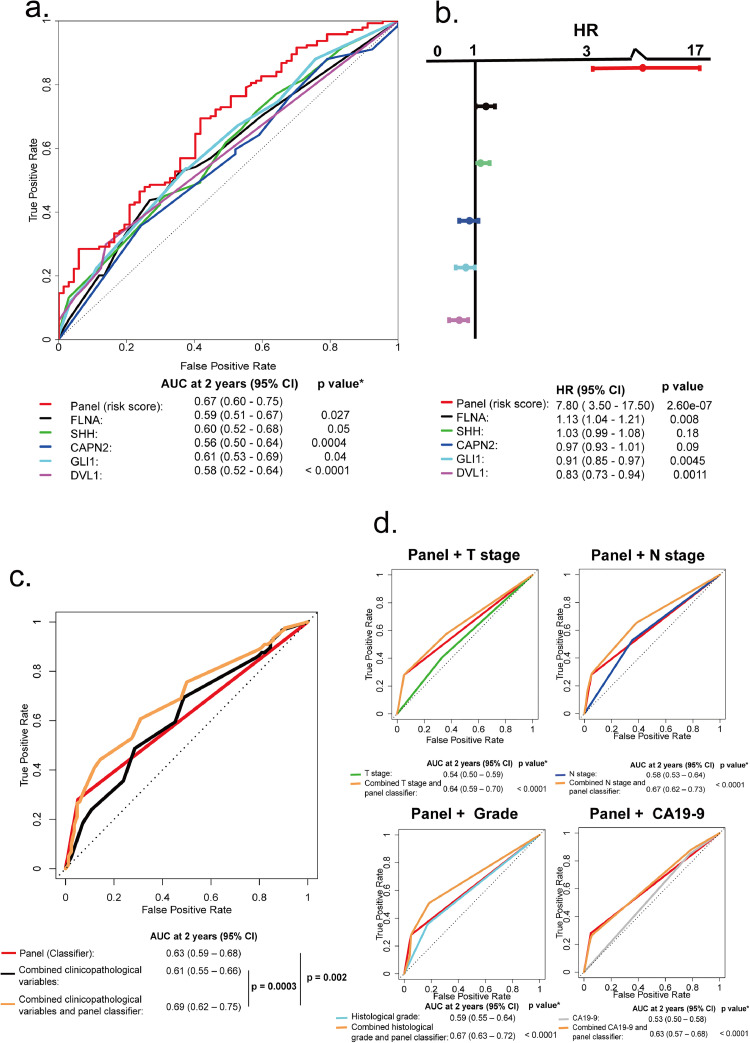
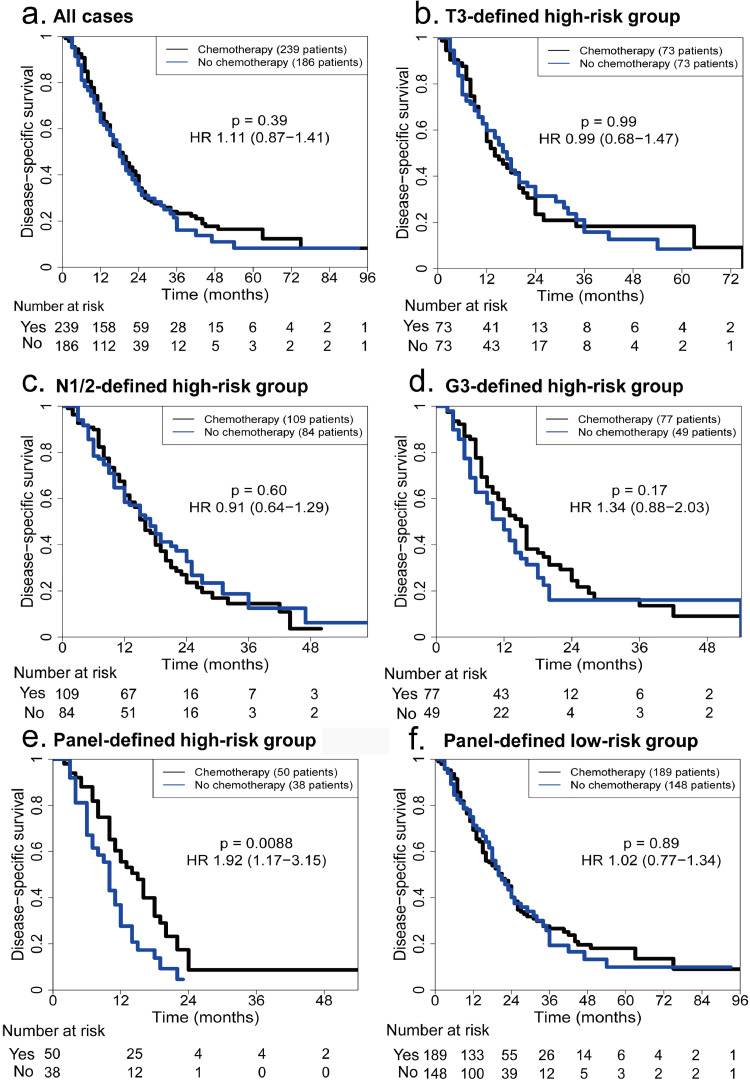
Findings: According to the constructed five-molecule panel, disease-specific survival (DSS) was significantly poorer in high-risk patients than in low-risk ones in development cohort (HR 2.15, 95%CI 1.51-3.05, P<0.0001; AUC 0.67). In two validation cohorts, similar significant differences between the two groups were also observed (HR 3.18 and 3.31, 95%CI 1.89-5.37 and 1.78-6.16, All P<0.0001; AUC 0.72 and 0.73). In multivariate analyses, this panel was the sole prognosticator that was significant in each cohort. Furthermore, its predictive power for long-term survival, higher than its individual constituents, could be largely enhanced by combination with traditional clinicopathological variables. Finally, adjuvant chemotherapy (ACT) correlated with better DSS only in high-risk patients, uni- and multi-variately, in all the cohorts.
Interpretation: The novel prognostic panel developed by a systematically network-based strategy presents strong ability in prediction of post-resectional survival of PDAC patients. Furthermore, panel-defined high-risk patients might benefit more from ACT.
Keywords: Adjuvant chemotherapy; Pancreatic ductal adenocarcinoma; Prognosis; Prognostic panel; Radical resection.
Copyright © 2020 The Author(s). Published by Elsevier B.V. All rights reserved.
Conflict of interest statement
Declaration of Competing Interest The authors declare no conflict of interest.
Figures
Similar articles
-
Biomarker panel predicts survival after resection in pancreatic ductal adenocarcinoma: A multi-institutional cohort study.Eur J Surg Oncol. 2019 Feb;45(2):218-224. doi: 10.1016/j.ejso.2018.10.050. Epub 2018 Oct 11. Eur J Surg Oncol. 2019. PMID: 30348604
-
Development and Validation of the Predictive and Prognostic ChemoResist Signature in Resected Pancreatic Ductal Adenocarcinoma: Multicohort Study.Ann Surg. 2025 Apr 1;281(4):632-644. doi: 10.1097/SLA.0000000000006610. Epub 2024 Dec 16. Ann Surg. 2025. PMID: 39676652
-
Sonic hedgehog and Gli1 expression predict outcome in resected pancreatic adenocarcinoma.Clin Cancer Res. 2015 Mar 1;21(5):1215-24. doi: 10.1158/1078-0432.CCR-14-0667. Epub 2014 Dec 31. Clin Cancer Res. 2015. PMID: 25552484
-
Clinical Perspective on Proteomic and Glycomic Biomarkers for Diagnosis, Prognosis, and Prediction of Pancreatic Cancer.Int J Mol Sci. 2021 Mar 6;22(5):2655. doi: 10.3390/ijms22052655. Int J Mol Sci. 2021. PMID: 33800786 Free PMC article.
-
Intraoperative Peritoneal Washing Cytology on Survival in Pancreatic Ductal Adenocarcinoma With Resectable, Locally Advanced, and Metastatic Disease.Pancreas. 2019 Apr;48(4):519-525. doi: 10.1097/MPA.0000000000001266. Pancreas. 2019. PMID: 30946232
Cited by
-
Network Pharmacology to Uncover the Biological Basis of Spleen Qi Deficiency Syndrome and Herbal Treatment.Oxid Med Cell Longev. 2020 Aug 27;2020:2974268. doi: 10.1155/2020/2974268. eCollection 2020. Oxid Med Cell Longev. 2020. PMID: 32908629 Free PMC article.
-
InterPAD is a database of drug-drug interaction between phytochemicals and anticancer drugs.Sci Rep. 2025 Jul 9;15(1):24616. doi: 10.1038/s41598-025-10240-6. Sci Rep. 2025. PMID: 40634546 Free PMC article.
-
Construction of a hypoxia-derived gene model to predict the prognosis and therapeutic response of head and neck squamous cell carcinoma.Sci Rep. 2022 Aug 8;12(1):13538. doi: 10.1038/s41598-022-17898-2. Sci Rep. 2022. PMID: 35945448 Free PMC article.
-
Network pharmacology: towards the artificial intelligence-based precision traditional Chinese medicine.Brief Bioinform. 2023 Nov 22;25(1):bbad518. doi: 10.1093/bib/bbad518. Brief Bioinform. 2023. PMID: 38197310 Free PMC article. Review.
-
Overexpression of OAS1 Is Correlated With Poor Prognosis in Pancreatic Cancer.Front Oncol. 2022 Jul 11;12:944194. doi: 10.3389/fonc.2022.944194. eCollection 2022. Front Oncol. 2022. PMID: 35898870 Free PMC article.
References
-
- Siegel R.L., Miller K.D., Jemal A. Cancer statistics, 2017. CA Cancer J Clin. 2017;67:7–30. - PubMed
-
- Chen W., Zheng R., Baade P.D., Zhang S., Zeng H., Bray F. Cancer statistics in China, 2015. CA Cancer J Clin. 2016;66:115–132. - PubMed
-
- Xu J., Cao Z., Liu W., You L., Zhou L., Wang C. Plasma miRNAs effectively distinguish patients with pancreatic cancer from controls: a multicenter study. Ann Surg. 2016;263:1173–1179. - PubMed
-
- Conroy T., Hammel P., Hebbar M., Ben Abdelghani M., Wei A.C., Raoul J.L. FOLFIRINOX or gemcitabine as adjuvant therapy for pancreatic cancer. N Engl J Med. 2018;379:2395–2406. - PubMed
-
- Barhli A., Cros J., Bartholin L., Neuzillet C. Prognostic stratification of resected pancreatic ductal adenocarcinoma: past, present, and future. Dig Liver Dis. 2018;50:979–990. - PubMed
MeSH terms
Substances
LinkOut - more resources
Full Text Sources
Medical
Miscellaneous
