

The impact of COVID-19 partial lockdown on the air quality of the city of Rio de Janeiro, Brazil
- PMID: 32361428
- PMCID: PMC7194802
- DOI: 10.1016/j.scitotenv.2020.139085
The impact of COVID-19 partial lockdown on the air quality of the city of Rio de Janeiro, Brazil
Abstract
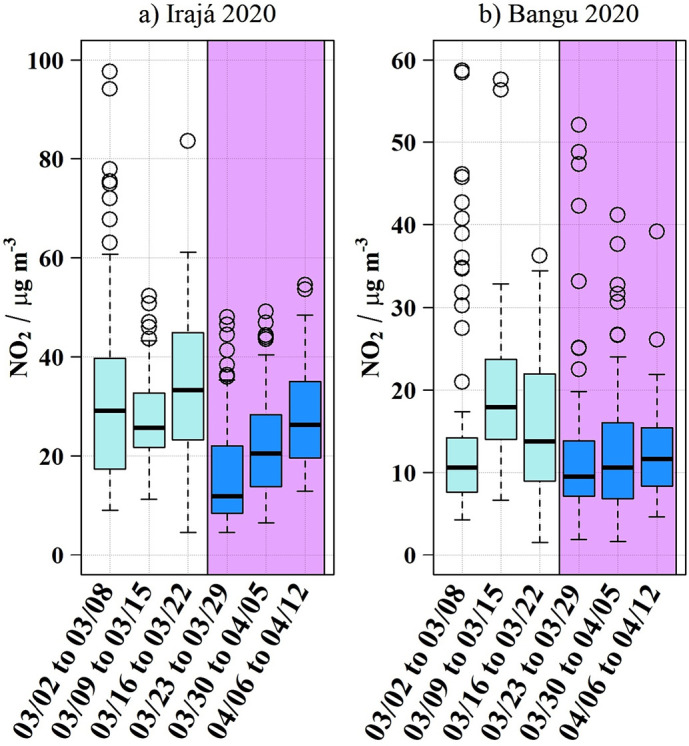
The first COVID-19 case in Brazil was confirmed on February 25, 2020. On March 16, the state's governor declared public health emergency in the city of Rio de Janeiro and partial lockdown measures came into force a week later. The main goal of this work is to discuss the impact of the measures on the air quality of the city by comparing the particulate matter, carbon monoxide, nitrogen dioxide and ozone concentrations determined during the partial lockdown with values obtained in the same period of 2019 and also with the weeks prior to the virus outbreak. Concentrations varied with substantial differences among pollutants and also among the three studied monitoring stations. CO levels showed the most significant reductions (30.3-48.5%) since they were related to light-duty vehicular emissions. NO2 also showed reductions while PM10 levels were only reduced in the first lockdown week. In April, an increase in vehicular flux and movement of people was observed mainly as a consequence of the lack of consensus about the importance and need of social distancing and lockdown. Ozone concentrations increased probably due to the decrease in nitrogen oxides level. When comparing with the same period of 2019, NO2 and CO median values were 24.1-32.9 and 37.0-43.6% lower. Meteorological interferences, mainly the transport of pollutants from the industrial areas might have also impacted the results.
Keywords: COVID-19; Carbon monoxide; Lockdown; Nitrogen dioxide; Ozone; PM(10).
Copyright © 2020 Elsevier B.V. All rights reserved.
Conflict of interest statement
Declaration of competing interest The authors declared no potential conflicts of interest with respect to the research, authorship, and/or publication of this article.
Figures


References
-
- Alerta Rio Sistema Alerta Rio da Prefeitura do Rio de Janeiro. 2020. http://alertario.rio.rj.gov.br/ (accessed April 02 2020)
-
- Argentina Ministerio de Salud. 2020. https://www.argentina.gob.ar/coronavirus/informe-diario (accessed March 31 2020)
-
- Braga A.L., Siciliano B., Dantas G., André M., da Silva C.M., Arbilla G. Levels of volatile carbonyl compounds in the Atlantic rainforest, in the city of Rio de Janeiro. Bull. Environ. Contam. Toxicol. 2019;102:757–762. - PubMed
-
- CONAMA Resolução CONAMA 03/1990. 1990. http://www2.mma.gov.br/port/conama/legiabre.cfm?codlegi=100 (accessed April 10 2020)
-
- CONAMA Resolução CONAMA 491/2018. 2018. http://www2.mma.gov.br/port/conama/legiabre.cfm?codlegi=740 (accessed April 10 2020)
MeSH terms
Substances
LinkOut - more resources
Full Text Sources
Medical
Miscellaneous
