

Effects of noise and linewidth on in vivo analysis of glutamate at 3 T
- PMID: 32361510
- PMCID: PMC8485252
- DOI: 10.1016/j.jmr.2020.106732
Effects of noise and linewidth on in vivo analysis of glutamate at 3 T
Abstract
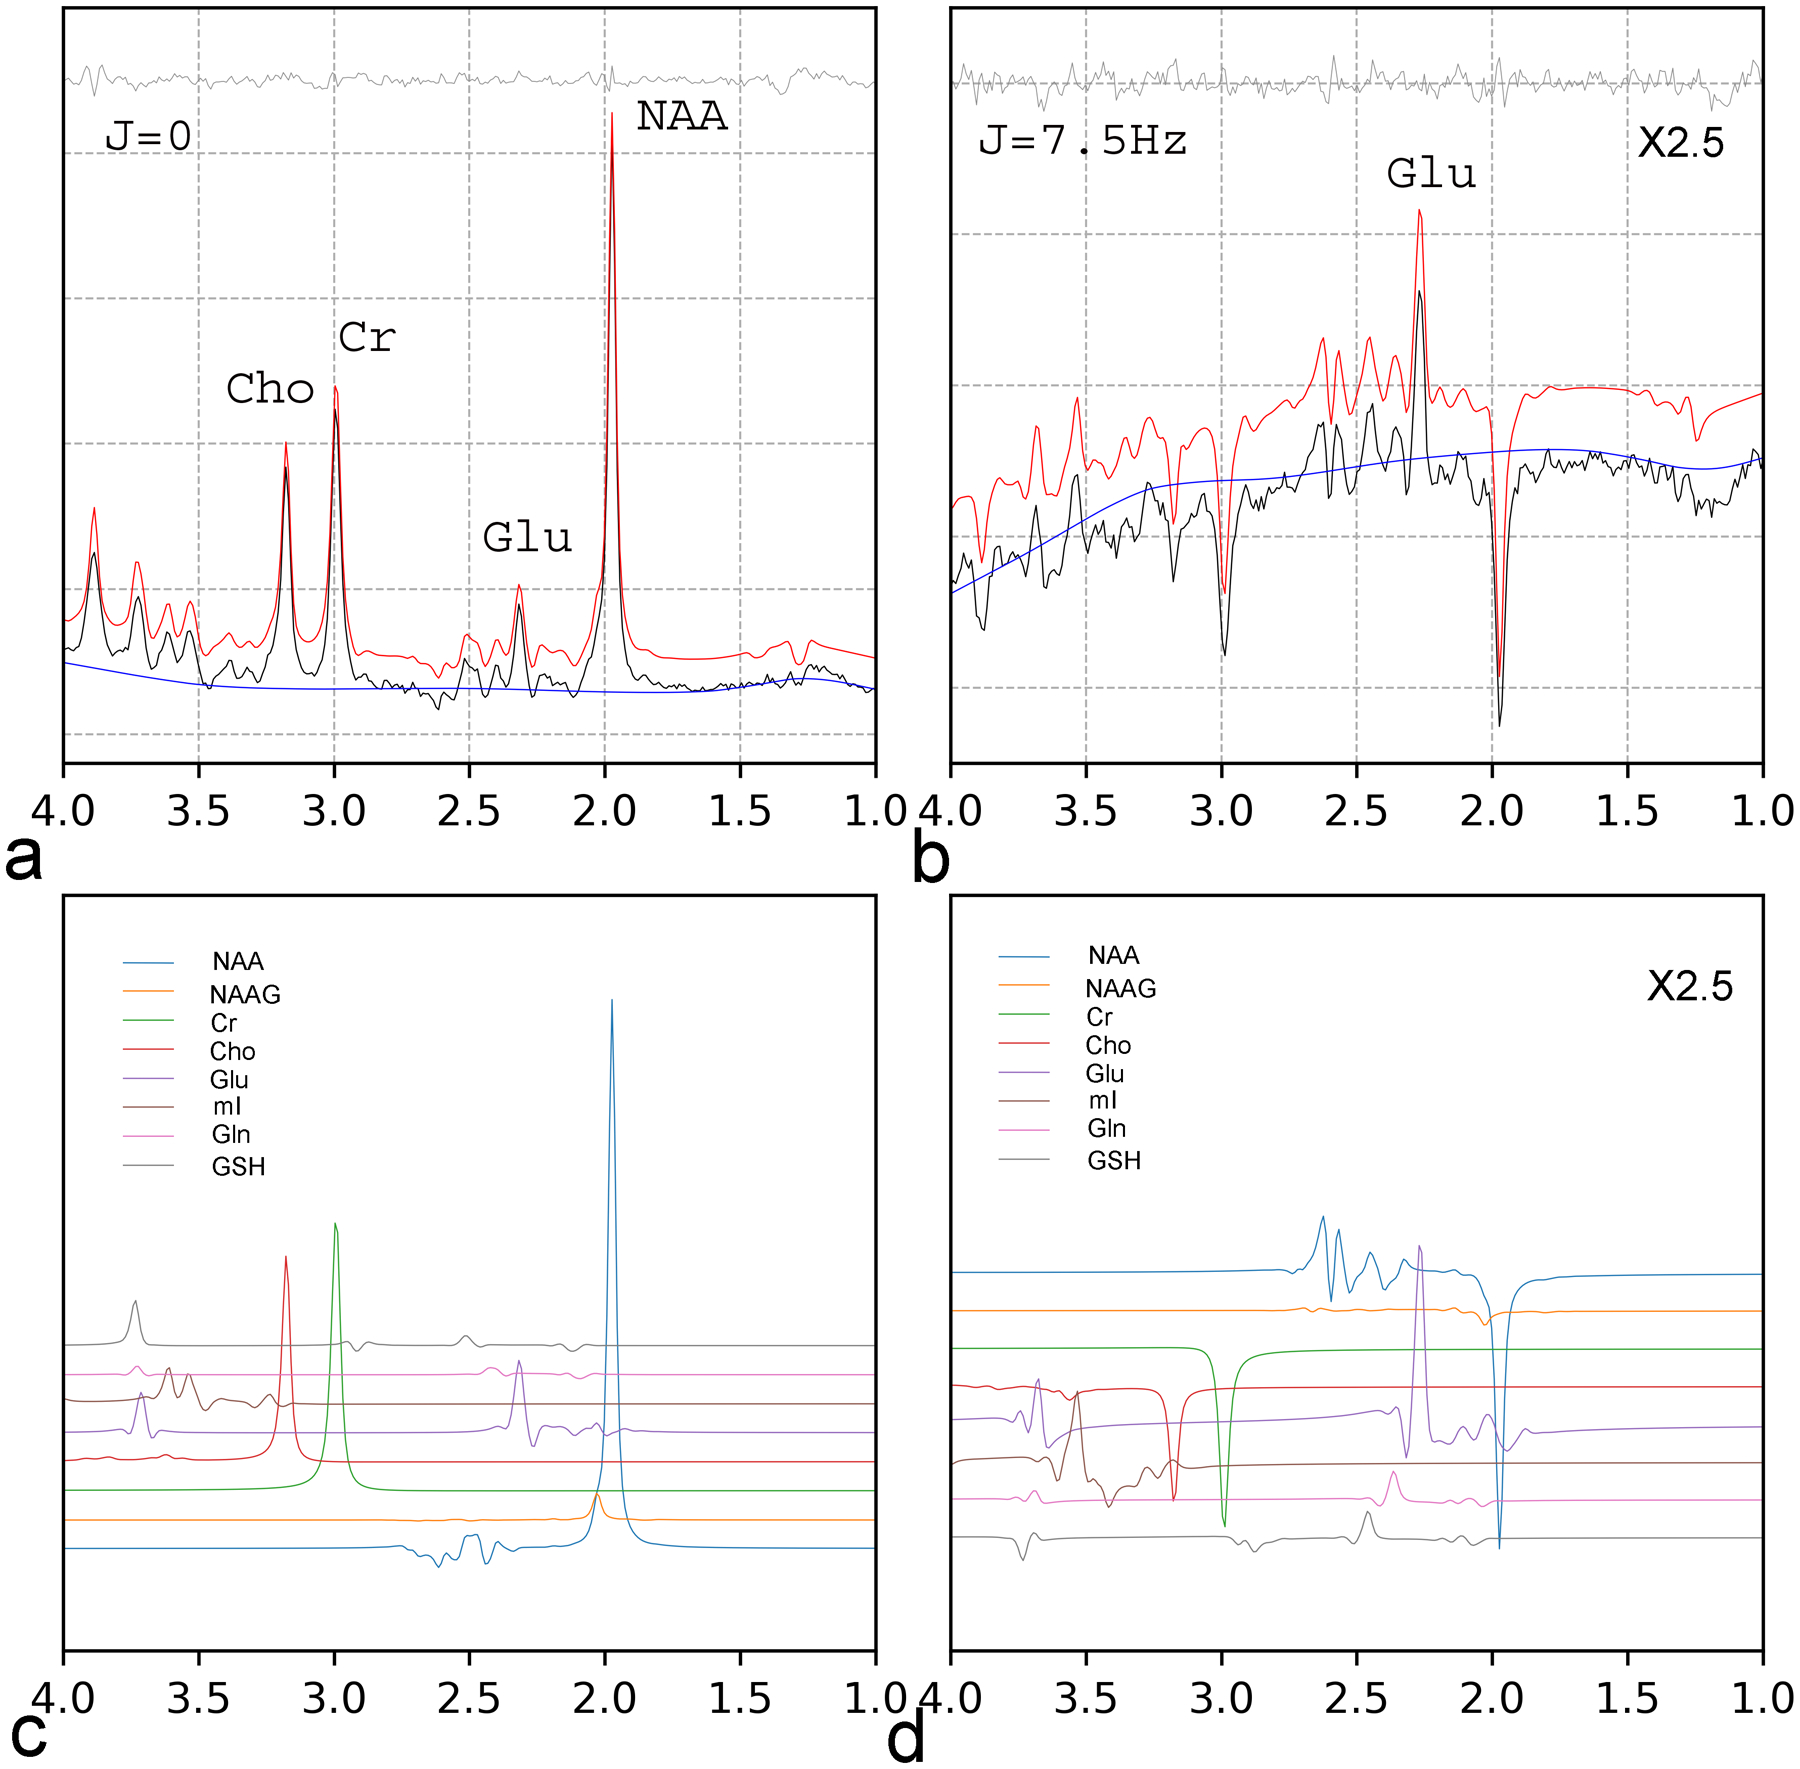
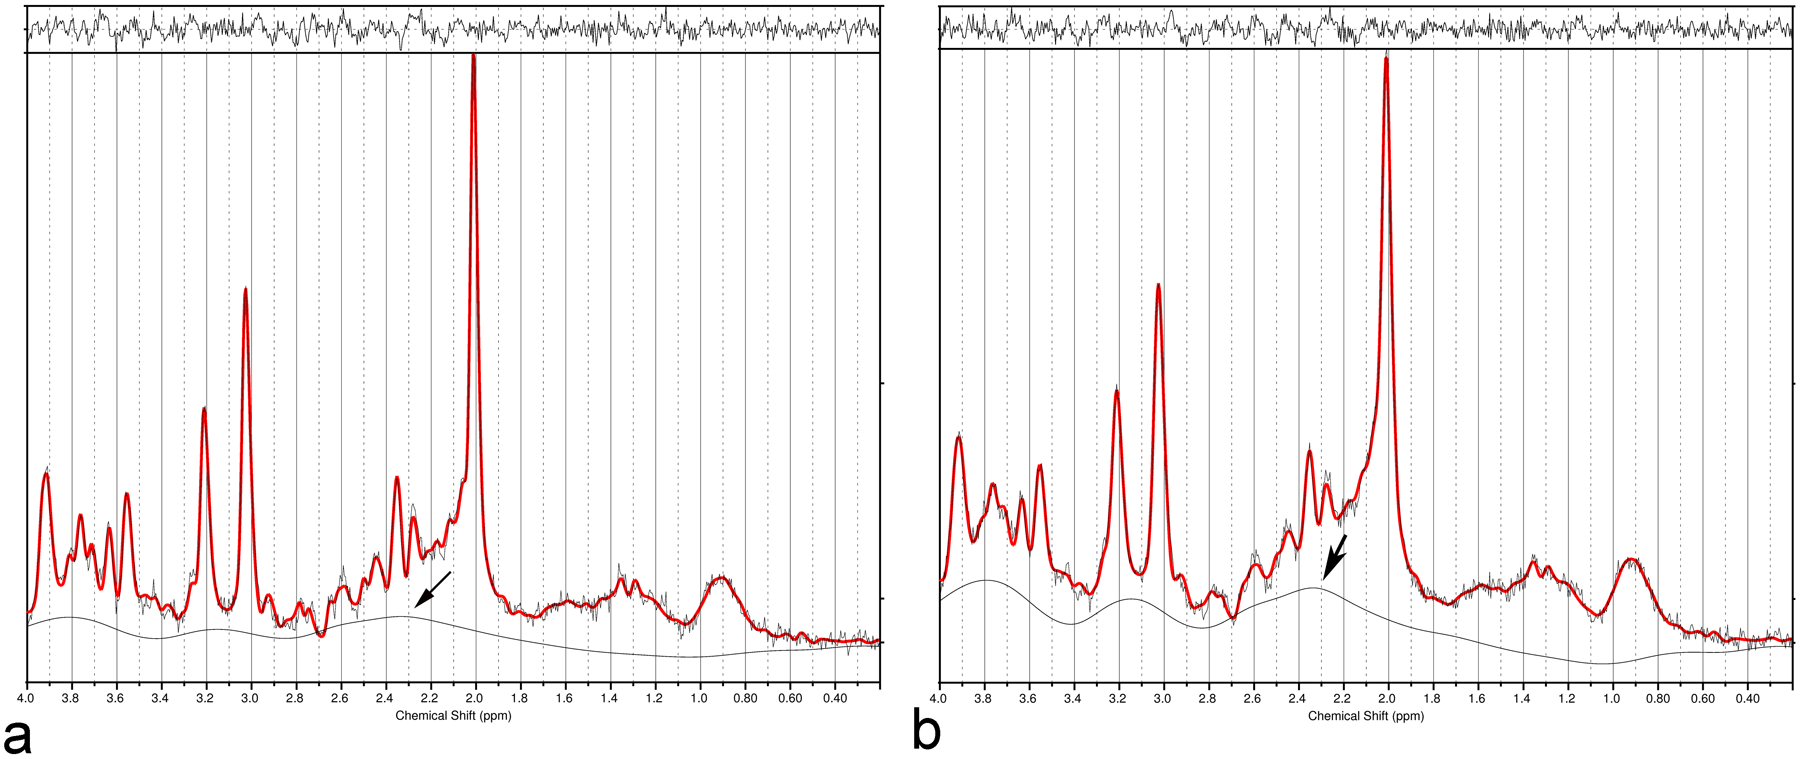
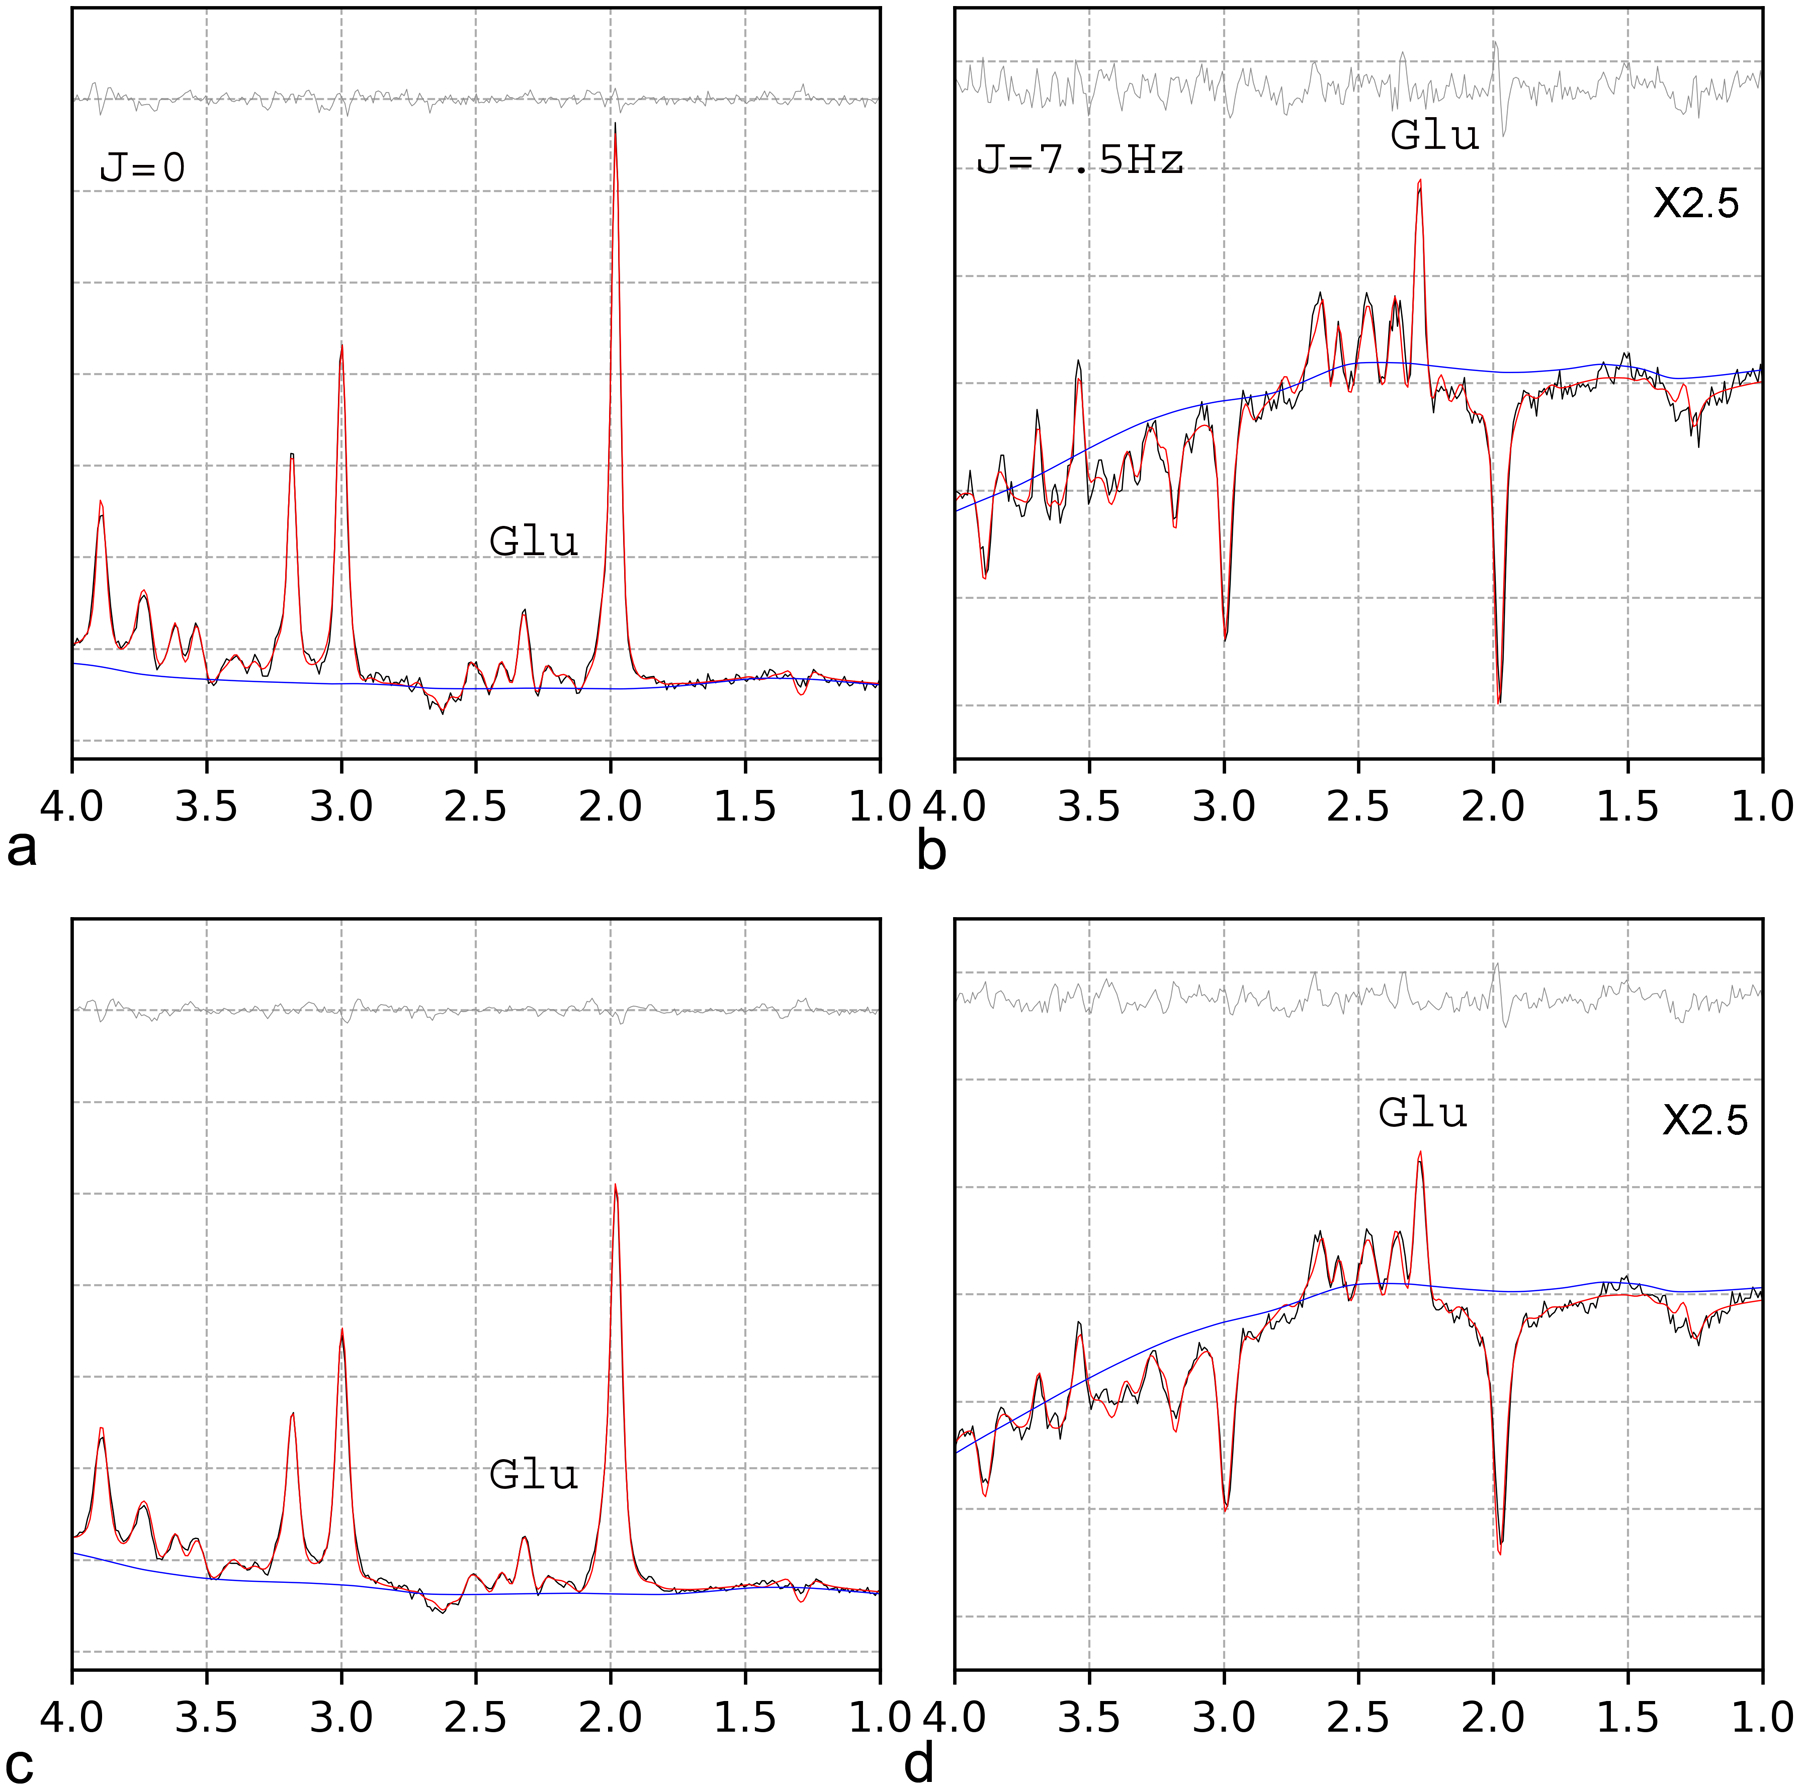
Magnetic resonance spectroscopy (MRS) can noninvasively detect metabolites in vivo, including glutamate (Glu). However, quantification is known to be affected by the overlaps among metabolite resonance lines and background macromolecule signals. We found that adding a moderate amount of noise or line broadening (2 Hz) caused large variations in concentration of Glu and other metabolites, when determined by LCModel analysis of in vivo short-echo time (TE) spectra. Theses variations were largely attributed to strong spectral baselines in short TE spectra, especially near 2.35 ppm, as well as overlapping metabolite resonance lines. To address this issue, we acquired in vivo data at 3 T using both short-TE and the multiple echo time J-resolved point-resolved spectroscopy (JPRESS) MRS techniques. We found that one-dimensional (1D) JPRESS, by simultaneously fitting the two cross-sections of JPRESS at J = 0 and J = 7.5 Hz, was highly resistant to variations in noise levels and spectral linewidths. Our results demonstrate that LCModel analysis of short-TE data is highly sensitive to variations in noise levels and spectral linewidths and this sensitivity is greatly reduced by 1D JPRESS given its substantially reduced baselines and enhanced spectral resolution.
Keywords: Baseline of macromolecule background; Glutamate; JPRESS; Magnetic resonance spectroscopy; Short-echo time.
Copyright © 2020. Published by Elsevier Inc.
Conflict of interest statement
Declaration of Interest
The authors have no conflicts of interest to disclose, financial or otherwise.
Figures


Similar articles
-
Quantification of spatially localized MRS by a novel deep learning approach without spectral fitting.Magn Reson Med. 2023 Oct;90(4):1282-1296. doi: 10.1002/mrm.29711. Epub 2023 May 15. Magn Reson Med. 2023. PMID: 37183798 Free PMC article.
-
Improved resolution of glutamate, glutamine and γ-aminobutyric acid with optimized point-resolved spectroscopy sequence timings for their simultaneous quantification at 9.4 T.NMR Biomed. 2018 Jan;31(1). doi: 10.1002/nbm.3851. Epub 2017 Nov 3. NMR Biomed. 2018. PMID: 29105187
-
Spatially Localized Two-Dimensional J-Resolved NMR Spectroscopy via Intermolecular Double-Quantum Coherences for Biological Samples at 7 T.PLoS One. 2015 Jul 24;10(7):e0134109. doi: 10.1371/journal.pone.0134109. eCollection 2015. PLoS One. 2015. PMID: 26207739 Free PMC article.
-
Precision of metabolite-selective MRS measurements of glutamate, GABA and glutathione: A review of human brain studies.NMR Biomed. 2024 Mar;37(3):e5071. doi: 10.1002/nbm.5071. Epub 2023 Dec 4. NMR Biomed. 2024. PMID: 38050448 Review.
-
Multidimensional MR spectroscopic imaging of prostate cancer in vivo.NMR Biomed. 2014 Jan;27(1):53-66. doi: 10.1002/nbm.2991. Epub 2013 Jul 31. NMR Biomed. 2014. PMID: 23904127 Review.
Cited by
-
Cerebral phosphoester signals measured by 31P magnetic resonance spectroscopy at 3 and 7 Tesla.PLoS One. 2021 Mar 18;16(3):e0248632. doi: 10.1371/journal.pone.0248632. eCollection 2021. PLoS One. 2021. PMID: 33735267 Free PMC article. Clinical Trial.
-
Single-Voxel Proton Magnetic Resonance Spectroscopy of the Thalamus in Idiopathic Epileptic Dogs and in Healthy Control Dogs.Front Vet Sci. 2022 Jul 7;9:885044. doi: 10.3389/fvets.2022.885044. eCollection 2022. Front Vet Sci. 2022. PMID: 35873693 Free PMC article.
-
PCA denoising and Wiener deconvolution of 31 P 3D CSI data to enhance effective SNR and improve point spread function.Magn Reson Med. 2021 Jun;85(6):2992-3009. doi: 10.1002/mrm.28654. Epub 2021 Feb 1. Magn Reson Med. 2021. PMID: 33522635 Free PMC article.
-
In vivo magnetic resonance spectroscopy by transverse relaxation encoding with narrowband decoupling.Sci Rep. 2023 Jul 27;13(1):12211. doi: 10.1038/s41598-023-39375-0. Sci Rep. 2023. PMID: 37500714 Free PMC article.
-
The periaqueductal gray in chronic low back pain: dysregulated neurotransmitters and function.Pain. 2025 May 15;166(7):1690-1705. doi: 10.1097/j.pain.0000000000003617. Pain. 2025. PMID: 40372313 Free PMC article.
References
-
- Bartha R, Drost DJ, Williamson PC. Factors affecting the quantification of short echo in-vivo 1H MR spectra: prior knowledge, peak elimination, and filtering. NMR Biomed 1999; 12:205–216. - PubMed
-
- Hofmann L, Slotboom J, Boesch C, Kreis R. Characterization of the macromolecule baseline in localized 1H-MR spectra of human brain. Magn Reson Med 2001; 46:855–863. - PubMed
-
- Hofmann L, Slotboom J, Jung B, Maloca P, Boesch C, Kreis R. Quantitative 1H-magnetic resonance spectroscopy of human brain: Influence of composition and parameterization of the basis set in linear combination model-fitting. Magn Reson Med 2002; 48:440–453. - PubMed
-
- Seeger U, Klose U, Mader I, Grodd W, Nagele T. Parameterized Evaluation of Macromolecules and Lipids in Proton MR Spectroscopy of Brain Diseases, Magn Reson Med 2003;49:19–28. - PubMed
-
- Schick F, Nagele T, Klose U, et al.Lactate quantification by means of PRESS spectroscopy: influence of refocusing pulses and timing scheme. Magn Reson Imaging 1995; 13:309–19 - PubMed
Publication types
MeSH terms
Substances
Grants and funding
LinkOut - more resources
Full Text Sources
