. 2021 Apr;15(2):614-629.
doi: 10.1007/s11682-020-00272-z.

Cross-paradigm connectivity: reliability, stability, and utility

Affiliations

Cross-paradigm connectivity: reliability, stability, and utility

Hengyi Cao et al. Brain Imaging Behav. 2021 Apr.

Abstract

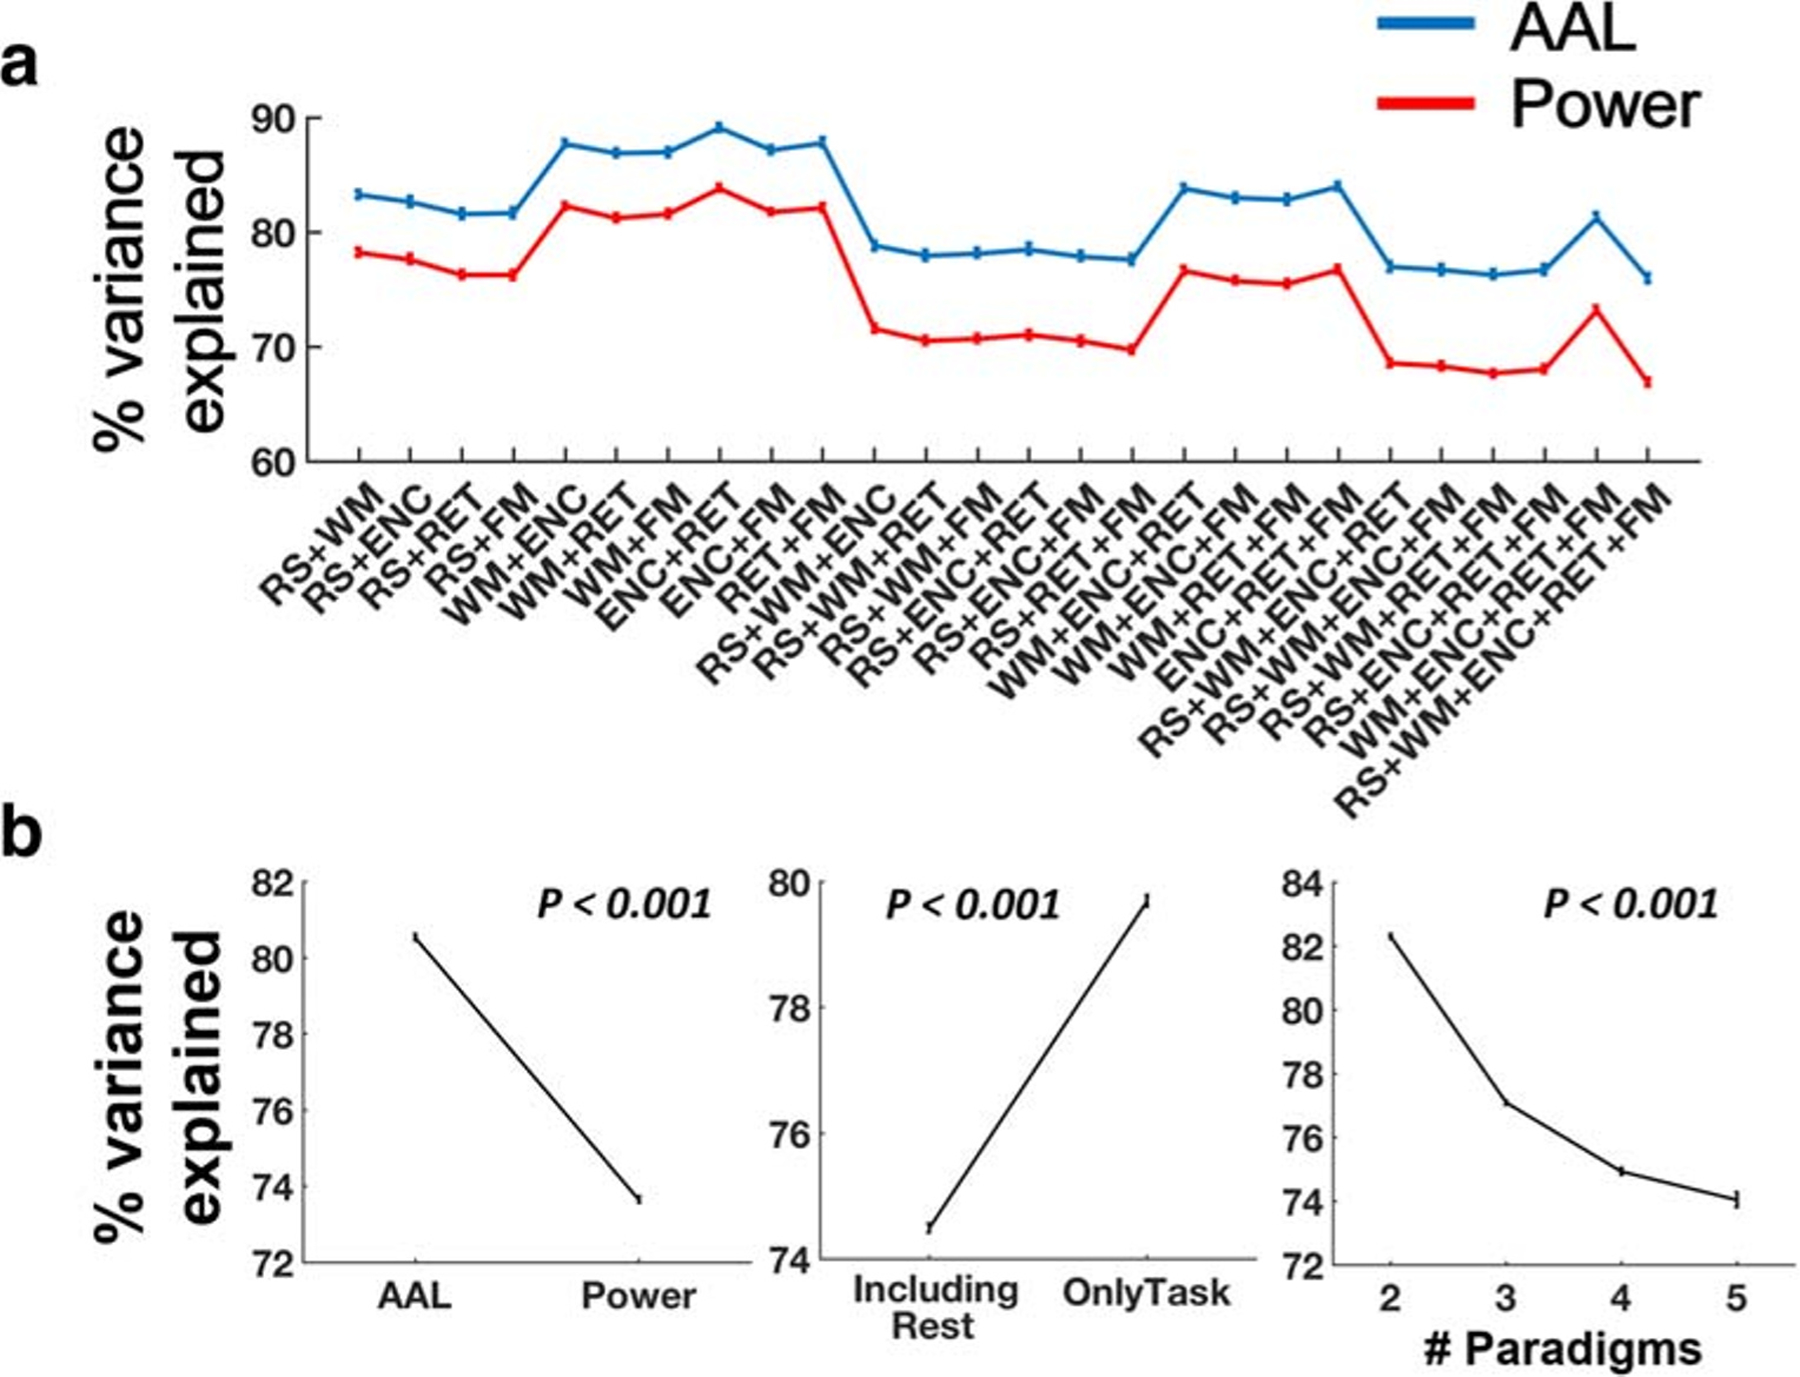
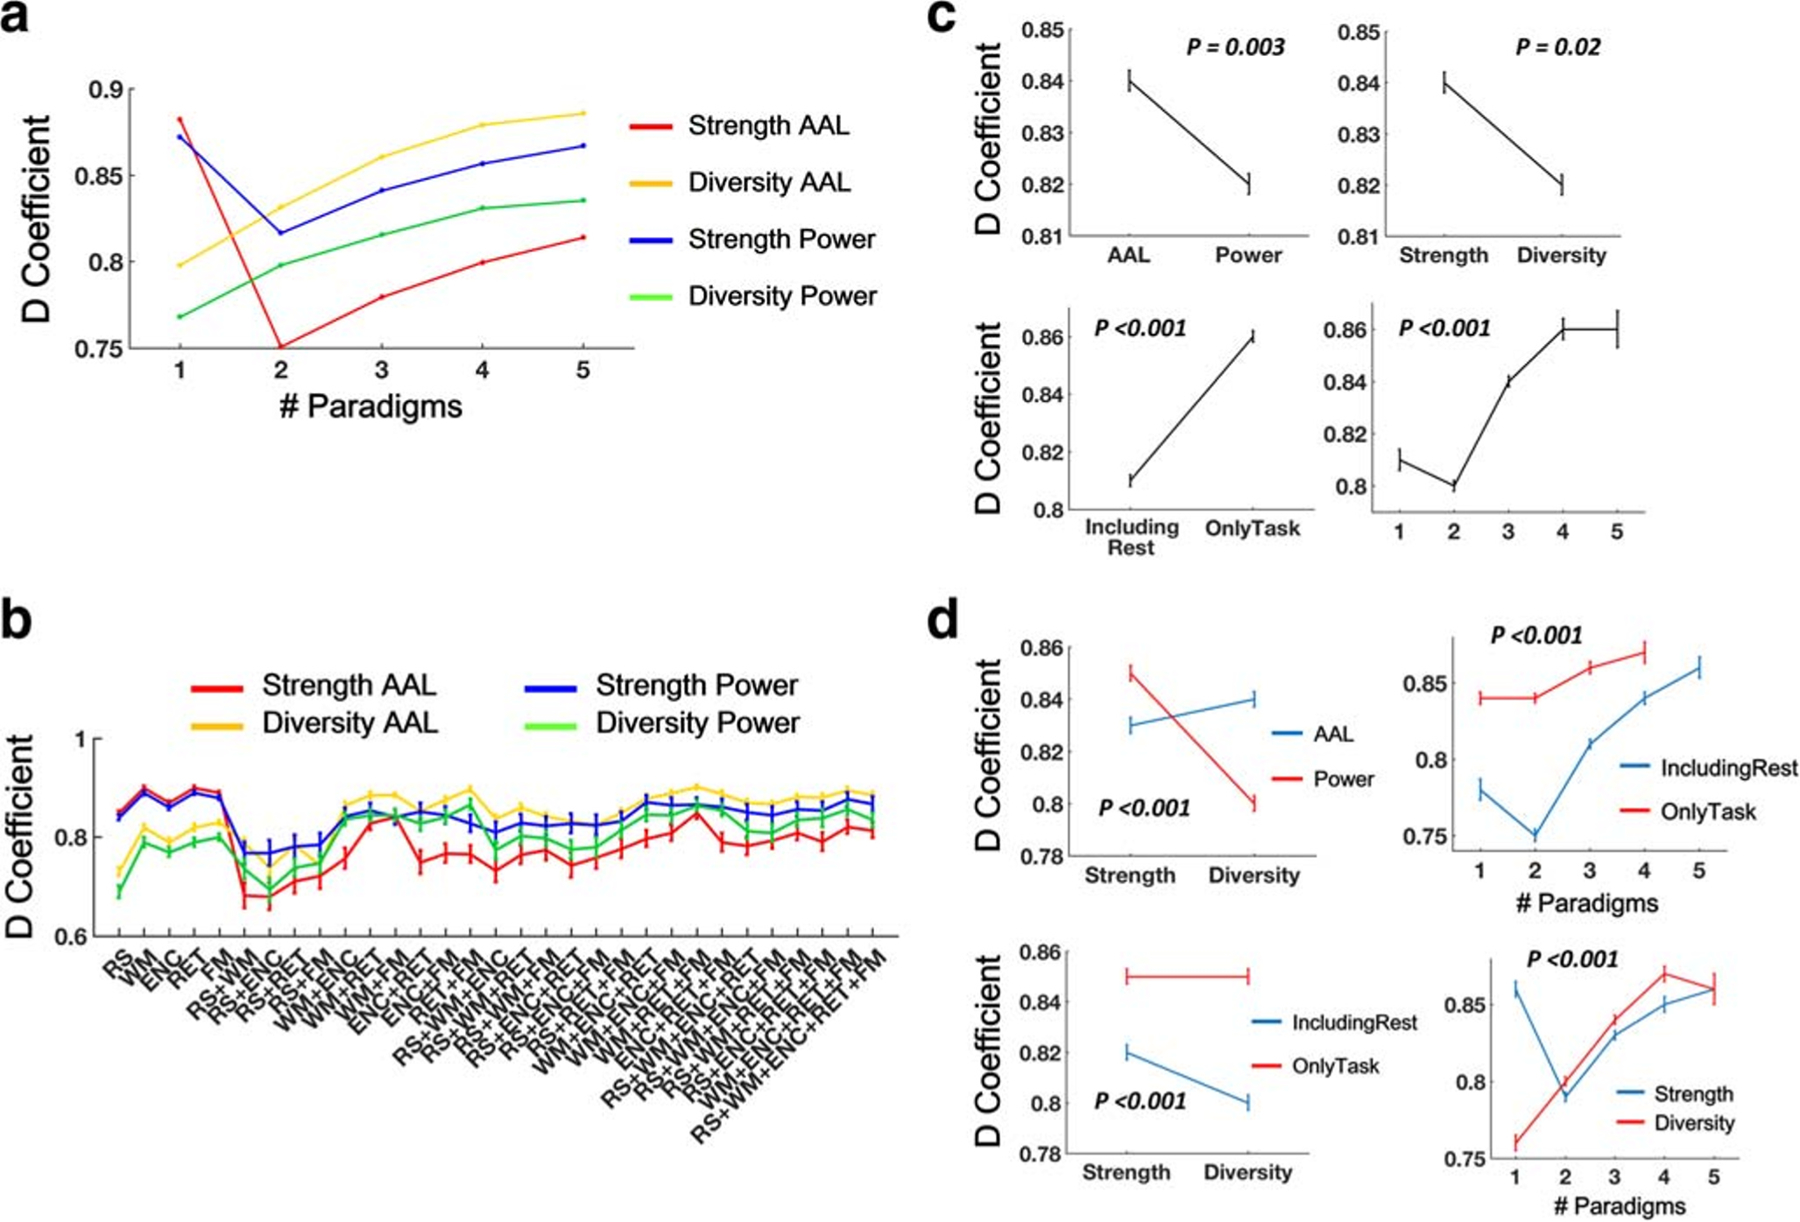
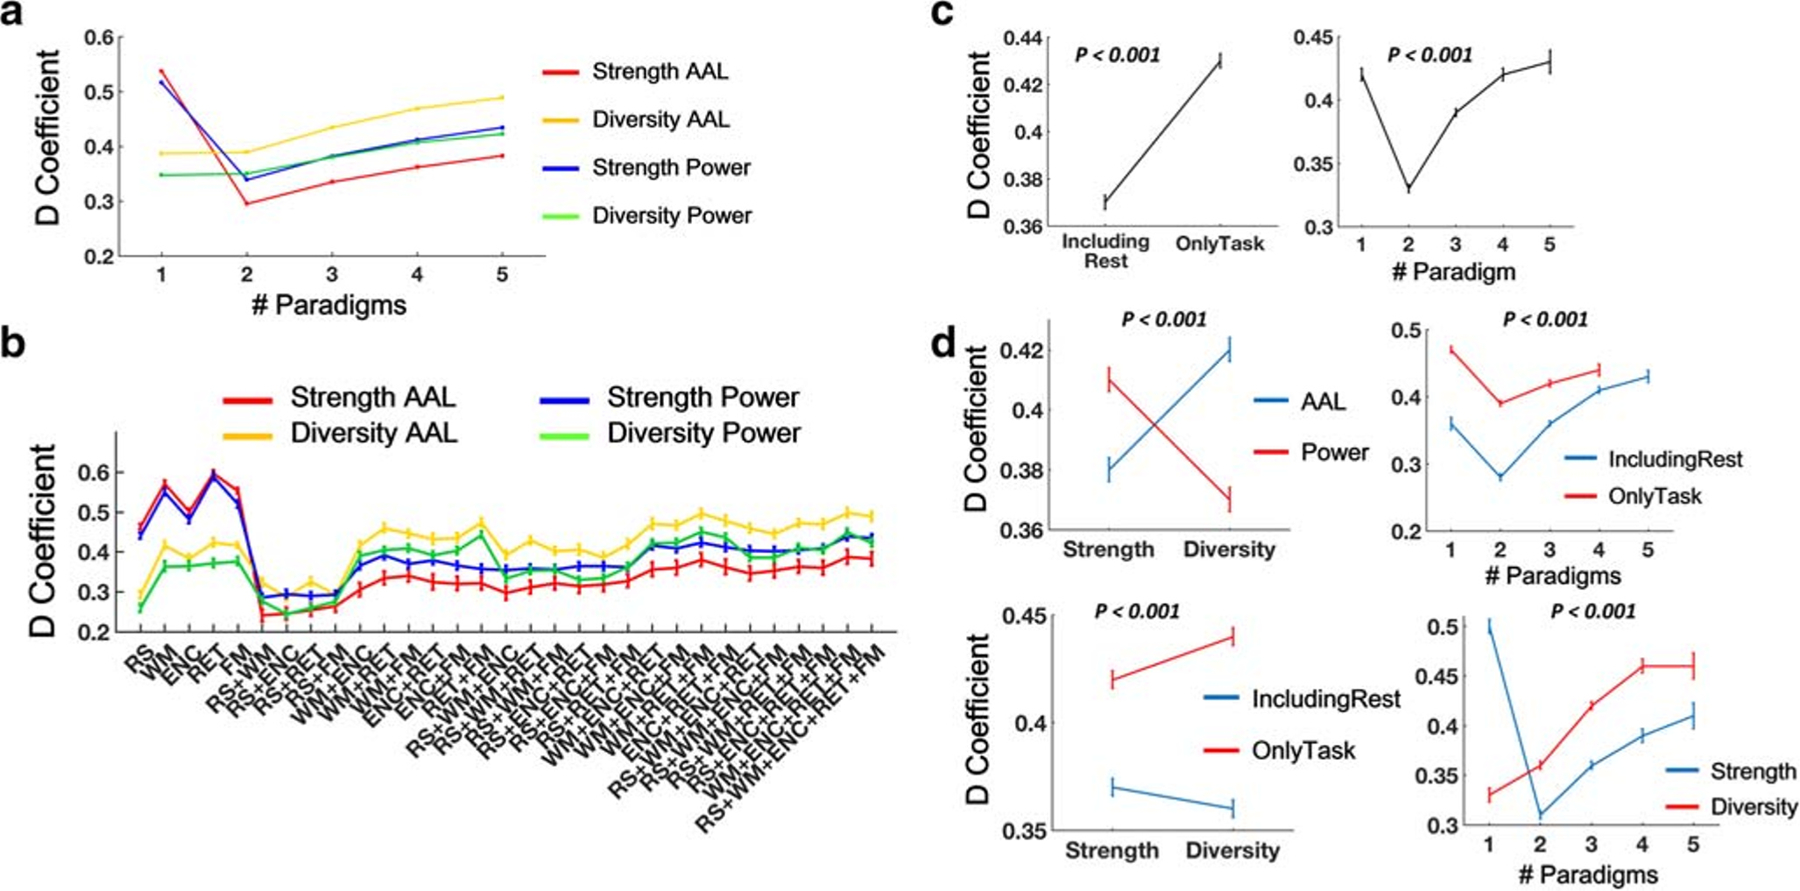
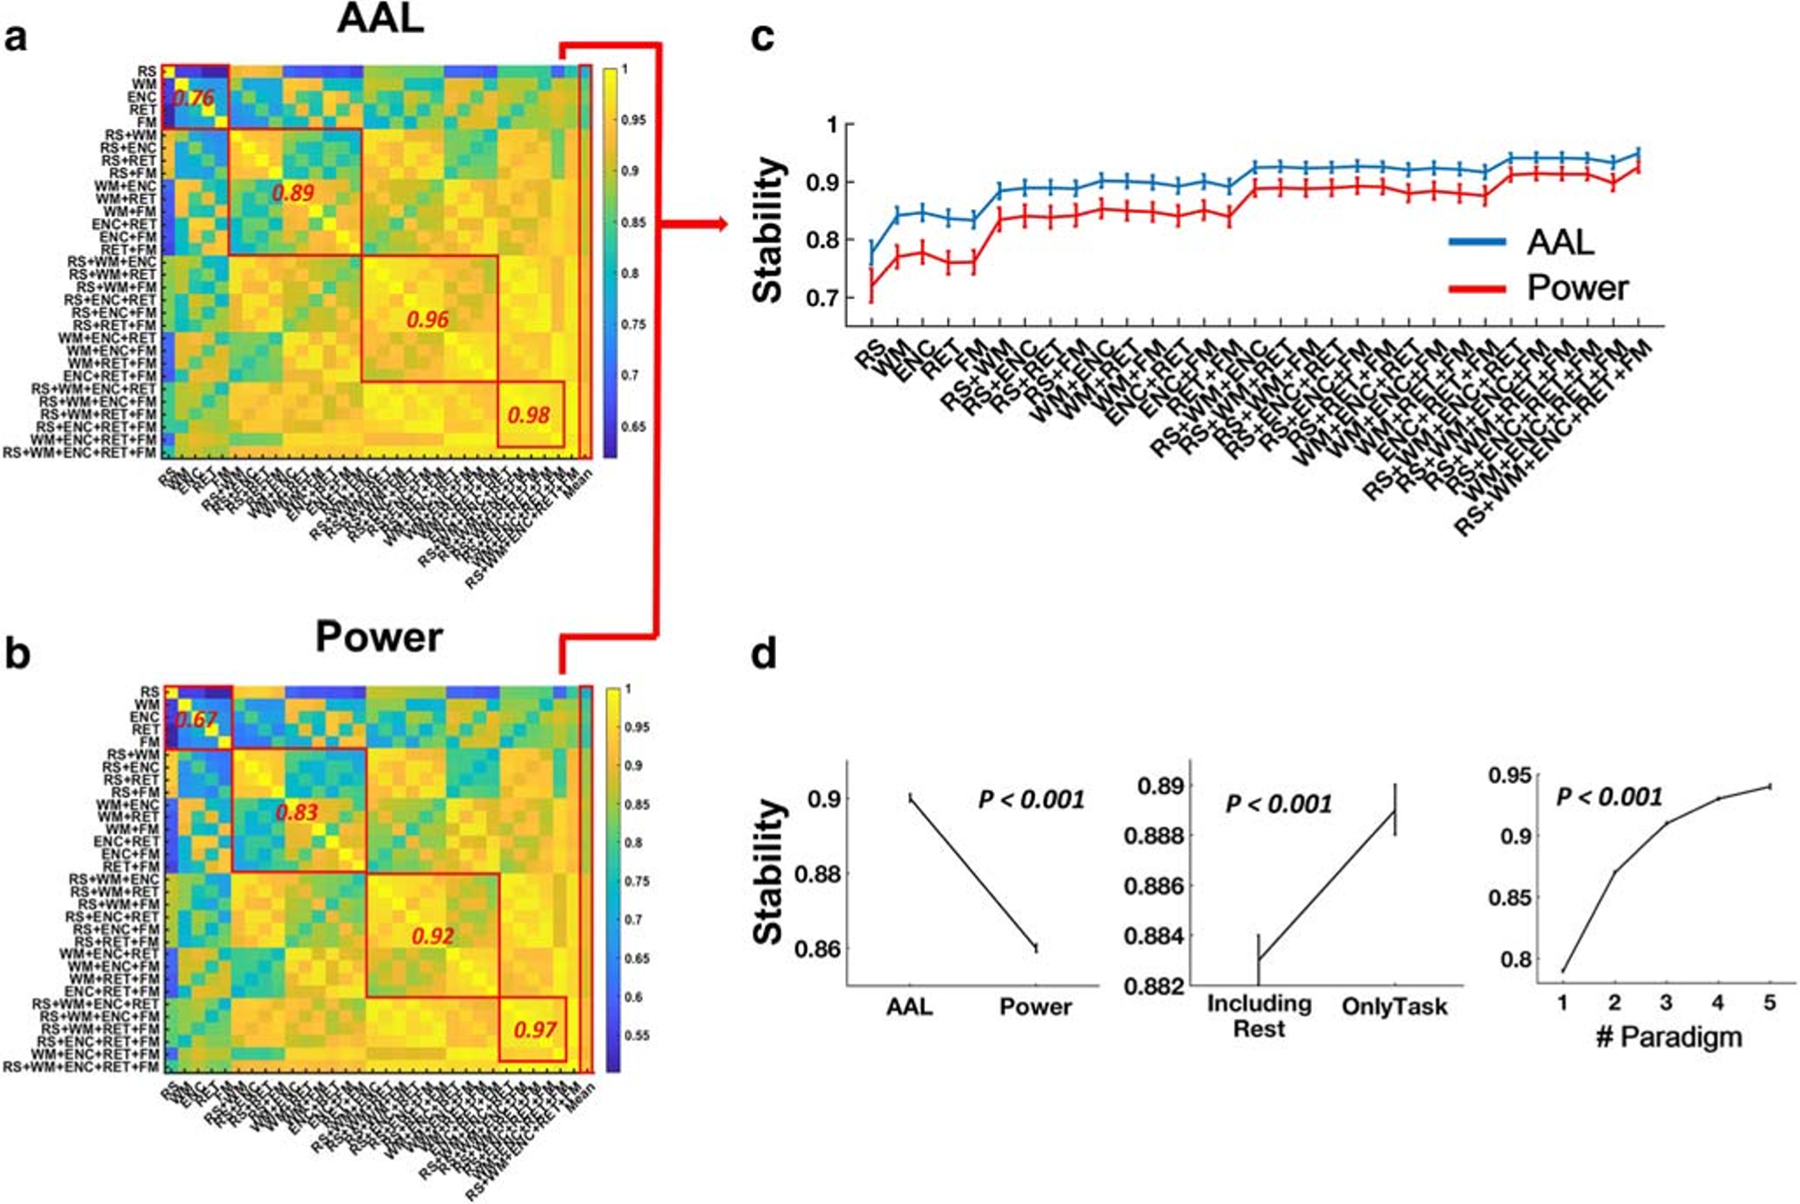
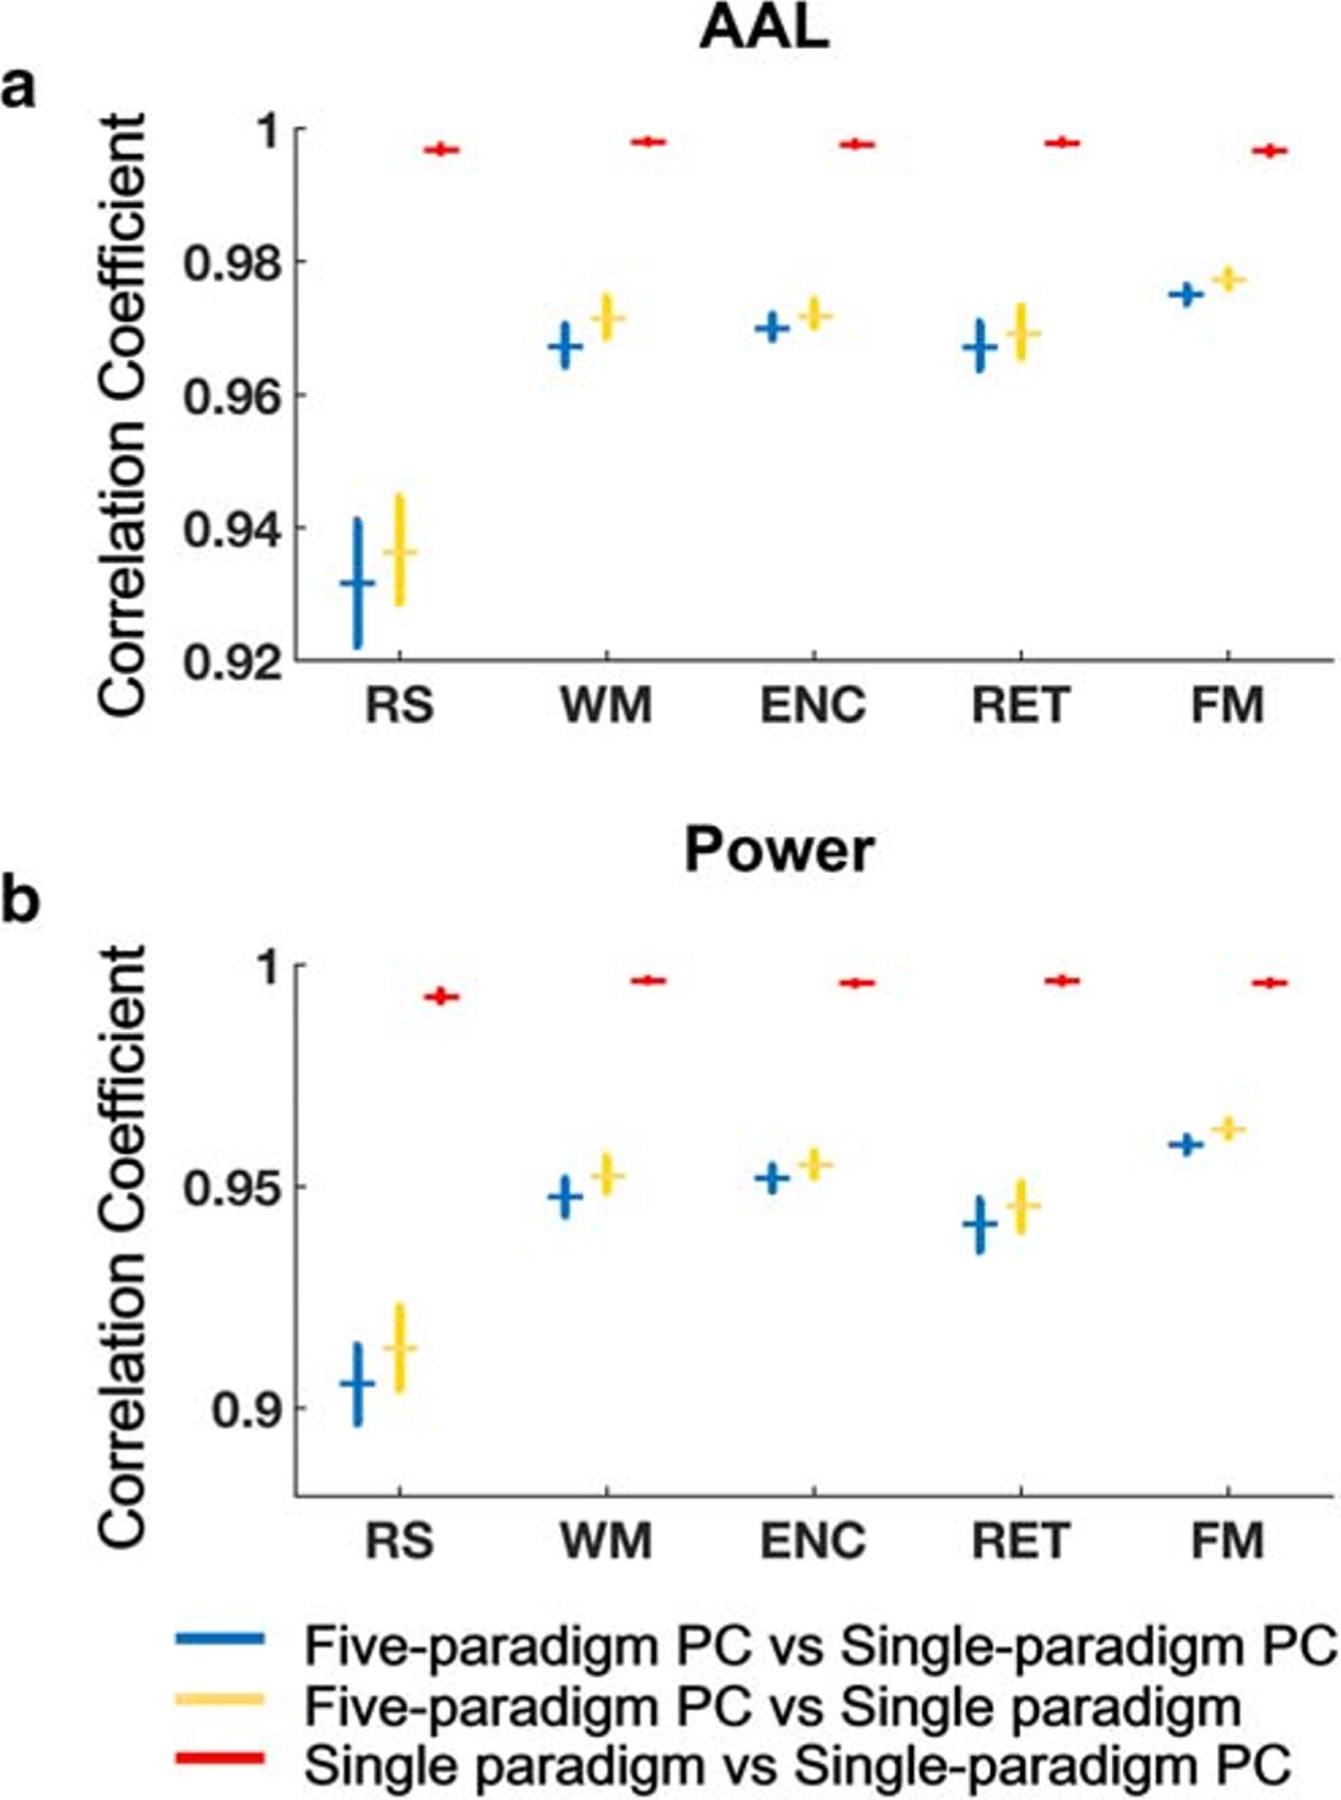
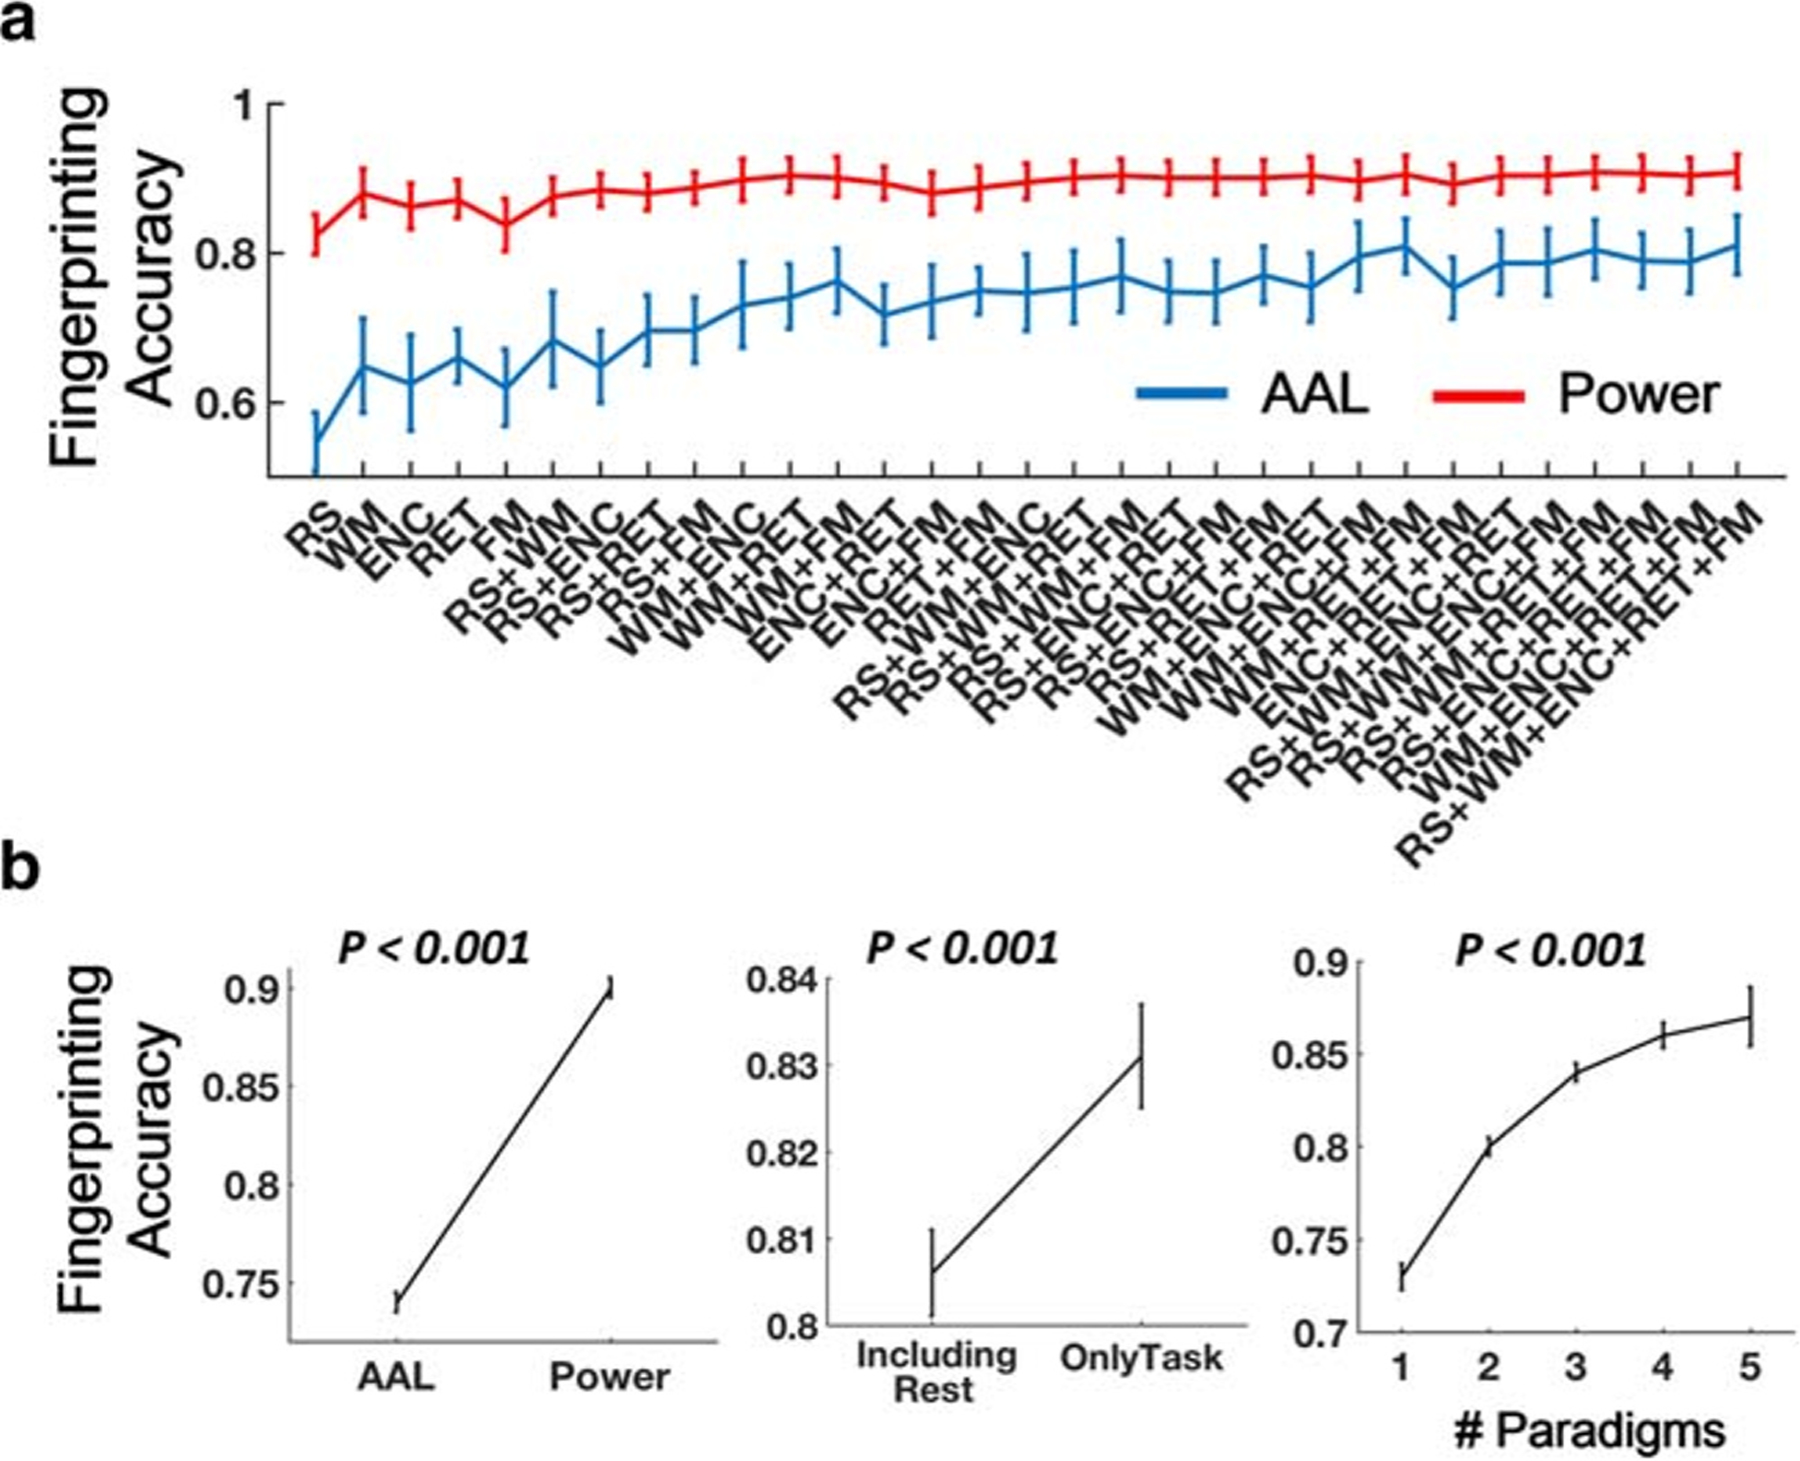
While functional neuroimaging studies typically focus on a particular paradigm to investigate network connectivity, the human brain appears to possess an intrinsic "trait" architecture that is independent of any given paradigm. We have previously proposed the use of "cross-paradigm connectivity (CPC)" to quantify shared connectivity patterns across multiple paradigms and have demonstrated the utility of such measures in clinical studies. Here, using generalizability theory and connectome fingerprinting, we examined the reliability, stability, and individual identifiability of CPC in a group of highly-sampled healthy traveling subjects who received fMRI scans with a battery of five paradigms across multiple sites and days. Compared with single-paradigm connectivity matrices, the CPC matrices showed higher reliability in connectivity diversity, lower reliability in connectivity strength, higher stability, and higher individual identification accuracy. All of these assessments increased as a function of number of paradigms included in the CPC analysis. In comparisons involving different paradigm combinations and different brain atlases, we observed significantly higher reliability, stability, and identifiability for CPC matrices constructed from task-only data (versus those from both task and rest data), and higher identifiability but lower stability for CPC matrices constructed from the Power atlas (versus those from the AAL atlas). Moreover, we showed that multi-paradigm CPC matrices likely reflect the brain's "trait" structure that cannot be fully achieved from single-paradigm data, even with multiple runs. The present results provide evidence for the feasibility and utility of CPC in the study of functional "trait" networks and offer some methodological implications for future CPC studies.

Keywords: Cross-paradigm connectivity; Functional connectome; Individual identifiability; Reliability; Stability.


Conflict of interest statement

Compliance with ethical standards

Conflict of interest Dr. Cannon has served as a consultant for Boehringer-Ingelheim Pharmaceuticals and Lundbeck A/S. The other authors report no conflicts of interest.

Figures

Fig. 1
Fig. 1
Percent of variance explained by CPC (the first PC in the PCA analysis). (A) For all possible combinations of the fMRI paradigms used in the data, the first PC explained ~ 80% of total variance across paradigms. (B) Significantly higher percent of variance was explained by the first PC when the analysis was performed on the AAL atlas (vs Power atlas), only task data (vs rest data) and a small number of paradigms. Error bars indicate standard errors
Fig. 2
Fig. 2
Measures of CPC matrices showed high reliability (D-coefficients) in the G-study. Note that reliability measures for functional connectivity matrices during each of the five paradigms were also included (as number of paradigm = 1) to facilitate direct comparisons with those of the CPC matrices. These single-paradigm reliabilities were reported previously in (Cao et al. 2018b). (A) Reliability of node strength and node diversity as a function of number of paradigms. (B) Reliability of node strength and node diversity across different paradigm combinations. (C) The matrices derived from the AAL atlas, task data, and larger number of paradigms had higher reliability compared with the Power atlas, rest data, and small number of paradigms. (D) Interactive effects were shown for metric x atlas, metric x paradigm type, metric x number of paradigms, and number of paradigms x paradigm type on the reliability measures. Error bars indicate standard errors
Fig. 3
Fig. 3
Reliability (D-coefficients) for measures of CPC matrices in the D-study. Note that reliability measures for functional connectivity matrices during each of the five paradigms were also included (as number of paradigm = 1) to facilitate direct comparisons with those of the CPC matrices. These single-paradigm reliabilities were reported previously in (Cao et al. 2018b). (A) Reliability of node strength and node diversity as a function of number of paradigms. (B) Reliability of node strength and node diversity across different paradigm combinations. (C) The matrices derived from only task data and larger number of paradigms had higher reliability compared with rest data and small number of paradigms. (D) Interactive effects were shown for metric x atlas, metric x paradigm type, metric x number of paradigms, and number of paradigms x paradigm type on the reliability measures. Error bars indicate standard errors
Fig. 4
Fig. 4
Top 20% of most reliable nodes for the CPC matrices constructed from all five paradigms in the D-study (A: node strength with AAL atlas; B: node diversity with AAL atlas; C: node strength with Power atlas; D: node diversity with Power atlas). For (C) and (D), nodes were allocated to the established networks according to (Power et al. 2011). For (A) and (B), nodes were assigned to the most representative Power network as described in (Cao et al. 2019a). SM = sensorimotor; VIS = visual; AUD = auditory; DMN = default-mode; CON = cingulo-opercular; FPN = frontoparietal; SAL = salience; ATT = attentional; SUB-CRB = subcortico-cerebellar
Fig. 5
Fig. 5
Pairwise similarities of CPC matrices constructed from different paradigm combinations assessed by Pearson correlations (A: AAL atlas; B: Power atlas). The mean pairwise similarities within five single paradigms as well as within two-, three-, and four-paradigm combinations were given in red. The right-most columns indicated the mean similarities (stability) for each paradigm or paradigm combination across all other paradigm or paradigm combinations, which were shown in details in (C). (D) Significant effects were shown for atlas, paradigm type and number of paradigms on the matrical stability. Error bars indicate standard errors
Fig. 6
Fig. 6
Similarities between multi-paradigm PC matrices, single-paradigm PC matrices, and single-paradigm connectivity matrices (A: AAL atlas; B: Power atlas). Matrices built upon single paradigm and single-paradigm PCA were almost identical (r ~ 1), both of which were much less similar to that built upon multi-paradigm PCA. Error bars indicate standard errors
Fig. 7
Fig. 7
(A) Accuracy of connectome fingerprinting using CPC matrices across different paradigm combinations. Note that fingerprinting accuracies for functional connectivity matrices during each of the five paradigms were also included (as number of paradigm = 1) to facilitate direct comparisons with that of the CPC matrices. All derived accuracies were significantly higher than the chance level (~ 0.125), as calculated from 10,000 permutations. (B) Significantly higher accuracies were shown for matrices using Power atlas, only task data, and larger number of paradigms. Error bars indicate standard errors

References

    1. Braun U, Plichta MM, Esslinger C, Sauer C, Haddad L, Grimm O, & Meyer-Lindenberg A (2012). Test-retest reliability of resting-state connectivity network characteristics using fMRI and graph theoretical measures. Neuroimage, 59(2), 1404–1412. 10.1016/j.neuroimage.2011.08.044 - DOI - PubMed
    1. Buckner RL, Andrews-Hanna JR, & Schacter DL (2008). The brain’s default network: anatomy, function, and relevance to disease. Annals of the New York Academy of Sciences, 1124, 1–38. 10.1196/annals.1440.011 - DOI - PubMed
    1. Bullmore ET, & Bassett DS (2011). Brain graphs: graphical models of the human brain connectome. Annual Review of Clinical Psychology, 7, 113–140. 10.1146/annurev-clinpsy-040510-143934 - DOI - PubMed
    1. Cao H, Plichta MM, Schafer A, Haddad L, Grimm O, Schneider M, & Tost H (2014). Test-retest reliability of fMRI-based graph theoretical properties during working memory, emotion processing, and resting state. Neuroimage, 84, 888–900. 10.1016/j.neuroimage.2013.09.013 - DOI - PubMed
    1. Cao H, Harneit A, Walter H, Erk S, Braun U, Moessnang C,.. . Tost H (2017). The 5-HTTLPR polymorphism affects network-based functional connectivity in the visual-limbic system in healthy adults. Neuropsychopharmacology 10.1038/npp.2017.121. - DOI - PMC - PubMed