. 2020 Oct;108(4):1183-1197.
doi: 10.1002/JLB.1MA0320-731R. Epub 2020 May 3.

Integrative analysis of microRNA and mRNA expression profiles of monocyte-derived dendritic cells differentiation during experimental cerebral malaria

Affiliations

Integrative analysis of microRNA and mRNA expression profiles of monocyte-derived dendritic cells differentiation during experimental cerebral malaria

Patrícia Aparecida Assis et al. J Leukoc Biol. 2020 Oct.

Abstract

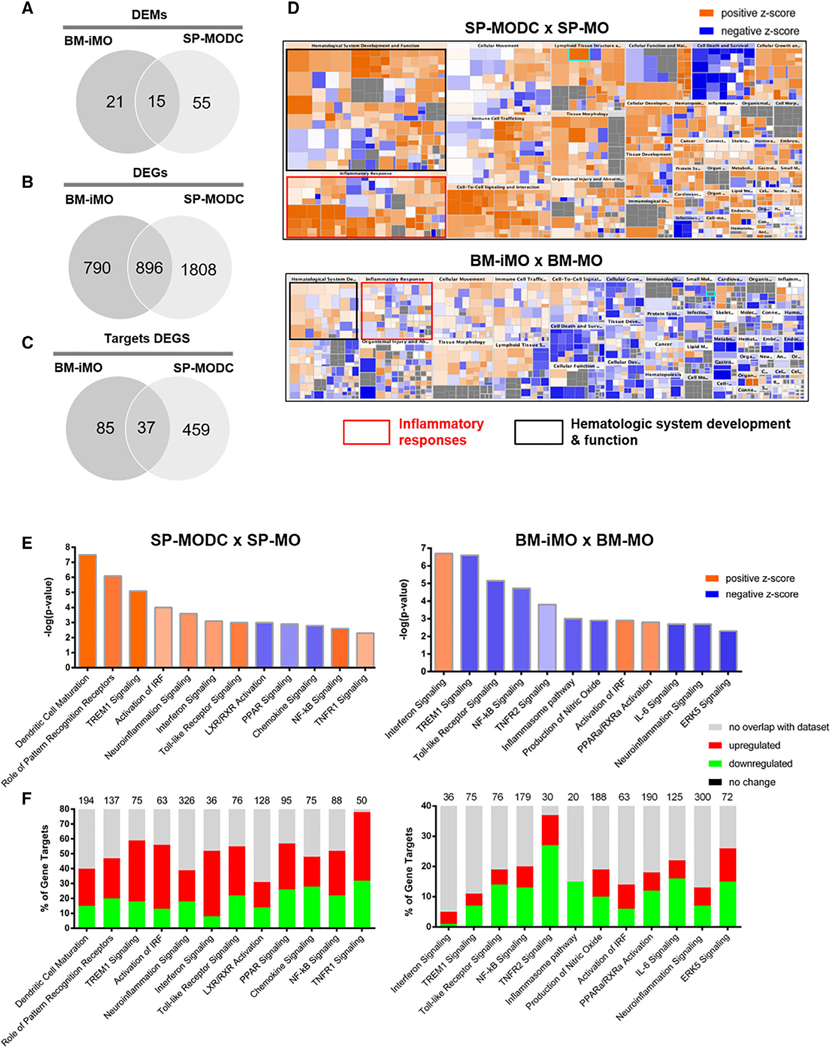
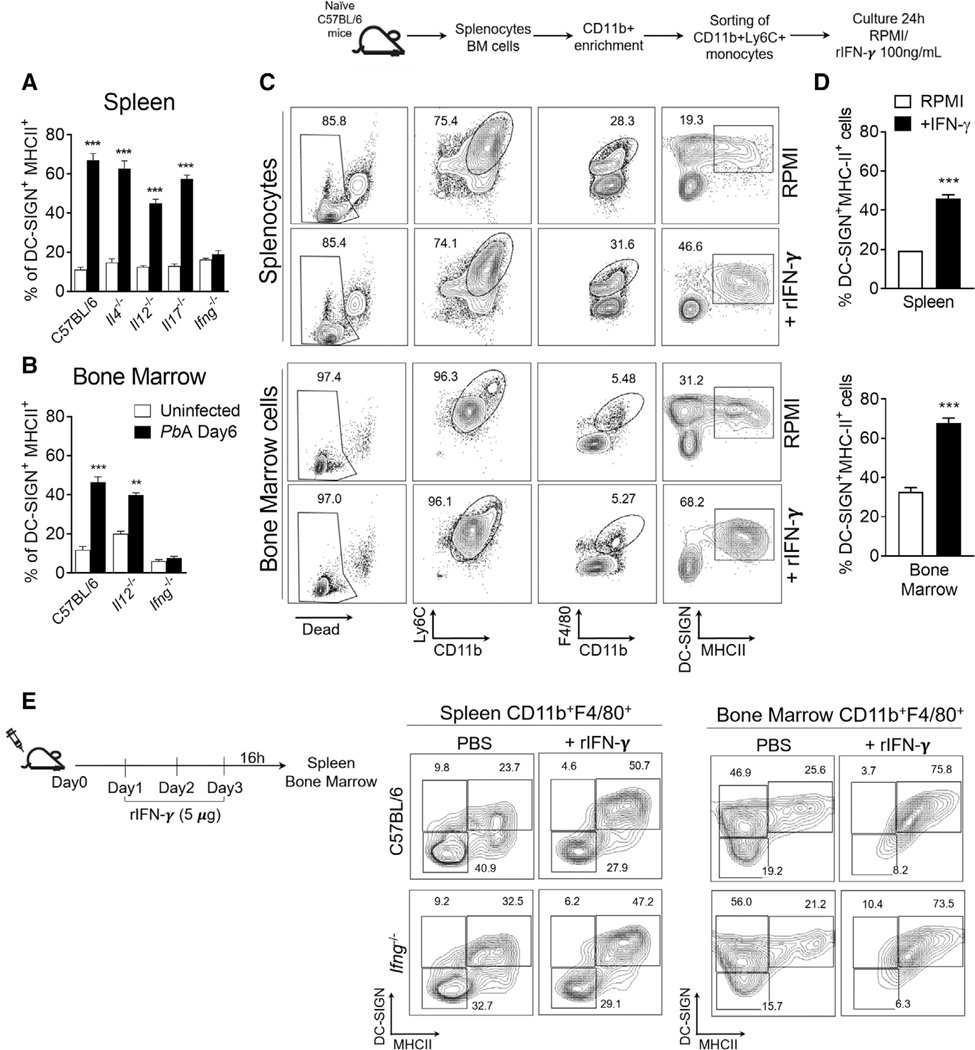
Heterogeneity and high plasticity are common features of cells from the mononuclear phagocyte system: monocytes (MOs), macrophages, and dendritic cells (DCs). Upon activation by microbial agents, MO can differentiate into MO-derived DCs (MODCs). In previous work, we have shown that during acute infection with Plasmodium berghei ANKA (PbA), MODCs become, transiently, the main CD11b+ myeloid population in the spleen (SP) and once recruited to the brain play an important role in the development of experimental cerebral malaria (ECM). Here, we isolated 4 cell populations: bone marrow (BM) MOs (BM-MOs) and SP-MOs from uninfected mice; BM inflammatory MOs (BM-iMOs) and SP-MODCs from PbA-infected mice and used a system biology approach to a holistic transcriptomic comparison and provide an interactome analysis by integrating differentially expressed miRNAs (DEMs) and their differentially expressed gene targets (DEGs) data. The Jaccard index (JI) was used for gauging the similarity and diversity among these cell populations. Whereas BM-MOs, BM-iMOs, and SP-MOs presented high similarity of DEGs, SP-MODCs distinguished by showing a greater number of DEGs. Moreover, functional analysis identified an enrichment in canonical pathways, such as DC maturation, neuroinflammation, and IFN signaling. Upstream regulator analysis identified IFNγ as the potential upstream molecule that can explain the observed DEMs-Target DEGs intersections in SP-MODCs. Finally, directed target analysis and in vivo/ex vivo assays indicate that SP-MODCs differentiate in the SP and IFNγ is a main driver of this process.

Keywords: MODC; Plasmodium; cell differentiation; miRNA; systems biology.


Conflict of interest statement

DISCLOSURES

The authors declare no conflicts of interest.

Figures

FIGURE 1
FIGURE 1. Monocyte and MODC populations in the spleen and bone marrow of PbA-infected mice.
Spleens and BMs were harvested 6 days after PbA infection. (A) Splenocytes or BM cells were first gated for CD11b+F4/80+ cells and then for DC-SIGN and MHCII expression. (B) Expression of Ly6C and DC-SIGN was evaluated in CD11b+F4/80+DC-SIGN+MHCII+ cells. The data shown are representative of 3 independent experiments. (C) Splenic and BM CD11b+F4/80+DC-SIGN+MHCII+ cells were evaluated for the expression of DC/MODC markers and chemokines, such as, CD11c, CD40, CD80, CXCL9, CXCL10, and CCR5. Dotted lines show cells from uninfected mice and full lines from infected mice. Numbers indicate MFI for each marker on infected samples. (D) Emergency of DC-SIGN+MHCII+ cells in the spleen and BM follows the increase in of parasitemia in PbA-infected mice. Line graphs shows the frequency of each MO population within CD11b+F4/80+ cells. (E) Parasitemia was estimated by counting Giemsa-stained thin blood smears and is expressed as percentage of infected RBCs. Data shown are representative of 2 independent experiments. Results are expressed as average ± S.E.M. **P ≤ 0.001
FIGURE 2
FIGURE 2. Profiling of differentially expressed genes and miRNAs in MO populations during PbA infection.
(A) Workflow of data processing and analysis of gene and miRNA expression profiles BM and SP cells from C57BL/6 mice were used for FACS isolation of the specific cell populations: SP-MO and BM-MO cells (Ly6GCD11b+F4/80+DC-SIGNMHCII) from uninfected mice; BM-iMO (Ly6GCD11b+F4/80+DC-SIGNintMHCII) and SP-MODC (Ly6GCD11b+F4/80+DC-SIGNhiMHCIIhi) from mice 6 days post-infection with PbA. (B) Principal component analysis (PCA) based on the top 2000 differentially expressed genes (DEGs) and 500 differentially expressed miRNA (DEMs) was performed, by using a median centering of the data set (the percentage of the variance is indicated between brackets). Heatmap and hierarchical clustering was performed on all the samples using squared Euclidean distance measure and Ward’s method for linkage analysis and z-score normalization. Each row represents 1 mRNA (left panel) and miRNA (right panel) significantly regulated and each column represents 1 sample. Specific cell populations are designed by the following colors: BM-MO: blue, BM-iMO: magenta, SP-MO: green, and SP-MODC: red. The color-coded scale (blue: expression levels lower than the mean and red: expression level over the mean) illustrates the mRNA and miRNA fold change (log2ΔCt) after global normalization is indicated at the bottom of the figure. (C) Schematic representation of the mathematical test of 2 hypotheses on preferential MODC differentiation route. Hypothesis 1: assumes that BM-MOs differentiates on BM-iMOs during infection and then migrate to the spleen where they complete maturation to SP-MODCs. Hypothesis 2: assumes that resident SP-MO along with BM-MO that migrate to the spleen during infection with an unchanged phenotype will differentiate into SP-MODC. The Venn Diagram indicate all the possible virtual comparisons between the cells on the tested hypothesis. In these diagrams, we compare DEGs from each differential analysis. Yellow dots indicate the intersection where is expected the biggest change on gene expression, that is in agreement with the organ where the differentiation took place. Red and orange dots indicate those intersections where is expected few genes in common mainly because they make reference to the migration process and we expect that during migration the cells suffer a minor change on
FIGURE 3
FIGURE 3. Differentially expressed genes and miRNAs and functional pathways enriched during MODC differentiation.
(A) Venn diagram showing the number of differentially expressed genes and (B) miRNAs in SP-MODCs and BM-iMOs and intersected genes. (C) Venn diagram with the number of targets DEGs (high predicted and experimentally validated targets) in iMOs and MODCs as well as those that are shared between these 2 cell populations. (D) Enriched ingenuity pathway analysis (IPA) categories of DEGs in BM-iMOs and SP-MODCs. Diseases and biologic function pathways colored by z-score that measure the activation state of these processes (blue: inhibited and orange: activated); sized by the number of genes: the bigger the box the more genes of the provided list it contains. On the scale blue means lower activation levels and orange higher activation levels. (E) Ingenuity pathway analysis shown for differentially expressed genes (DEGs) and (F) microRNAs (DEMs). Pathway analysis for the comparison SP-MODC versus SP-MO or BM-iMO versus BM-MO. For DEGs, we shown canonical pathways most significantly enriched colored by their activation (z-score) the activated pathways (high z-score) are in orange and inhibited (low z-score) are in blue. To DEMs target analysis, the numerical value in the top of each pathway bar represents the total number of genes in that canonical pathway. The stacked bar charts display the percentage of target DEGs that are positively (red), negatively (green), no change (black), and no overlap with IPA database (gray). In all analysis, the Benjamini–Hochberg false discovery rate (FDR) was used with adjusted P ≤ 0.05 and a fold change (FC) cutoff ≥ 1.5
FIGURE 4
FIGURE 4. Upstream regulator and DEM/DEG network of MODC differentiation during PbA infection.
(A) Upstream regulator analysis of the DEM targets in BM-iMOs and SP-MODCs. Orange or blue color represent activated or inhibited, respectively, according to z-score prediction statistical calculation of the upstream regulator activation state in both cell populations. (B) DEM-DEG networks for SP-MODC transcriptome and microRNA data using IPA software. Built network contain the top 2 miRNAs found to potentially regulate the highest number of targets DEGs (mmu-miR-16–5p and mmu-miR-491) in the context of DC maturation and neuroinflammation, both predicted to be activated (orange). Relationship between molecules is represented as a line (direct or indirect relationship). The molecules colors in graduation of red and green represent if their fold change is up or down regulated, respectively
FIGURE 5
FIGURE 5. Role of IFNγ on the differentiation of MODCs during PbA infection.
Spleens and BMs were harvested 6 days after PbA infection. (A and B) Splenocytes or BM cells were obtained from C57BL/6, IL-4−/−, IL-12−/−, IL-17−/−, and IFNγ−/− mice. Total cells were first gated for CD11b+F4/80+ cells and then for DC-SIGN+MHCII+ cells. Bar graphs correspond to frequency of DC-SIGN+MHCII+ cells within total monocytes CD11b+F4/80+. The data shown are representative of 2 independent experiments. Results are expressed as average ± S.E.M. Two-way ANOVA analysis of variance comparing splenic versus BM cells in infected C57BL/6 mice. ***P < 0.0001; **P < 0.001. (C) Splenocytes and BM cells were collected from naïve C57BL/6 mice for sorting of monocytes CD11b+Ly6C+. Isolated cells were cultured with IFNγ (100 ng/ml) for 24 h and then analyzed for MODC differentiation by flow cytometry. Contour plot shows live monocytes (CD11b+ Ly6C+F4/80+) being evaluated for the expression of DC-SIGN and MHCII (MODC phenotype). (D) Bar graphs correspond to frequency of DC-SIGN+MHCII+ cells within total monocytes CD11b+F4/80+ in cultures treated with IFNγ or not (RPMI). (E) C57BL/6 mice were administered recombinant IFNγ or PBS once per day for 3 days. Spleen and BM were collected 18 h after the final injection. Contour plot show the frequency of DC-SIGN+MHCII+ cells within total monocytes CD11b+F4/80+and histogram show the expression of CD11c on this cell. Statistical analysis was performed by 2-tailed nonparametric unpaired t-test at 95% CI. The data shown are representative of 3 independent experiments. ***P < 0.0001
FIGURE 6
FIGURE 6. Differentiation of splenic MO into MODCs during PbA infection.
Enriched splenic F4/80+CD11b+DC-SIGNMHCII cells from uninfected CD45.2+ donor mice were adoptively transferred i.v. into CD45.1+ uninfected or PbA-infected mice. Dot plot of enriched monocytes show that ∼99% of the cells were undifferentiated monocytes DC-SIGNMHCII (MO). After 48 h, spleens and BM of recipient mice were obtained and frequency of CD45.2+ donor-derived MODCs were compared with recipient-derived CD45.1+ MODCs. Bar graphs show frequency of MODC in F4/80+CD11b+ populations from CD45.2+ or CD45.1+ cells of 2 pooled experiments that yielded similar results

Similar articles

Cited by

References

    1. Geissmann F, Manz MG, Jung S, Sieweke MH, Merad M, Ley K. Development of monocytes, macrophages, and dendritic cells. Science. 2010;327(5966):656–661. - PMC - PubMed
    1. Le Borgne M, Etchart N, Goubier A, et al. Dendritic cells rapidly recruited into epithelial tissues via CCR6/CCL20 are responsible for CD8+ T cell crosspriming in vivo. Immunity. 2006;24(2):191–201. - PubMed
    1. Davies LC, Taylor PR. Tissue-resident macrophages: then and now. Immunology. 2015;144(4): 541–548. - PMC - PubMed
    1. Cheong C, Matos I, Choi JH, et al. Microbial stimulation fully differentiates monocytes to DC-SIGN/CD209(+) dendritic cells for immune T cell areas. Cell. 2010;143(3):416–429. - PMC - PubMed
    1. Lai SM, Sheng J, Gupta P, et al. Organ-specific fate, recruitment, and refilling dynamics of tissue-resident macrophages during blood-stage malaria. Cell Rep. 2018;25(11):3099–3109. - PubMed

Publication types