

Effects of body size on estimation of mammalian area requirements
- PMID: 32362060
- PMCID: PMC7496598
- DOI: 10.1111/cobi.13495
Effects of body size on estimation of mammalian area requirements
Abstract
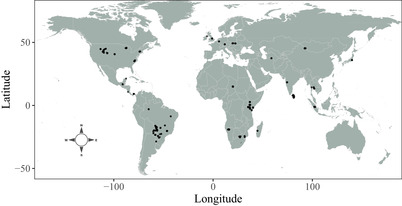
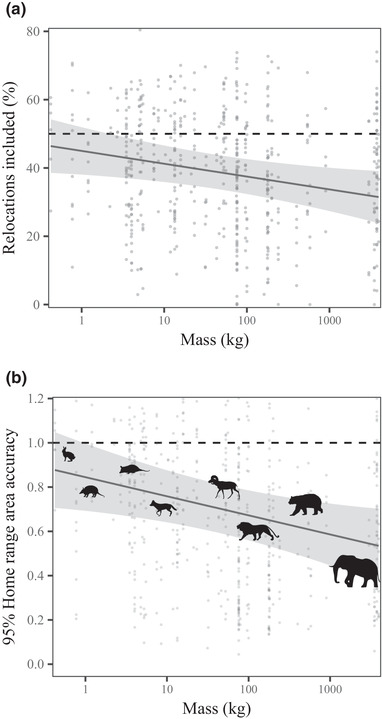
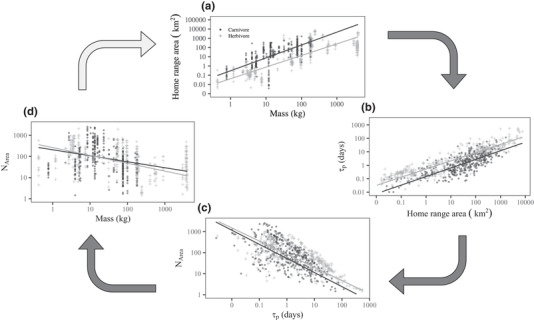
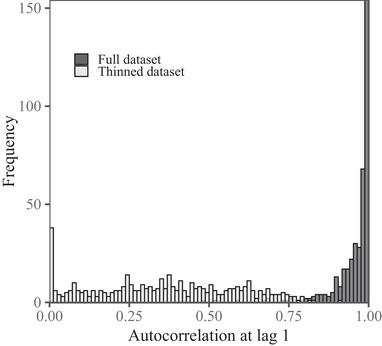
Accurately quantifying species' area requirements is a prerequisite for effective area-based conservation. This typically involves collecting tracking data on species of interest and then conducting home-range analyses. Problematically, autocorrelation in tracking data can result in space needs being severely underestimated. Based on the previous work, we hypothesized the magnitude of underestimation varies with body mass, a relationship that could have serious conservation implications. To evaluate this hypothesis for terrestrial mammals, we estimated home-range areas with global positioning system (GPS) locations from 757 individuals across 61 globally distributed mammalian species with body masses ranging from 0.4 to 4000 kg. We then applied block cross-validation to quantify bias in empirical home-range estimates. Area requirements of mammals <10 kg were underestimated by a mean approximately15%, and species weighing approximately100 kg were underestimated by approximately50% on average. Thus, we found area estimation was subject to autocorrelation-induced bias that was worse for large species. Combined with the fact that extinction risk increases as body mass increases, the allometric scaling of bias we observed suggests the most threatened species are also likely to be those with the least accurate home-range estimates. As a correction, we tested whether data thinning or autocorrelation-informed home-range estimation minimized the scaling effect of autocorrelation on area estimates. Data thinning required an approximately93% data loss to achieve statistical independence with 95% confidence and was, therefore, not a viable solution. In contrast, autocorrelation-informed home-range estimation resulted in consistently accurate estimates irrespective of mass. When relating body mass to home range size, we detected that correcting for autocorrelation resulted in a scaling exponent significantly >1, meaning the scaling of the relationship changed substantially at the upper end of the mass spectrum.
Efectos del Tamaño Corporal sobre la Estimación de los Requerimientos de Área de Mamíferos Resumen La cuantificación precisa de los requerimientos de área de una especie es un prerrequisito para que la conservación basada en áreas sea efectiva. Esto comúnmente implica la recolección de datos de rastreo de la especie de interés para después realizar análisis de la distribución local. De manera problemática, la autocorrelación en los datos de rastreo puede resultar en una subestimación grave de las necesidades de espacio. Con base en trabajos previos, formulamos una hipótesis en la que supusimos que la magnitud de la subestimación varía con la masa corporal, una relación que podría tener implicaciones serias para la conservación. Para probar esta hipótesis en mamíferos terrestres, estimamos las áreas de distribución local con las ubicaciones en GPS de 757 individuos de 61 especies de mamíferos distribuidas mundialmente con una masa corporal entre 0.4 y 4,000 kg. Después aplicamos una validación cruzada en bloque para cuantificar el sesgo en estimaciones empíricas de la distribución local. Los requerimientos de área de los mamíferos <10 kg fueron subestimados por una media ∼15% y las especies con una masa ∼100 kg fueron subestimadas en ∼50% en promedio. Por lo tanto, encontramos que la estimación del área estaba sujeta al sesgo inducido por la autocorrelación, el cual era peor para las especies de talla grande. En combinación con el hecho de que el riesgo de extinción incrementa conforme aumenta la masa corporal, el escalamiento alométrico del sesgo que observamos sugiere que la mayoría de las especies amenazadas también tienen la probabilidad de ser aquellas especies con las estimaciones de distribución local menos acertadas. Como corrección, probamos si la reducción de datos o la estimación de la distribución local informada por la autocorrelación minimizan el efecto de escalamiento que tiene la autocorrelación sobre las estimaciones de área. La reducción de datos requirió una pérdida de datos del ∼93% para lograr la independencia estadística con un 95% de confianza y por lo tanto no fue una solución viable. Al contrario, la estimación de la distribución local informada por la autocorrelación resultó en estimaciones constantemente precisas sin importar la masa corporal. Cuando relacionamos la masa corporal con el tamaño de la distribución local, detectamos que la corrección de la autocorrelación resultó en un exponente de escalamiento significativamente >1, lo que significa que el escalamiento de la relación cambió sustancialmente en el extremo superior del espectro de la masa corporal.
准确量化物种的栖息面积需求是开展有效区域保护的先决条件, 这一般包括收集目标物种的跟踪数据并进行家域分析。然而, 跟踪数据中的自相关性可能导致严重低估动物的空间需求。基于已有研究, 我们假设低估程度会随体重变化而变化, 这种关系可能对保护产生严重影响。为了评估陆生哺乳动物是否符合这一假设, 我们利用体重在 0.4 到 4000 千克之间的61种全球分布哺乳动物的 757 个个体的全球定位系统 (GPS) 定位数据, 估计了它们的家域范围。接下来, 我们应用分块交叉验证定量分析了家域经验估计的偏差。结果显示, 体重小于 10 千克的哺乳动物的面积需求平均被低估了约 15%, 体重在100千克左右的物种平均被低估约 50% 。因此, 我们指出面积估计受到自相关引起偏差的影响, 且这种偏差对大型物种来说更为严重。考虑到物种灭绝风险随体重增加而增加这一事实, 我们观察到的偏差异速增长标度表明, 对最受威胁物种的家域估计可能也最不准确。为了修正这一偏差, 我们测试了数据抽稀和考虑自相关的家域估计是否能最大程度减少自相关对面积估计的尺度效应。数据抽稀需要丢弃约 93% 的数据才能达到 95% 置信的统计独立性, 因此该方法不可行。比较起来, 考虑自相关的家域估计始终可以获得准确估计, 而与动物体型无关。当将体重与家域大小联系起来时, 我们发现校正自相关会导致标度指数显著大于1, 这意味着相关关系的标度在体型最大的物种中发生了显著的变化。 【翻译: 胡怡思; 审校: 聂永刚】.
Keywords: allometry; alometría; animal movement; area-based conservation; autocorrelación; autocorrelation; conservación basada en áreas; diseño de reserva; distribución local; escalamiento; estimación de densidad del núcleo; home range; kernel density estimation; movimiento de mamíferos; reserve design; scaling; 保护区设计; 动物移动; 区域保护; 家域; 异速增长; 标度; 核密度估计; 自相关.
© 2020 The Authors. Conservation Biology published by Wiley Periodicals LLC on behalf of Society for Conservation Biology.
Figures
References
-
- Adler G, Endries M, Piotter S. 1997. Spacing patterns within populations of a tropical forest rodent, Proechimys semispinosus, on five Panamanian islands. Journal of Zoology 241:43–53.
-
- Agnarsson I, Kuntner M, May‐Collado LJ. 2010. Dogs, cats, and kin: a molecular species‐level phylogeny of carnivora. Molecular Phylogenetics and Evolution 54:726–745. - PubMed
-
- Barriel V, Thuet E, Tassy P. 1999. Molecular phylogeny of Elephantidae. Extreme divergence of the extant forest African elephant. Comptes Rendus de l'Acad´emie des Sciences‐Series III‐Sciences de la Vie 322:447–454. - PubMed
-
- Barton´ KA, Zwijacz‐Kozica T, Zieba F, Sergiel A, Selva N. 2019. Bears without borders: long‐distance movement in human‐dominated landscapes. Global Ecology and Conservation 17:e00541.
Publication types
MeSH terms
Grants and funding
LinkOut - more resources
Full Text Sources
Research Materials
