. 2020 Jun 16;52(6):1057-1074.e7.
doi: 10.1016/j.immuni.2020.04.001. Epub 2020 May 1.

Niche-Specific Reprogramming of Epigenetic Landscapes Drives Myeloid Cell Diversity in Nonalcoholic Steatohepatitis

Affiliations

Niche-Specific Reprogramming of Epigenetic Landscapes Drives Myeloid Cell Diversity in Nonalcoholic Steatohepatitis

Jason S Seidman et al. Immunity. .

Abstract

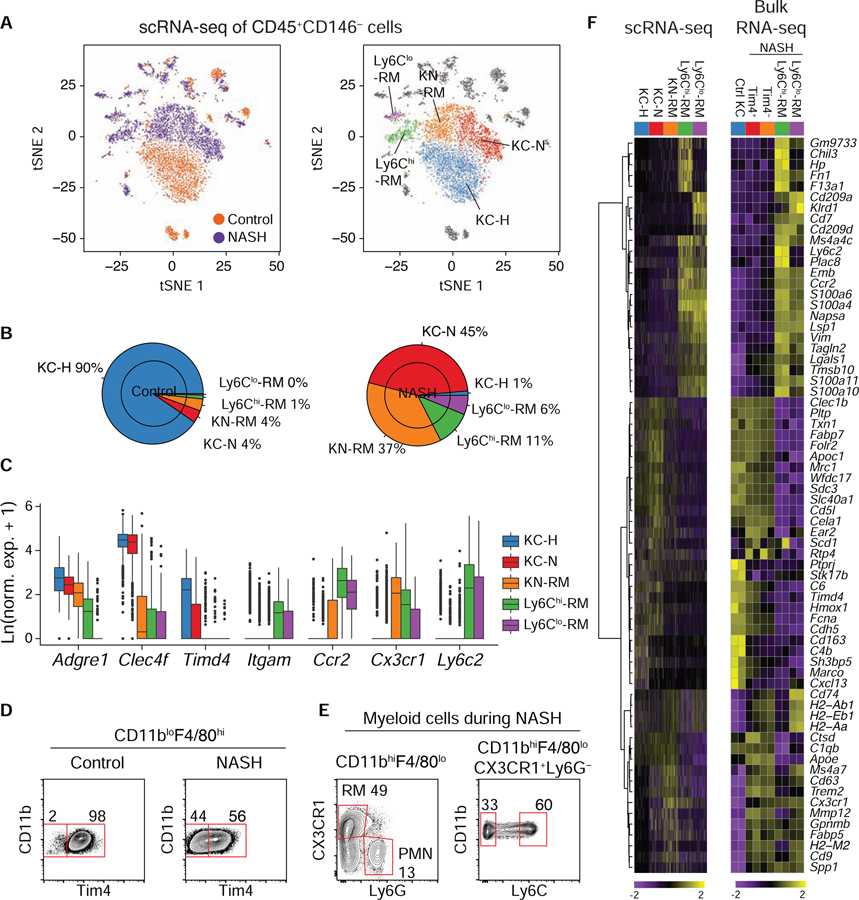
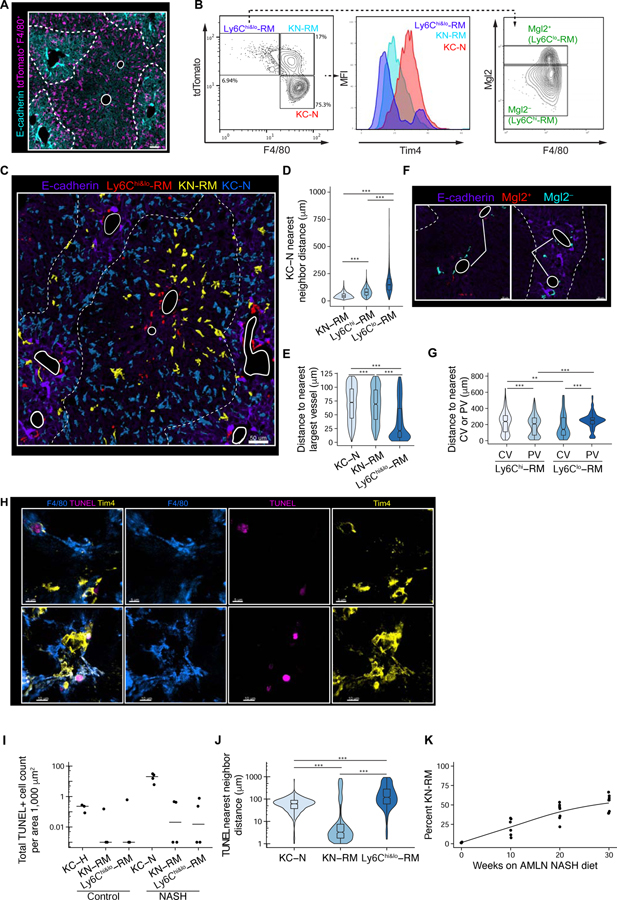
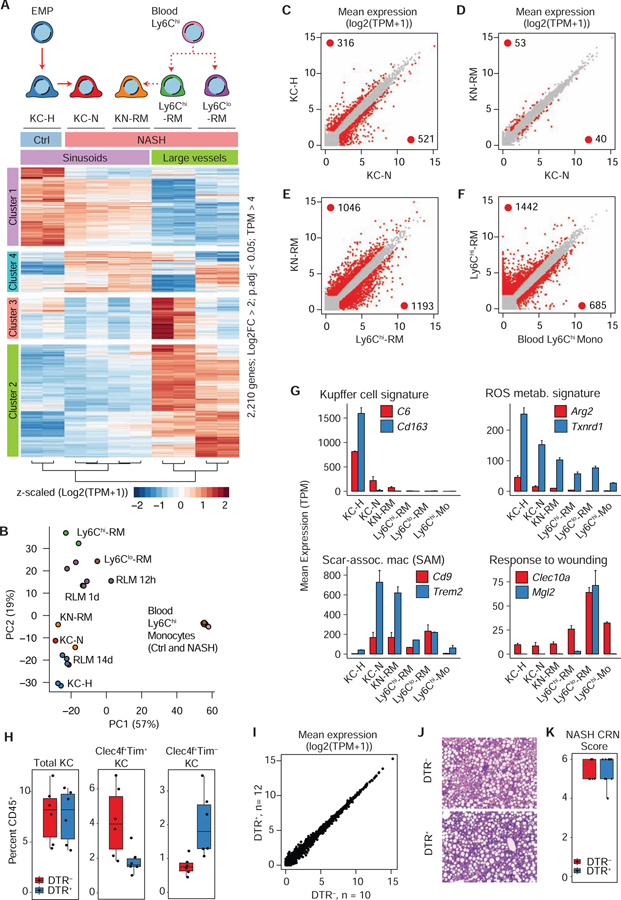
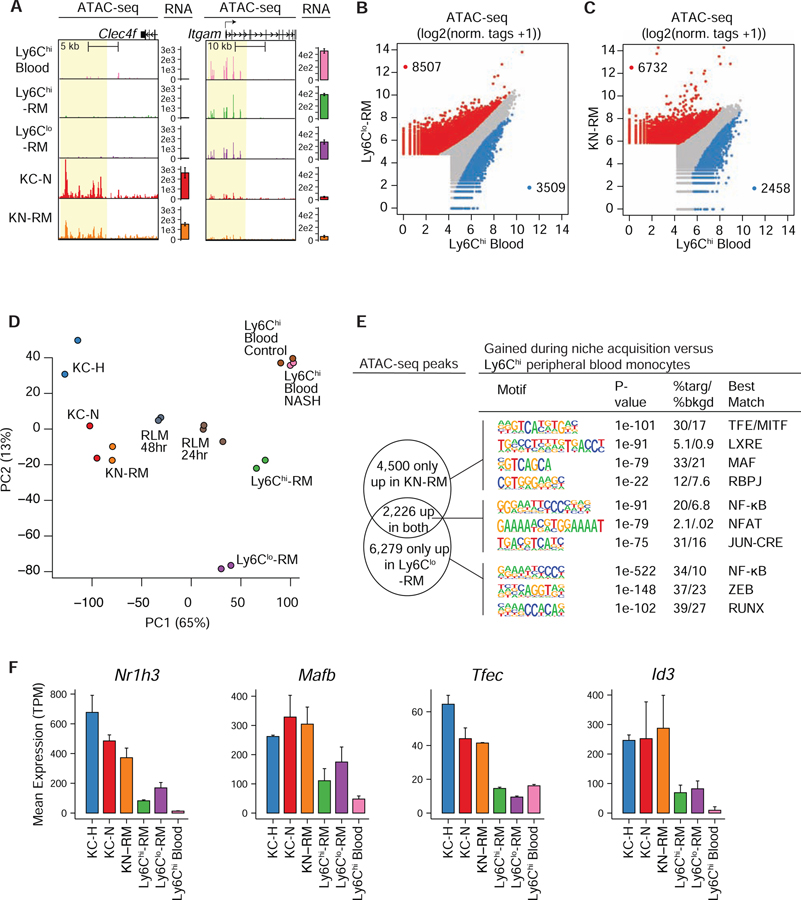
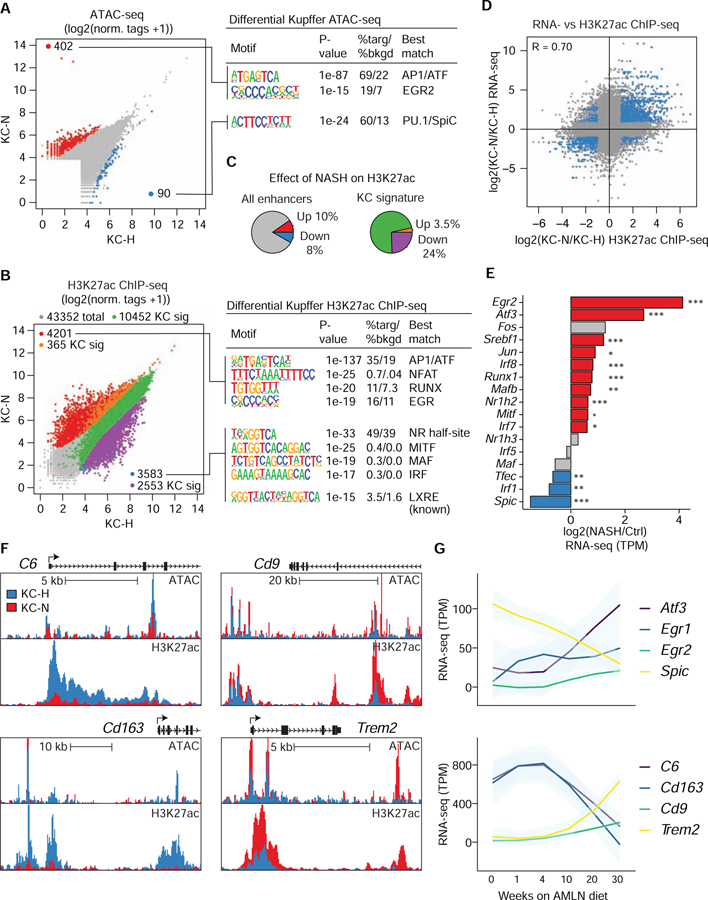
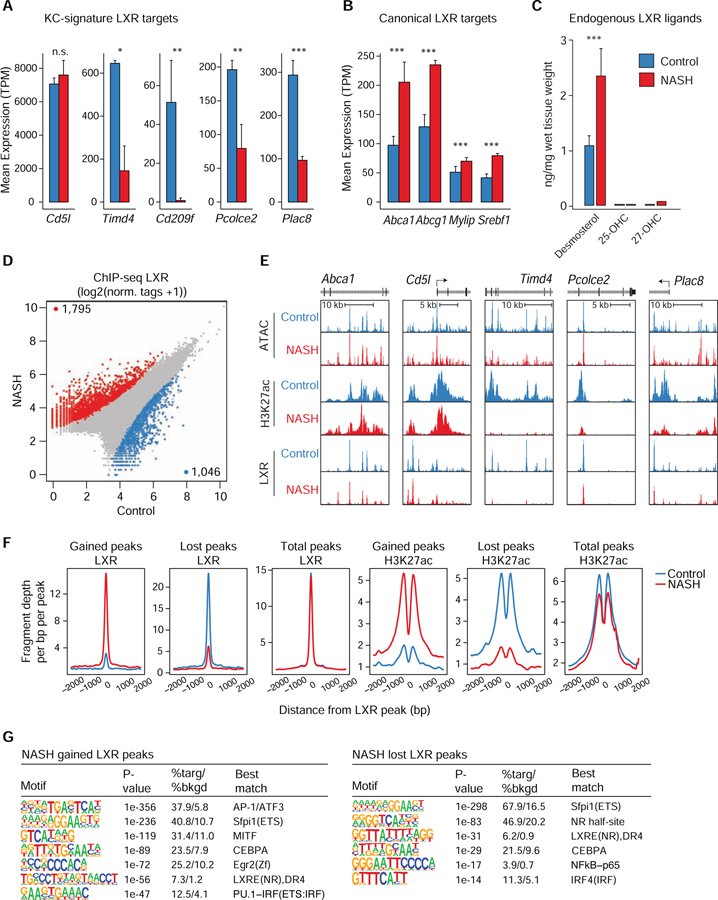
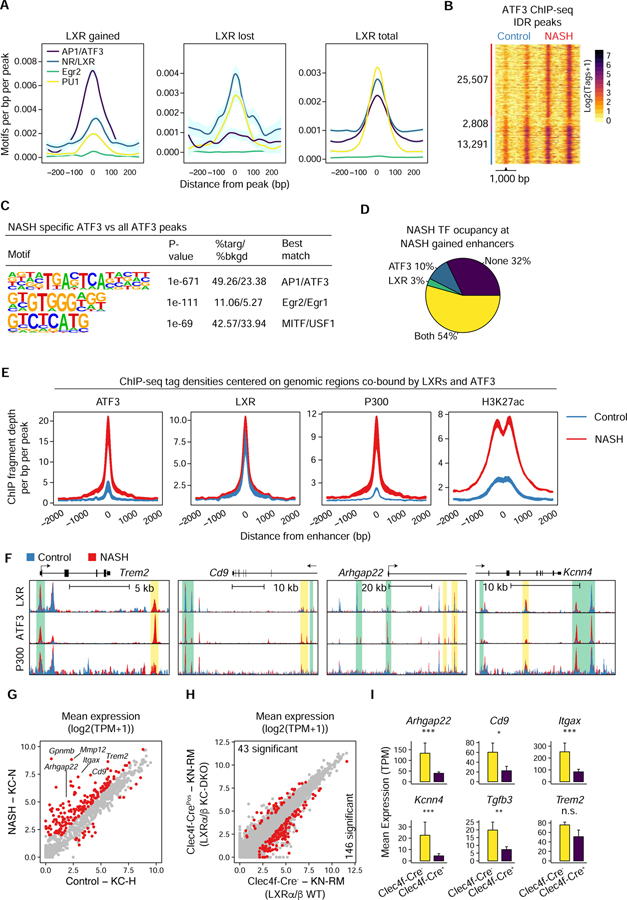
Tissue-resident and recruited macrophages contribute to both host defense and pathology. Multiple macrophage phenotypes are represented in diseased tissues, but we lack deep understanding of mechanisms controlling diversification. Here, we investigate origins and epigenetic trajectories of hepatic macrophages during diet-induced non-alcoholic steatohepatitis (NASH). The NASH diet induced significant changes in Kupffer cell enhancers and gene expression, resulting in partial loss of Kupffer cell identity, induction of Trem2 and Cd9 expression, and cell death. Kupffer cell loss was compensated by gain of adjacent monocyte-derived macrophages that exhibited convergent epigenomes, transcriptomes, and functions. NASH-induced changes in Kupffer cell enhancers were driven by AP-1 and EGR that reprogrammed LXR functions required for Kupffer cell identity and survival to instead drive a scar-associated macrophage phenotype. These findings reveal mechanisms by which disease-associated environmental signals instruct resident and recruited macrophages to acquire distinct gene expression programs and corresponding functions.

Keywords: ATF3; ChIP-seq; Kupffer cell; LXR; TREM2; epigenetics; genomics; nonalcoholic steatohepatitis; scRNA-seq; tissue macrophage.


Conflict of interest statement

Declaration of Interests J.L.W. and X.S. are named inventors on patent applications or patents related to the use of oxidation-specific antibodies that are held by UCSD. J.L.W. is a consultant to Ionis Pharm and is a scientific founder of Oxitope, Inc.

Figures

Figure 1:
Figure 1:. Transcriptional diversity of hepatic macrophages during NASH
A. tSNE projections of identified graph-based cell clusters from scRNA-seq data derived from hepatic CD45+CD146 cells from control mice or mice fed a NASH diet for 30 weeks. (Left) cells are colored based on dietary condition. (Right) cells are colored based on cell identity of the five major myeloid cells identified. Data represent two independent donor mice per group. B. Macrophage proportions from A for control mice (left) or mice with NASH (right). C. Gene expression of normalized scRNA-seq data of genes supporting cluster identities. D. Terminal FACS gates for purification of KCs from control mice (left), or CD11bloF4/80hiTim4+ and Tim4 cells from mice with NASH (right). E. Terminal FACS gates for purification of Ly6Chi and Ly6Clo CD11bhiF4/80loLy6G CX3CR1+ recruited hepatic macrophages (RM). “PMN” stands for polymorphonuclear leukocyte. F. Comparison of myeloid clusters defined by scRNA-seq (left) and bulk RNA-seq (right) for the corresponding sorted populations. Left heatmap (100 cell per column) depicts normalized and scaled expression values for marker genes identified using a Wilcoxon rank sum test through Seurat. Right heatmap shows z-normalized row expression of each gene for RNA-seq from bulk purified cell populations from independent biological duplicates. Please see also Figure S1.
Figure 2:
Figure 2:. Expanded macrophage diversity during NASH is supported by monocyte recruitment and occupancy of distinct anatomical niches
A. Confocal image of NASH liver showing E-cadherin (to demark the peri-portal regions) and tdTomato F4/80+ summed channel. Highlighted in the center by white circles are the central veins (CV). Demarked at the periphery of the liver lobule, portal-venous/arterial vessels (PV). N=3–4 mice/condition. B. Histo-cytometry analysis of NASH liver sample. Statistical information of segmented objects (F4/80+tdTomato+ surfaces) was imported into FlowJo and subsequently gated on F4/80 and tdTomato expression to quantify KC-N, KN-RM, and Ly6Chi&lo-RM cells. Tim4 mean fluorescence intensity (MFI) for each gated population are shown in the middle panel, and Mgl2 expression on Ly6Chi&lo-RM cells macrophage is shown at right to distinguish Ly6Chi (Mgl2) or Ly6Clo (Mgl2+) cells. C. Confocal image of NASH liver showing distribution of rendered surfaces of KC-N, KN-RM, and Ly6Chi&lo-RM (Rec) cells. Dashed lines denote peri-portal regions as in A. D. Distance and phenotype (KN-RM, Mgl2lo-RM, or Mgl2hi-RM) of closest neighbor to KC-N cells in NASH livers. Data pooled from n=4 mice. Wilcox Two-sided test; p < 0.001(***). E. Distance to nearest portal or central vein vasculature (large diameter vessels defined to be greater than 15 µm in diameter) of KC-N, KN-RM, and Ly6Chi&lo-RM cells. Kruskal-Wallis with Dunn test; p < 0.001(***). F. Zoom-in representative confocal image of NASH liver showing distribution of rendered surfaces of Mgl2lo (Ly6Chi) and Mgl2hi (Ly6Clo)-RMs. E-cadherin demarks the peri-portal regions and highlighted by white circles are CV and PV blood vessels. G. Distance to nearest center of CV or PV of Ly6Chi and Ly6Clo RM cells (µm). Kruskal-Wallis with Dunn test; p < 0.01(**), p < 0.001. H. Immunofluorescence (IF) image assessing in situ cell death via TUNEL staining in addition to Tim4 and F4/80 staining. Image from NASH mice; maximum intensity projection (MIP) of a 20-µm z-stack. I. Quantification of total TUNEL+ hepatic macrophages per area (1000 µm2) in Ctrl and NASH mouse livers. J. Nearest neighbor distance of all TUNEL+ cells to KN-RM, Ly6Chi or lo-RM and KC-N cells in NASH livers, data pooled from n=4 mice. Kruskal-Wallis with Dunn test; p < 0.001(***). K. Temporal assessment of percentage of total CD11bloF4/80+CD146 cells that are Tim4 KN-RM from mice fed a NASH diet as indicated. Please see also Figure S2 and Figure S3.
Figure 3:
Figure 3:. Highly divergent gene expression patterns across myeloid populations in NASH
A. Unsupervised hierarchical clustering of DE genes in the indicated cell types in control and NASH liver. B. PCA of 2,000 most variable genes in RNA-seq data from myeloid cells in liver and blood from healthy and NASH diet fed mice, or recruited liver macrophages from Sakai et al. (Sakai et al., 2019), n = 2–3 per group. C. Scatterplot of RNA-seq data in healthy (KC-H) or NASH (KC-N) Tim4+ KCs. DE genes identified by DESeq2 (FC > 2, p-adj < 0.05) are colored in red. D. Comparison of NASH Tim4+ KCs (KC-N) and Tim4 Kupffer niche recruited macrophages (KN-RM). E. Comparison of NASH Tim4 Kupffer niche recruited macrophages (KN-RM) and Ly6Chi-RM. F. Comparison of NASH blood Ly6Chi monocytes and Ly6Chi-RM. G. RNA-seq expression (mean TPM +/− SD) of representative genes. TPM = transcripts per kilobase million). H. Percentage of hepatic CD45+F4/80hiCD11bloLiveSinglets from Clec4f-cre R26-iDTR−/− (n = 6) or Clec4f-cre R26i-DTR+ (n =6) mouse livers. Mice were treated with DT, allowed to rest for 4 weeks, then fed the CDAHFD diet for 4 weeks. I. RNA-seq from whole liver tissue from Clec4f-cre R26-iDTR−/− (n = 10) or Clec4f-cre R26-iDTR+ mice (n =12) as in H. Zero DE genes (DESeq2). J. Representative (n > 5) H&E staining of liver tissue. K. NASH CRN scoring of stained liver sections. Scores >5 are indicative of steatohepatitis. No significant difference was identified using Kruskal-Wallis rank sum test (p = 0.71). Please see also Figure S4.
Figure 4:
Figure 4:. Niche-specific reprogramming of epigenetic landscapes
A. UCSC genome browser tracks of ATAC-seq signals in the vicinities of the Clec4f and Itgam genes in the indicated cell types. Bar plots to the right of each track represent the RNA-seq gene expression (mean TPM +/− SD) in each population. B. Genome-wide comparison of normalized ATAC-seq peak tags at enhancer like regions (>3kb removed from TSS) comparing Ly6Chi blood monocytes and Ly6Clo-RM during NASH. Differential regions were identified using DESeq2 (FC > 2 and p-adj < 0.05 using independent biological duplicates). C. Genome-wide comparison of normalized ATAC-seq peak tags at enhancer-like regions (>3kb removed from TSS) comparing open chromatin in Ly6Chi blood monocytes and KN-RM. D. PCA of ATAC-seq data sets (N = 2–3) for the top 10,000 most variable distal (>3kb from TSS) regions in myeloid cell populations during NASH, or recruited liver macrophages (RLM) from Sakai et al. (Sakai et al., 2019). E. De novo motifs enriched in distal open chromatin regions (>3kb from TSS) enriched in KN-RM (top), Ly6Clo-RM (bottom), or enriched in both populations (middle) compared to Ly6Chi blood monocytes during NASH. The background for motif enrichment analysis is the distal open chromatin from Ly6Chi blood monocytes. F. Expression (mean TPM +/− SD) of KC LDTFs in the indicated cell types. Please see also Figure S5.
Figure 5:
Figure 5:. The NASH diet alters the activity states of resident KC enhancers
A. (Left) Normalized ATAC-seq signal at all distal open chromatin regions (> 3kb from TSS) in Tim4+ KCs from healthy mice (KC-H) or Tim4+ KCs from mice on NASH diet (KC-N). Regions with significantly more chromatin accessibility during NASH are colored in red while regions with less accessibility during NASH are colored blue. (Right) De novo motif enrichment from differentially accessible chromatin region shown at right. B. (Left) H3K27ac ChIP-seq signal around distal (> 3kb from TSS) ATAC-seq peaks in a 2,000 bp window. Differentially acetylated regions were determined using DESeq2 (FC > 2, p-adj < 0.05). Regions overlapping with KC signature enhancers (Figure S6A) are colored green. Enhancers with more acetylation during NASH are colored red, or orange if also a KC signature enhancer. Enhancers with less acetylation during NASH are colored blue, or purple if also a KC signature enhancer. (Right) Representative motif enrichment from differentially acetylated chromatin regions. C. Summaries of percent representation of (left) differentially activated enhancers between control and NASH KCs, or (right) differentially acetylated enhancers intersected with the KC signature enhancers. D. Ratio-ratio plot depicting fold change in H3K27ac ChIP-seq signal at enhancers (2,000 bp window centered on ATAC-seq peaks > 3kb from TSS) compared to fold change in mRNA expression of closest gene annotated to enhancer region in Tim4+ KCs in NASH diet mice (KC-N) versus healthy mice (KC-H). Points colored in blue are significantly different (FC > 2, p-adj < 0.05) for both H3K27ac ChIP-seq signal at enhancers and closest mRNA. Pearson correlation of 0.70 denotes relationship between the highlighted differential data points. E. Log2FC of candidate TFs known to bind DNA elements found enriched in (B) for KCs from healthy mice (KC-H) and NASH mice (KC-N). *p-adj < 0.05, **p-adj < 0.01, and ***p-adj < 0.001 using DESeq2. F. UCSC genome browser tracks of ATAC-seq or H3K27ac ChIP-seq signals in the vicinities of the indicated genes. G. Mean TPM (LOESS fit) of the indicated genes in Tim4+ KCs from mice fed the AMLN NASH diet as indicated (0 week: n = 3; 1 week: n = 2; 4 week: n = 2; 10 week: n = 3; 20 week: n = 3; 30 week: n = 4). Please see also Figure S6.
Figure 6:
Figure 6:. Genome wide occupancy of LXR binding in KCs during NASH
A. RNA-seq expression (mean TPM +/− SD) of LXR dependent KC signature genes. *p-adj < 0.05, **p-adj < 0.01, and ***p-adj < 0.001 using DESeq2. B. RNA-seq expression (mean TPM +/− SD) of canonical LXR target genes. C. Quantification of desmosterol, 24-, 25- and 27-OHC and 24,25-EC in livers from control or NASH mice. *** = p < 0.001. D. Mean LXR ChIP-seq signal at merged IDR peaks from KC nuclei. Nuclei were sorted from Clec4f-Cre-NLS-TdTomato mice fed either a control diet (n = 2) or the NASH diet for 20 weeks (n = 2). Peaks with significantly altered LXR binding were determined using DESeq2 (FC > 2, p-adj < 0.05). E. ATAC-seq, H3K27ac ChIP-seq and LXR ChIP-seq signals in the vicinities of the indicated genes. F. Normalized distribution of LXR ChIP-seq density or H3K27ac ChIP-seq density at enhancers with either significantly altered LXR binding during NASH or all LXR bound enhancers. G. (Left) De novo motif enrichment for NASH gained LXR peaks (right) or NASH lost LXR peaks (right) shown in 7D. Please see also Figure S7.
Figure 7:
Figure 7:. Combinatorial actions of LXR and ATF3 coordinate NASH responsive gene expression in KCs during NASH
A. Motif frequency within 500 bp of LXR binding sites described in Figure 6F. B. Normalized ATF3 ChIP-seq signal at merged IDR peaks from KC nuclei. Nuclei were sorted from Clec4f-Cre-NLS-TdTomato mice fed either a control diet or the NASH diet for 20 weeks (n = 2). Significant ATF3 peaks had Poisson enrichment p-value < 0.0001 and FC > 4. C. De novo motif enrichment for NASH specific ATF3 peaks as in 7B. D. Intersection of ATF3 and/or LXR IDR ChIP-seq peaks from KC nuclei isolated from NASH diet fed mice with enhancers with increased activity during NASH (from Figure 5B). E. Normalized distribution of ChIP-seq tag density at sites co-bound by LXRs and ATF3 indicated in 7D. F. UCSC genome browser tracks of LXR, ATF3 and P300 ChIP-seq signals in the vicinities of the indicated genes. Peaks with NASH-gained (HOMER) binding for both LXR and ATF3 are shaded yellow and peaks with only gained ATF3 are shaded green. G. Mean expression (TPM) for genes nearest to NASH specific LXR peaks co-bound by ATF3. DE genes identified using p-adj < 0.05 and FC > 2. H. RNA-seq (n = 2 per group) of KN-RM from control mice or Clec4fCre-LXRαfl/flLXRβfl/fl mice fed the NASH diet for 20 weeks. DE genes identified as in G. I. As in H for selected genes. **p-adj < 0.01; ***p-adj < 0.001. Please see also Figure S7.

Comment in

References

    1. Baddeley A, Rubak E, and Turner R (2016). Spatial point patterns : methodology and applications with R (Boca Raton; London; New York: CRC Press, Taylor & Francis Group; ).
    1. Bain CC, Bravo-Blas A, Scott CL, Perdiguero EG, Geissmann F, Henri S, Malissen B, Osborne LC, Artis D, and Mowat AM (2014). Constant replenishment from circulating monocytes maintains the macrophage pool in the intestine of adult mice. Nat Immunol 15, 929–937. - PMC - PubMed
    1. Bonnardel J, T’Jonck W, Gaublomme D, Browaeys R, Scott CL, Martens L, Vanneste B, De Prijck S, Nedospasov SA, Kremer A, et al. (2019). Stellate Cells, Hepatocytes, and Endothelial Cells Imprint the Kupffer Cell Identity on Monocytes Colonizing the Liver Macrophage Niche. Immunity 51, 638–654 e639. - PMC - PubMed
    1. Buch T, Heppner FL, Tertilt C, Heinen TJ, Kremer M, Wunderlich FT, Jung S, and Waisman A (2005). A Cre-inducible diphtheria toxin receptor mediates cell lineage ablation after toxin administration. Nat Methods 2, 419–426. - PubMed
    1. Buenrostro JD, Giresi PG, Zaba LC, Chang HY, and Greenleaf WJ (2013). Transposition of native chromatin for fast and sensitive epigenomic profiling of open chromatin, DNA-binding proteins and nucleosome position. Nat Methods 10, 1213–1218. - PMC - PubMed

Publication types

MeSH terms