. 2020 Jul 8;107(1):52-64.e7.
doi: 10.1016/j.neuron.2020.04.003. Epub 2020 May 1.

Molecular Basis for Synaptotagmin-1-Associated Neurodevelopmental Disorder

Affiliations

Molecular Basis for Synaptotagmin-1-Associated Neurodevelopmental Disorder

Mazdak M Bradberry et al. Neuron. .

Abstract

At neuronal synapses, synaptotagmin-1 (syt1) acts as a Ca2+ sensor that synchronizes neurotransmitter release with Ca2+ influx during action potential firing. Heterozygous missense mutations in syt1 have recently been associated with a severe but heterogeneous developmental syndrome, termed syt1-associated neurodevelopmental disorder. Well-defined pathogenic mechanisms, and the basis for phenotypic heterogeneity in this disorder, remain unknown. Here, we report the clinical, physiological, and biophysical characterization of three syt1 mutations from human patients. Synaptic transmission was impaired in neurons expressing mutant variants, which demonstrated potent, graded dominant-negative effects. Biophysical interrogation of the mutant variants revealed novel mechanistic features concerning the cooperative action, and functional specialization, of the tandem Ca2+-sensing domains of syt1. These mechanistic studies led to the discovery that a clinically approved K+ channel antagonist is able to rescue the dominant-negative heterozygous phenotype. Our results establish a molecular cause, basis for phenotypic heterogeneity, and potential treatment approach for syt1-associated neurodevelopmental disorder.


Conflict of interest statement

Declaration of Interests The authors declare no competing interests.

Figures

Figure 1.
Figure 1.. X-ray crystallographic structures of human syt1 C2B domains harboring disease-associated mutations.
(A) Schematic diagram of full-length syt1 embedded in a synaptic vesicle membrane. Each C2 domain was rendered from an X-ray crystal structure (C2A: PDB 1RSY, Sutton et al. 1995; C2B: 6TZ3, this work). The membrane is drawn to scale, and the N-terminal segments before C2A were added with a drawing program to illustrate the topology of syt1. Ca2+ ligands are rendered in wireframe, and Ca2+ ions are shown as orange spheres. (B) X-ray crystal structures of human syt1 C2B domains harboring disease-associated mutations. In each case, the overall fold of the WT C2 domain is preserved, and differences in the positions of Ca2+-binding/membrane-penetration loops are attributable to crystal packing. (C) Comparison of WT and mutant Ca2+-binding sites. The WT structure was rendered in grey and overlaid on each mutant to illustrate the effect of each mutation on the Ca2+-binding pocket: D304G removes an acidic Ca2+ ligand; D366E preserves the ligand but makes the binding pocket smaller; and I368T reduces the hydrophobicity of the membrane-penetrating tip of a Ca2+-binding loop.
Figure 2.
Figure 2.. Disease-associated syt1 variants fail to support synaptic transmission but have distinct phenotypes.
In this and all subsequent figures, amino acid numbers corresponding to the murine protein are used. (A) Confocal micrographs of cultured hippocampal neurons expressing WT or mutant syt1 variants immunolabeled for syt1 and the presynaptic marker synaptophysin (syp). Scale bar, 10 μm. (B) Colocalization of syt1 variants and syp was quantified via calculation of Pearson’s correlation coefficient. No significant differences were observed between WT and mutant variants (n = 9–12 fields of view from 3–4 coverslips from at least 2 cultures). (C) Scheme of whole-cell patch clamp measurement of synaptic transmission in cultured neurons. (D) Average traces of evoked IPSCs from neurons expressing no syt1 (KO), WT, or mutant syt1 variants. Stimulus artifacts are removed from KO and mutant traces for clarity. (E) Evoked IPSCs shown with normalized amplitude on an expanded timescale. (F-H) Quantification of IPSC parameters. (I) Quantification of miniature IPSC frequency, recorded in TTX without stimulation. For panels D-I, n = 10–15 cells from at least 2 separate cultures. Significance values: *, p < 0.05 vs. WT; **, p < 0.006 against WT; #, p < 0.05 vs KO, ##, p < 0.005 vs KO (Kruskal-Wallis test with Dunn’s multiple comparison test). See also Fig. S2.
Figure 3.
Figure 3.. Co-expression of mutant and WT syt1 defines a dominant-negative action for each mutation that varies in potency.
(A) Scheme of approach used to address dominant-negative activity for each mutant. Quantification of expression level was performed in parallel with optical imaging of evoked neurotransmitter release. (B) Representative immunoblot and loading control (CBB: Coomassie Brilliant Blue) for syt1 quantification experiments. (C) Representative field of view for iGluSNFR imaging; scale bar, 25 μm. (D) Representative raw traces for iGluSnFR imaging of samples expressing only WT syt1 or WT syt1 in combination with mutant syt1. These traces correspond to the same experiment for which protein quantification is shown in panel (B). In each case, the same amount of lentivirus used to achieve the WT expression shown in panel (B) was used, with either a low or high dose lentivirus encoding mutant syt1 added simultaneously. (E) The normalized fluorescence transient (dF/F0) upon the first stimulus pulse was plotted against the ratio of WT and mutant protein expressed using the same lentivirus dose in the same experiment. Each point represents an average of 4 fields of view from a single coverslip. Pooled results were plotted on a log-linear plot and fit by regression. Shaded regions depict 95% confidence intervals (CIs). (F) The 95% CIs corresponding to the log-linear model at 1:1 mutant:WT expression are plotted, demonstrating the increased dominant-negative potency of variants D303G and I367T over D365E. (G) As in panel (E), but for the amplitude of the tenth fluorescence transient normalized to the first fluorescent transient (dF/F0(tenth/first)). (H) as in panel (F), but with 95% CI of the fit to dF/F0(tenth/first) at 1:1 mutant:WT expression plotted. For all experiments, n = 13–14 coverslips from at least 4 separate cultures. See also Figs. S3, S4 and Table S2.
Figure 4.
Figure 4.. Disease-associated syt1 variants cause deficits in Ca2+-dependent lipid binding activity.
(A) Scheme of the cosedimentation assay used to monitor lipid binding. (B) Representative Coomassie-stained gel showing depletion of protein from supernatant upon binding to liposomes. (C) Pooled results using the indicated lipid compositions (n = 3 independent experiments). (D) Representative Coomassie-stained gel of a cosedimentation performed while titrating [Ca2+]free. (E) Pooled results of Ca2+ titration cosedimentations (n = 3–4 independent experiments). Dose-response curves were fit using the Hill equation; error bars represent standard error. Calculated Hill coefficients are noted in the main text. Arrow indicates a point at which D365E displayed enhanced binding versus I367T (p < 0.03, Mann-Whitney test). (F) Assay scheme for measuring the kinetics of Ca2+ release from protein-membrane complexes. Ca2+, syt1 C2AB, and liposomes are combined, then rapidly mixed with the fluorescent Ca2+ indicator Quin-2. (G) Average traces for Ca2+ release kinetics; these were fit with double exponential functions (smooth lines) extrapolated to t = 0. (H) Parameters from the biexponential fits are plotted. Each mutation had minor effects on the slow component of Ca2+ release but also increased the relative amplitude of the fast component of Ca2+ release (n = 5 independent experiments). Significance values: indicated p-values indicate results of one-way ANOVA; *, p < 0.05 vs. WT, Dunnett’s multiple comparisons test. See also Figs. S5, S6.
Figure 5.
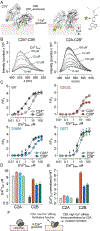
Figure 5.. Disease-associated syt1 variants disrupt a low Ca2+ affinity membrane penetration mode in C2A and a novel, high Ca2+ affinity penetration mode in C2B.
(A) Scheme illustrating the membrane penetration assay, with insertion depths depicted according to measurements of WT syt1 in Bradberry et al. (2019). Syt1 C2AB was labeled on C2A or C2B with NBD (green star) and fully adsorbed to liposomes containing 15% PS and 3% PIP2 before the addition of Ca2+. (B) Representative traces of NBD fluorescence emission from WT C2AB upon titration of Ca2+. (C) NBD fluorescence was plotted against [Ca2+]free (n = 4 unique combinations of lipid and protein batches) for WT and mutant syt1. Overlaid lines represent fits using the Hill equation (Hill coefficients noted in main text). Arrows indicate points at which F/F0 was significantly higher for D365E vs. I367T (p < 0.03, Mann-Whitney test). (D) [Ca2+]1/2 values for penetration by C2A and C2B for WT and mutant variants. Error bars represent standard errors. (E) [Ca2+]1/2 values for penetration normalized to WT. Error bars represent propagated standard errors. (F) Model depicting specialization of the individual C2 domains of syt1. See also Fig. S7.
Figure 6.
Figure 6.. Rescue of dominant-negative syt1 mutant phenotypes by a clinically approved, centrally acting K+ channel blocker.
(A) Structure and generic names of 4-aminopyridine, a centrally-acting voltage-gated K+ channel antagonist clinically approved for the treatment of multiple sclerosis. (B) Representative iGluSnFR dF/F0 traces before and after application of 5 μM 4-aminopyridine. Cultures were transduced with lentivirus to achieve ~1:1 expression of mutant and WT protein. (C) dF/F0 transients upon the first stimulation of a 10-AP train are plotted for each genotype in control bath, followed by the addition of 4-AP to 2.5 and 5 μM. The same fields of view were imaged in control and each 4-AP condition. (D) as in (C) but for dF/F0 (tenth/first). Both synaptic release parameters normalized in response to 4-AP in a dose-dependent fashion, with near-complete rescue of WT glutamate release at 5 μM 4-AP. For all experiments, n = 12–16 fields of view from 3–4 coverslips from at least 2 separate cultures. Significance values: **, p < 0.0001 vs WT; ns, p > 0.3 vs. WT (One-way ANOVA with Dunnett’s multiple comparisons test); #, p < 0.01 vs ctrl for the same genotype (paired t-test).

References

    1. Adams PD, Afonine PV, Bunkóczi G, Chen VB, Davis IW, Echols N, Headd JJ, Hung L-W, Kapral GJ, Grosse-Kunstleve RW, McCoy AJ, Moriarty NW, Oeffner R, Read RJ, Richardson DC, Richardson JS, Terwilliger TC, Zwart PH, 2010. PHENIX : a comprehensive Python-based system for macromolecular structure solution. Acta Crystallogr. D Biol. Crystallogr. 66, 213–221. 10.1107/S0907444909052925 - DOI - PMC - PubMed
    1. Alle H, Kubota H, Geiger JRP, 2011. Sparse But Highly Efficient Kv3 Outpace BKCa Channels in Action Potential Repolarization at Hippocampal Mossy Fiber Boutons. J. Neurosci. 31, 8001–8012. 10.1523/JNEUROSCI.0972-11.2011 - DOI - PMC - PubMed
    1. Bai H, Xue R, Bao H, Zhang L, Yethiraj A, Cui Q, Chapman ER, 2016. Different states of synaptotagmin regulate evoked versus spontaneous release. Nat. Commun. 7, 10971 10.1038/ncomms10971 - DOI - PMC - PubMed
    1. Bai J, Tucker WC, Chapman ER, 2004. PIP2 increases the speed of response of synaptotagmin and steers its membrane-penetration activity toward the plasma membrane. Nat. Struct. Mol. Biol. 11, 36–44. 10.1038/nsmb709 - DOI - PubMed
    1. Bai J, Wang P, Chapman ER, 2002. C2A activates a cryptic Ca2+-triggered membrane penetration activity within the C2B domain of synaptotagmin I. Proc. Natl. Acad. Sci. 99, 1665–1670. 10.1073/pnas.032541099 - DOI - PMC - PubMed

Publication types