. 2020 Apr 17:11:659.
doi: 10.3389/fimmu.2020.00659. eCollection 2020.

Optimized Whole Genome Association Scanning for Discovery of HLA Class I-Restricted Minor Histocompatibility Antigens

Affiliations

Optimized Whole Genome Association Scanning for Discovery of HLA Class I-Restricted Minor Histocompatibility Antigens

Kyra J Fuchs et al. Front Immunol. .

Abstract

Patients undergoing allogeneic stem cell transplantation as treatment for hematological diseases face the risk of Graft-versus-Host Disease as well as relapse. Graft-versus-Host Disease and the favorable Graft-versus-Leukemia effect are mediated by donor T cells recognizing polymorphic peptides, which are presented on the cell surface by HLA molecules and result from single nucleotide polymorphism alleles that are disparate between patient and donor. Identification of polymorphic HLA-binding peptides, designated minor histocompatibility antigens, has been a laborious procedure, and the number and scope for broad clinical use of these antigens therefore remain limited. Here, we present an optimized whole genome association approach for discovery of HLA class I minor histocompatibility antigens. T cell clones isolated from patients who responded to donor lymphocyte infusions after HLA-matched allogeneic stem cell transplantation were tested against a panel of 191 EBV-transformed B cells, which have been sequenced by the 1000 Genomes Project and selected for expression of seven common HLA class I alleles (HLA-A01:01, A02:01, A03:01, B07:02, B08:01, C07:01, and C07:02). By including all polymorphisms with minor allele frequencies above 0.01, we demonstrated that the new approach allows direct discovery of minor histocompatibility antigens as exemplified by seven new antigens in eight different HLA class I alleles including one antigen in HLA-A24:02 and HLA-A23:01, for which the method has not been originally designed. Our new whole genome association strategy is expected to rapidly augment the repertoire of HLA class I-restricted minor histocompatibility antigens that will become available for donor selection and clinical use to predict, follow or manipulate Graft-versus-Leukemia effect and Graft-versus-Host Disease after allogeneic stem cell transplantation.

Keywords: Graft-versus-Leukemia effect; HLA class I; allogeneic stem cell transplantation; graft versus host disease; hematological diseases; minor histocompatibility antigens; whole genome association scanning.


Figures

FIGURE 1
FIGURE 1
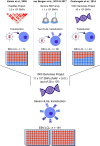
Overview of whole genome association methods for identification of minor histocompatibility antigens. Whole genome association scanning has been utilized for discovering minor histocompatibility antigens based on screening of SNPs of the HapMap Project [Kamei et al. (17)], measured by Illumina SNP array [van Bergen et al. (18)] and the 1000 Genomes Project [Oostvogels et al. (20)], using 43–80 EBV-LCLs, which had to be retrovirally transduced with the respective HLA restriction molecule or expressed only two HLAs (HLA-A*02:01 and B*07:02). The optimized panel allows screening for all SNPs and small indels of the 1000 Genomes Project and covers seven common HLAs (HLA-A*01:01, A*02:01, A*03:01, B*07:02, B*08:01, C*07:01, C*07:02) without the need for viral transduction of the HLA molecule with a panel size of 191 EBV-LCLs.
FIGURE 2
FIGURE 2
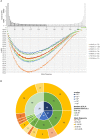
In silico evaluation of the optimized WGAs method to identify minor histocompatibility antigens. (A) In the optimized WGAs method, EBV-LCLs are scanned for 11 million SNPs with a minor allele frequency above 0.01. The upper graph shows the numbers of SNPs and their respective minor allele frequencies (black bars) in our panel of 191 EBV-LCLs from the 1000 Genomes Project. The major allele frequencies of the corresponding allelic variants (gray bars) are also shown. Based on the allele frequency and number of EBV-LCLs expressing HLA-A*01:01 (n = 72), A*02:01 (n = 102), A*03:01 (n = 71), B*07:01 (n = 79), B*08:01 (n = 59), C*07:01 (n = 62) and C*07:02 (n = 77), p-values were calculated using Fisher’s exact test. For the seven common HLA class I restriction alleles, the sample size of the panel is sufficient to identify SNPs with allele frequencies ranging between 0.02–0.82 (HLA-A*02:01) and 0.03–0.75 (HLA-B*08:01) with a p-value below 10–5. These allele frequencies correspond to population frequencies of 0.04–0.97 and 0.06–0.93, respectively, indicating that the majority of SNPs that are often mismatched in patient-donor pairs can be identified. (B) The panel of 191 EBV-LCLs from the 1000 Genomes Project was scanned for SNPs for 60 previously identified minor histocompatibility antigens that are presented by different HLA class I restriction alleles (Supplementary Table S2). Using Fisher’s exact test, p-values below 10–5 were calculated for 38 of the 39 antigens that are presented by one of the seven HLA class I alleles for which 59–102 EBV-LCLs are included in the panel. The only antigen with a p-value above 10–5 was HA-2 in HLA-A*02:01, which has a high population frequency of 0.99. In total, p-values below 10–5 were calculated for 40 of the 60 antigens, indicating that the optimized WGAs approach also allows identification of 2 antigens for which only 26–28 EBV-LCLs are included. Of the 20 antigens with p-values above 10–5, 19 antigens were presented by infrequent HLA alleles for which only 2–28 EBV-LCLs were included in the panel.
FIGURE 3
FIGURE 3
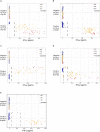
Performance of the optimized WGAs method to identify known minor histocompatibility antigens. T cell clones for HA-3T in HLA-A*01:01 (A), HA-1 in A*02:01 (B), LB-NADK-1K in A*03:01 (C), LB-ARHGDIB-1R in B*07:02 (D) and LB-GEMIN4-1V in B*08:01 (E) were tested for reactivity against 191 EBV-LCLs from the 1000 Genomes Project by IFN-γ ELISA. EBV-LCLs are divided into groups based on presence or absence of the relevant HLA class I restriction allele. Dashed lines represent thresholds that were selected to divide the EBV-LCLs into negative or positive groups based on IFN-γ values for WGAs. EBV-LCLs with intermediate values, i.e., between two threshold lines, were excluded. EBV-LCLs that are homozygous or heterozygous for the antigen-encoding SNP are represented by red and orange dots, respectively. EBV-LCLs that are homozygous for the allelic variant are represented by blue dots. In WGAs, EBV-LCLs that are negative for the HLA restriction allele as well as EBV-LCLs with intermediate IFN-γ signals (gray border) were excluded from the analysis. The optimized WGAs approach correctly identified all antigen-encoding SNPs. The p-values as calculated by Fisher’s exact test are shown in Table 1 and Supplementary Table S4.
FIGURE 4
FIGURE 4
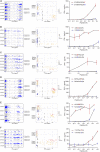
Identification of new minor histocompatibility antigens in common HLAs by optimized WGAs. T cell clones isolated from patients with hematological malignancies who responded to DLI after HLA-matched T-cell depleted alloSCT (Table 2), were tested for reactivity against 191 EBV-LCLs from the 1000 Genomes Project by IFN-γ ELISA. T-cell clones 14 (A), 3B4 (B), 2.1A12 (C), 2–90 (D), 4D8 (E) and H.9A6 (F) are shown. Data points show the IFN-γ release upon co-incubation with each of the 191 panel EBV-LCLs. First, HLA restriction was determined by analyzing EBV-LCLs that are recognized by the T cell clone for shared expression of one of the HLA class I alleles as expressed by the patient and donor (left graphs). For this purpose, the same dataset of IFN-γ values for 191 EBV-LCLs were separately displayed for each of the HLA class I alleles as expressed by the patient and donor. EBV-LCLs positive for the indicated HLA allele are shown by blue dots, while EBV-LCLs negative for this HLA are represented by gray dots. In a next step, EBV-LCLs are divided into positive and negative groups based on IFN-γ levels (indicated by dashed lines) while excluding those with intermediate IFN-γ levels (middle graphs) and WGAs is performed. SNPs that strongly associate with T cell recognition are analyzed for their distribution in EBV-LCLs that are positive and negative for the relevant SNP allele. EBV-LCLs that are homozygous or heterozygous for the associating SNP are represented by red and orange dots, respectively. EBV-LCLs that are homozygous for the allelic variant are indicated by blue dots. Gray borders represent EBV-LCLs that are excluded from the WGAs analysis based on intermediate IFN-γ levels or not expressing the relevant HLA allele. The middle graphs show results for rs4673 (A), rs8069315 (B), rs1050301 (C), rs10749693 (D), rs7080014 (rs7086691 not shown) (E) and rs1054487 (F), which have been identified as associating SNPs by WGAs (Supplementary Table S5). The p-values of detection are shown in Table 2 and Supplementary Table S6. Finally, coding regions surrounding associating SNPs were searched for peptides with predicted binding to the respective HLA restriction allele by NetMHC 4.0. Peptide candidates for potential minor histocompatibility antigens and their allelic variants were synthesized, titrated and pulsed on donor EBV-LCLs and tested for T-cell recognition by IFN-γ ELISA (right graphs). Indicated are peptide sequences for LB-CYBA-1Y (A), LB-DHX33-1C (B), LB-IMMT-1S (C), LB-YIPF1-1T (D), LB-STK32C-1R (E) and LB-MAN2B1-1T (F), which have been validated as minor histocompatibility antigens.
FIGURE 5
FIGURE 5
Identification of a novel minor histocompatibility antigen in uncommon HLAs. (A) Clone B1 from patient 6711 appeared to be restricted to HLA-A*24:02, which is expressed by 29 EBV-LCLs in our panel. (B) Due to an optimal allele frequency of 0.36, missense SNP rs4673 could be identified by WGAs. Of note, 4 of 6 EBV-LCLs that lacked expression of HLA-A*24:02 were positive for rs4673 and shared expression of HLA-A*23:01. (C) Analysis of the region surrounding rs4673 revealed a peptide with strong predicted binding to HLA-A*24:02 and A*23:01. Pulsing the peptide on donor EBV-LCLs (left) and K562 cells (right) transduced with HLA-A*24:02 or A*23:01 confirmed T-cell recognition of LB-CYBA-2Y in both HLA class I alleles.

References

    1. Singh AK, McGuirk JP. Allogeneic stem cell transplantation: a historical and scientific overview. Cancer Res. (2016) 76:6445. 10.1158/0008-5472.CAN-16-1311 - DOI - PubMed
    1. Copelan EA. Hematopoietic stem-cell transplantation. New Engl J Med. (2006) 354:1813–26. 10.1056/NEJMra052638 - DOI - PubMed
    1. Kolb H-J. Graft-versus-leukemia effects of transplantation and donor lymphocytes. Blood. (2008) 112:4371–83. 10.1182/blood-2008-03-077974 - DOI - PubMed
    1. Spierings E. Minor histocompatibility antigens: past, present, and future. Tissue Antigens. (2014) 84:374–360. 10.1111/tan.12445 - DOI - PubMed
    1. Griffioen M, van Bergen CAM, Falkenburg JHF. Autosomal minor histocompatibility antigens: how genetic variants create diversity in immune targets. Front Immunol. (2016) 7:100. 10.3389/fimmu.2016.00100 - DOI - PMC - PubMed

Publication types

MeSH terms