. 2020 Apr 21;9(1):1747688.
doi: 10.1080/2162402X.2020.1747688. eCollection 2020.

CD19-targeting fusion protein combined with PD1 antibody enhances anti-tumor immunity in mouse models

Affiliations

CD19-targeting fusion protein combined with PD1 antibody enhances anti-tumor immunity in mouse models

Zhuangwei Lv et al. Oncoimmunology. .

Abstract

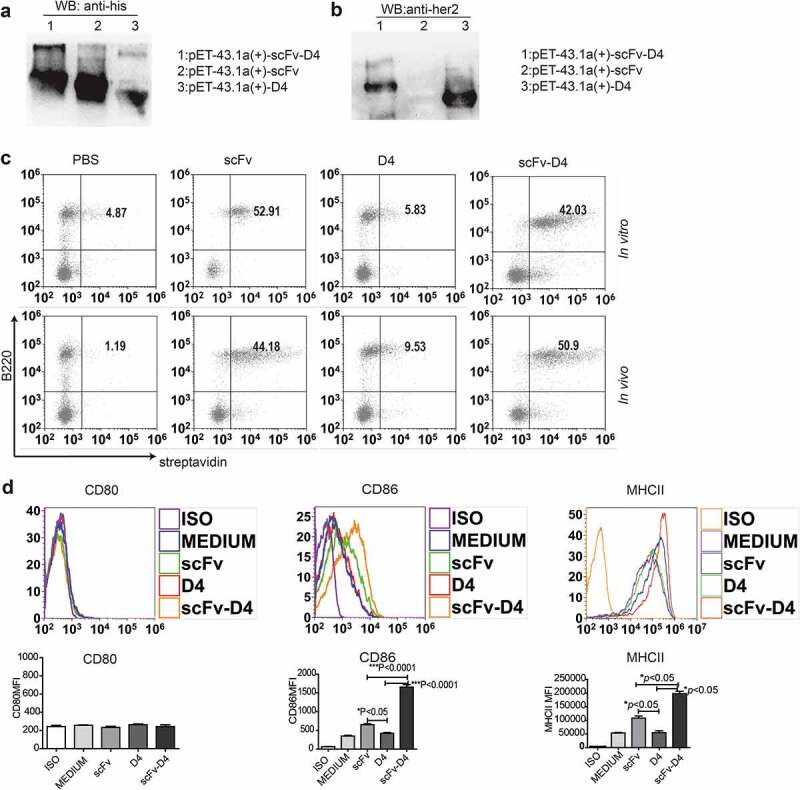
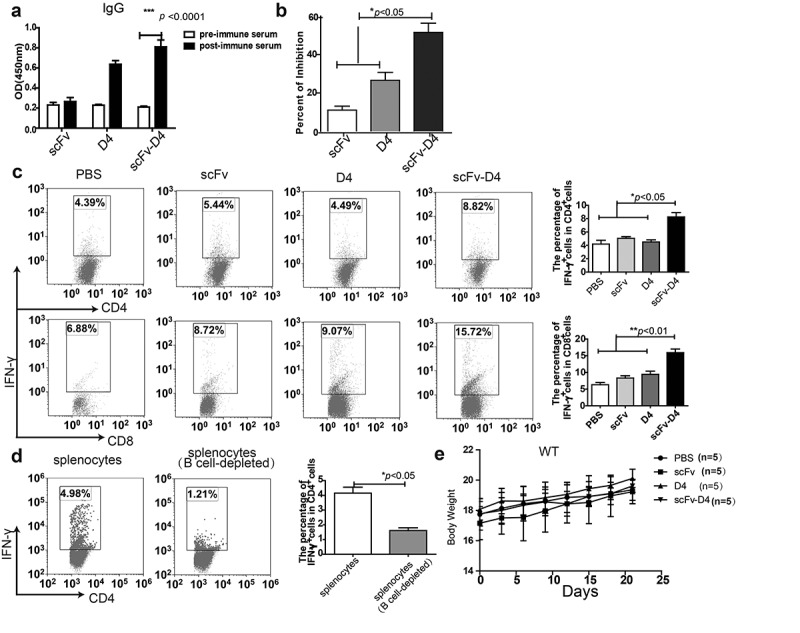
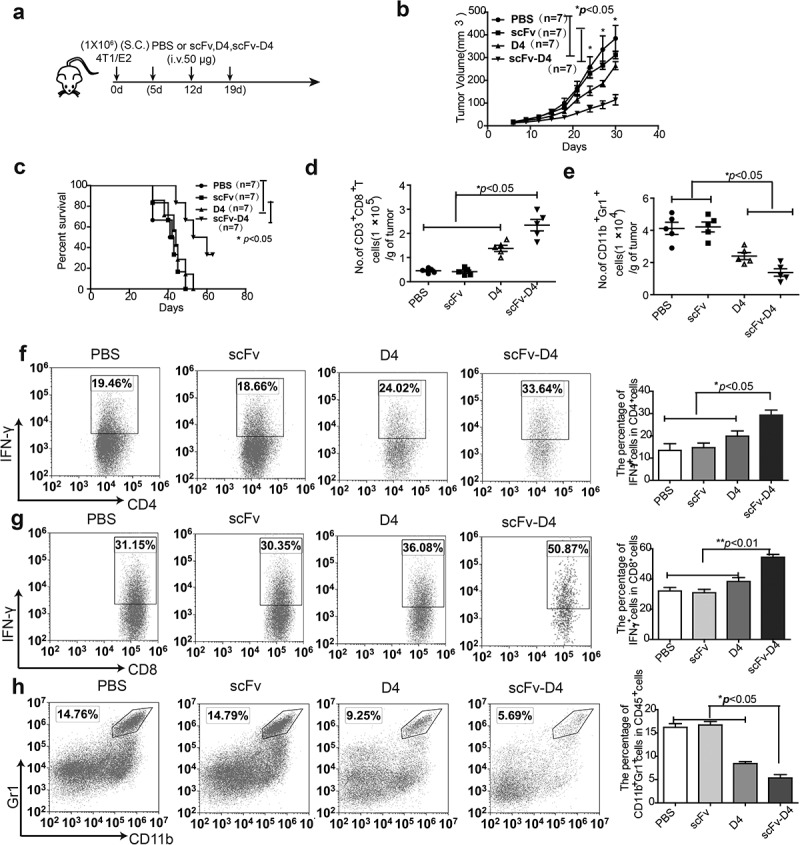
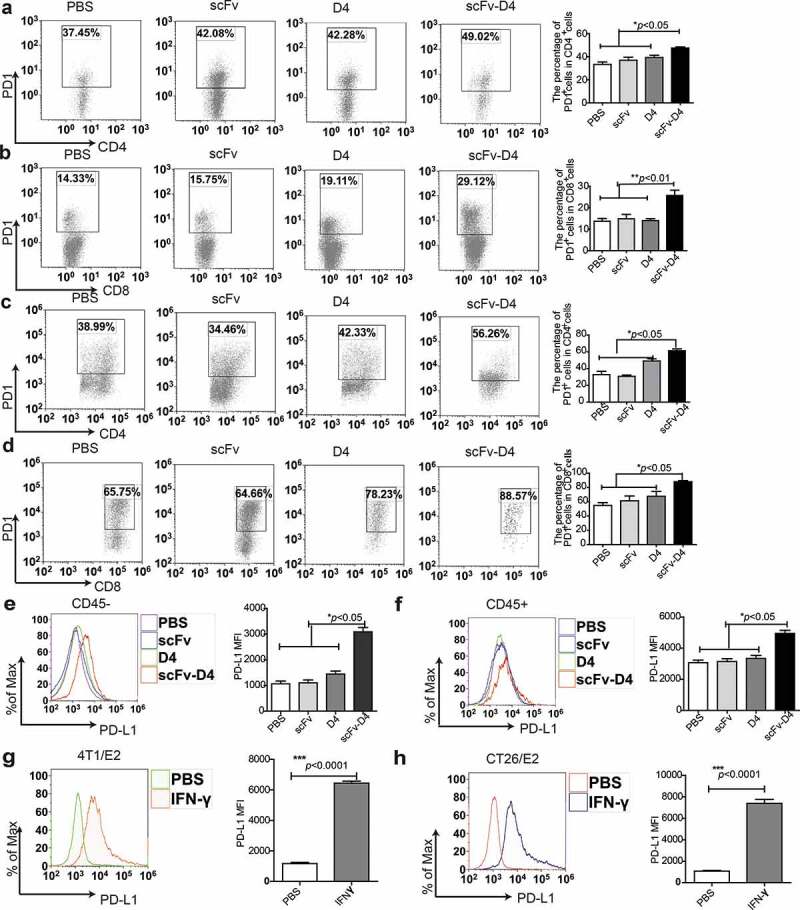
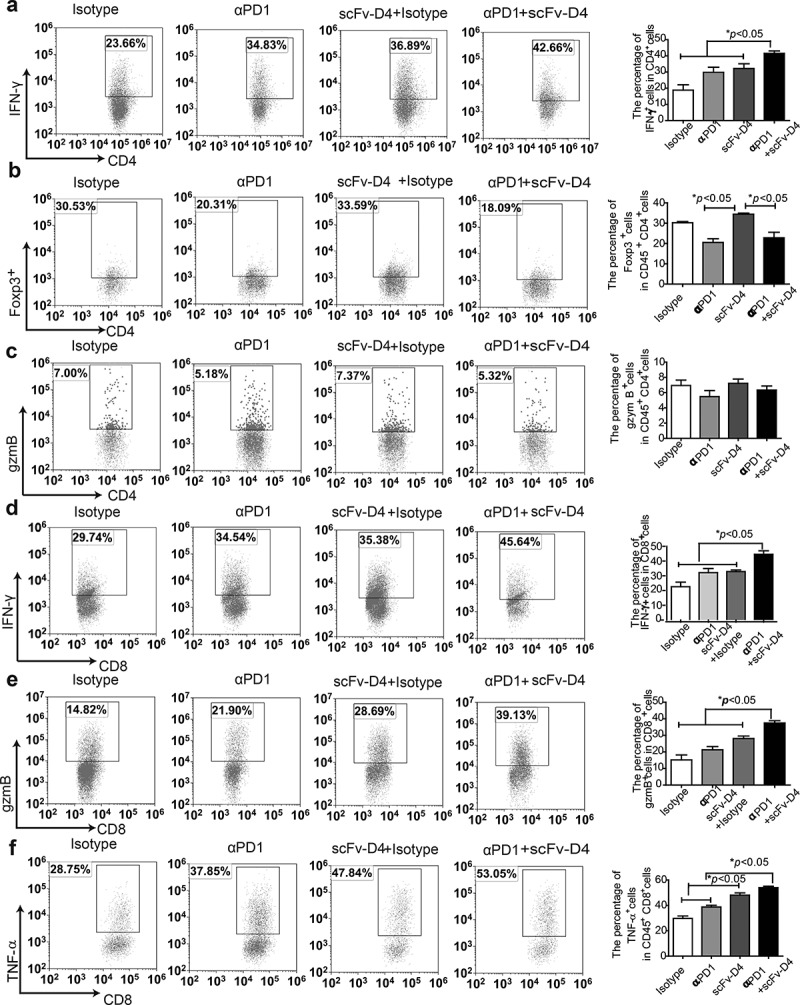
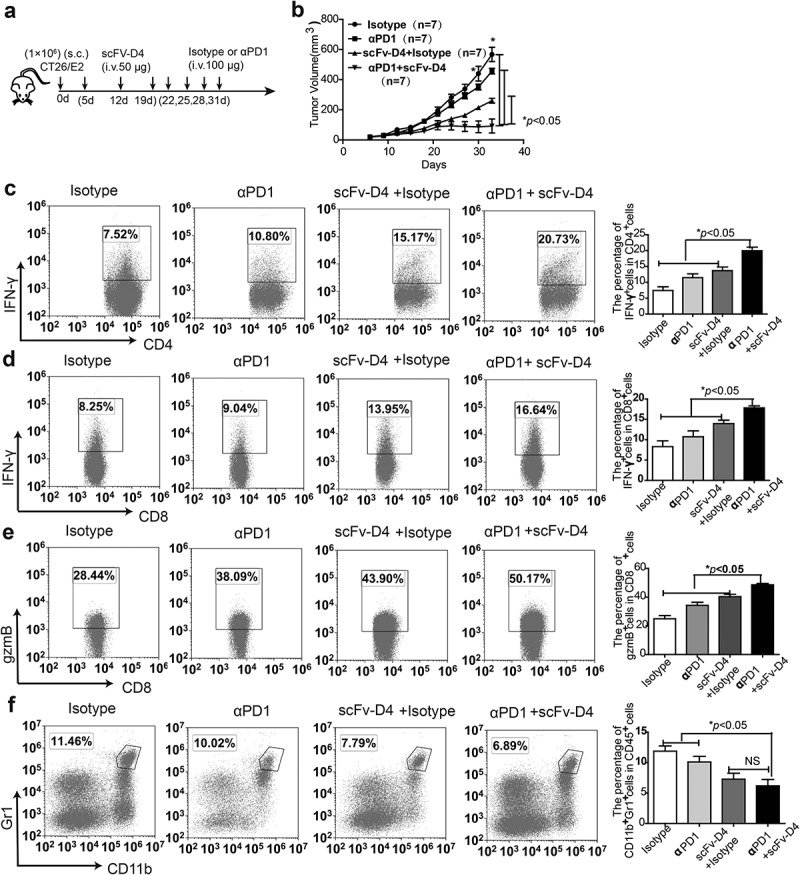
In our previous studies, using a B cell vaccine (scFv-Her2), the targeting of tumor-associated antigen Her2 (human epidermal growth factor receptor-2) to B cells via the anti-CD19 single chain variable fragment (scFv) was shown to augment tumor-specific immunity, which enhanced tumor control in the prophylactic and therapeutic setting. However, the fusion protein displayed limited activity against established tumors, and local relapses often occurred following scFv-Her2 treatment, indicating that scFv-Her2-induced responses are inadequate to maintain anti-tumor immunity. In this study, targeting the IV region (D4) of the extracellular region of Her2 to B cells via CD19 molecules (scFv-Her2D4) was found to enhance IFN-γ-producing-CD8+ T cell infiltration in tumor tissues and reduced the number of tumor-infiltrating myeloid-derived suppressor cells (MDSCs). However, negative co-stimulatory molecules such as programmed cell death protein-1 (PD-1), CD160, and LAG-3 on T cells and programmed death protein ligand-1 (PD-L1) on tumor cells were upregulated in the tumor microenvironment after scFv-Her2D4 treatment. Further, anti-PD1 administration enhanced the efficacy of scFv-Her2D4 and anti-tumor immunity, as evidenced by the reversal of tumor-infiltrating CD8+ T cell exhaustion and the reduction of MDSCs and Treg cells, which suppress T cells and alter the tumor immune microenvironment. Moreover, combining this with anti-PD1 antibodies promoted complete tumor rejection. Our data provide evidence of a close interaction among tumor vaccines, T cells, and the PD-L1/PD-1 axis and establish a basis for the rational design of combination therapy with immune modulators and tumor vaccine therapy.

Keywords: B cell vaccine; CD19; anti-PD1; breast cancer; combination therapy; immunotherapy.


Figures

Figure 1.
Figure 1.
Generation and characterization of anti-CD19 scFv fusion protein. (a, b) Lysates of OrigamiB(DE3)pLysS cells transfected with expression plasmids for CD19-scFv-D4, CD19–scFv, and her-2/neu D4. After transfection, the proteins were purified, and western blotting was performed using Abs against His-Tag (a) and her-2/neu (b).(c) For in vitro B cell binding, splenocytes were incubated with biotin-labeled scFv, D4, and scFv–D4, followed by anti-mouse B220 and streptavidin. Cells were washed and assessed by flow cytometry. For in vivo binding, biotin-labeled proteins were i.v. injected into mice. Peripheral blood was drawn 10 min after injection. Cells were stained with anti-mouse B220 and streptavidin and assessed by flow cytometry.(d) B cells were stimulated with fusion proteins, as indicated, for 24 h. Surface molecules CD80, CD86, and MHCII were assessed by flow cytometry. Data shown are representative of three independent experiments. B cells were stimulated with fusion proteins. A summary of CD80, CD86, and MHCII mean fluorescence intensity (MFI) is shown in the bar graph. ***p < .0001, *p < .05.
Figure 2.
Figure 2.
CD19-mediated Ag targeting of B cells induces antibody and T cell responses. (a, b) Mice (n = 5) were immunized with scFv, D4, or scFv–D4 (50 μg per mouse) three times at 1-week intervals; mice were bled at day 21. The sera were assessed for her2/neu–specific Abs by ELISA (a). Anti-her2/neu-specific Ab competitive inhibition assay showing that sera (1:10) from mice immunized with scFv-D4 are capable of inhibiting Herceptin-mediated binding. Percentage of inhibition is shown (b).(c) BALB/c mice (n = 3) were immunized with scFv, D4, or scFv–D4 three times at 1-week intervals. Splenocytes were harvested at day 21 and stimulated with scFv–D4 for 3 d. Assessment of intracellular production of IFN-γ by CD4+ and CD8+ T cells (c).(d) Splenocytes from immunized mice with scFv-D4 were harvested, the B cells were removed by CD19 beads, and then splenocytes with or without B cells (B cell-depleted) were stimulated with scFv–D4 for 3 d. Intracellular production of IFN-γ by CD4+ T cells is shown (d).(e) Graph showing body weight of BALB/c mice (n = 5) as a measure of systemic fusion protein toxicity.Data are representative of three experiments. Error bars represent standard error of the mean **p < .01, *p < .05.
Figure 3.
Figure 3.
Targeting Ags to B cells induces anti-tumor activity in a 4T1/E2 breast cancer model. (a) Schematic representation of subcutaneous (s.c.) 4T1/E2 tumor cell treatments applied to BALB/c mice.(b, c) BALB/c mice (n = 7) were challenged s.c. with 106 4T1/E2 tumor cells. The mice were treated with scFv, D4, or scFv–D4 three times at 1-week intervals when the tumor size (diameter) reached 3–5 mm. Tumor growth (b) and survival (c) were recorded.(d, e) BALB/c mice (n = 5) with established 4T1/E2 tumors were treated with scFv-D4, as described in Figure 3(a). Tumors were isolated on day 26, and immune cells were analyzed by flow cytometry. Shown are the numbers of tumor-infiltrating (d) CD45+CD3+CD8+ T cells and (e) CD45+ CD11b+Gr1+ cells in the different treatment groups.(f–h) Tumors were isolated on day 26, and tumor-infiltrating lymphocytes (TILs) from the tumors were stimulated with PMA and ionomycin in the presence of brefeldin A for 4 h. Intracellular production of IFN-γ by CD4+ (f) and CD8+ T cells (g) is shown. The percentage of myeloid-derived suppressor cells (MDSCs) among TILs was analyzed by flow cytometry (h).Data are representative of three experiments. Error bars represent standard error of the mean. **p < .01, *p < .05.
Figure 4.
Figure 4.
Targeting Ags to B cells promotes PD1 and PDL1 expression in the tumor microenvironment. (a, b) BALB/c mice (n = 3) were immunized with scFv, D4, or scFv–D4 three times at 1-week intervals. Splenocytes from immunized mice were stimulated with scFv–D4 (20 μg/mL) for 3 d. PD1 expression on the surface of CD4+ (a) and CD8+ T cells (b) is shown.(c,d) BALB/c mice (n = 5) with established 4T1/E2 tumors were treated with scFv-D4 as described in Figure 3(a). Tumors were isolated on day 26, and tumor-infiltrating lymphocytes (TILs) from the tumors were harvested. PD1 expression on the surface of CD4+ (c) and CD8+ T cells (d) is shown.(e, f) BALB/c mice (n = 5) with established 4T1/E2 tumors were treated with PBS, scFv, D4, or scFv-D4. Tumors were isolated on day 26, and PD-L1 expression on the surface of tumor cells (CD45 cells) and CD45+ cells were assessed by flow cytometry.(g, h) 4T1/E2 cells and CT26/E2 cells were stimulated with mouse IFN-γ (20 ng/mL), and then surface PD-L1 expression was assessed.Data are representative of three experiments. Error bars represent standard error of the mean. ***p < .0001, **p < .01,*p < .05.
Figure 5.
Figure 5.
Combined treatment with scFv-D4 and anti-PD-1 induces immune cell infiltration and shows remarkable anti-tumor activity in a 4T1/E2 breast cancer model. (a) Schematic representation of subcutaneous (s.c.) 4T1/E2 breast cancer cell treatments applied to BALB/c mice.(b, c) BALB/c mice (n = 7) were challenged s.c. with 106 4T1/E2 tumor cells. The mice were treated, as described in Figure 5(a), when the tumor size (diameter) reached 3–5 mm. Tumor growth (b) and survival (c) were recorded.(d–i) BALB/c mice (n = 5 with established 4T1/E2 tumors were treated as described in Figure 5(a). Tumors were isolated on day 34, and the immune cells were analyzed by flow cytometry. Shown are the numbers of tumor-infiltrating (d) CD45+CD3+CD8+ T cells and (e) CD45+CD11b+Gr1+ cells in the different treatment groups. The frequencies of CD44+CD127+ (f), LAG3+CD160+ (g), and PD1+ (h) cells among CD8+T-cell subsets, as well as PD1+ (i) cells among CD4+T-cell subsets, are shown.Data are representative of three experiments. Error bars represent standard error of the mean. *p < .05
Figure 6.
Figure 6.
scFv-D4 and anti-PD1 combination therapy enhances T cell responses in a 4T1/E2 tumor model. BALB/c mice (n = 5) with established 4T1/E2 tumors were treated as described in Figure 5(a). Tumors were isolated on day 34, and the immune cells were analyzed by flow cytometry. Tumor-infiltrating lymphocytes (TILs) from the tumors were stimulated with PMA and ionomycin in the presence of brefeldin A for 4 h. The percentages of IFN-γ-producing CD4+ (a), Foxp3+ CD4+ (b), gzmb-producing CD4+ (c), IFN-γ-producing CD8+ (d), gzmB-producing CD8+ (e), and TNF-α-producing CD8+ T cells (f) among TILs are shown.Data are representative of three experiments. Error bars represent standard error of the mean. *p < .05
Figure 7.
Figure 7.
Treatment with fusion protein scFv–D4 and anti-PD1 induces significant anti-tumor effects in a CT26/E2 tumor model. (a) Schematic representation of subcutaneous (s.c.) CT26/E2 colon cancer cell treatments applied to BALB/c mice.(b) BALB/c mice (n = 7) were challenged s.c. with 106 CT26/E2 tumor cells. The mice were treated, as described in Figure 5(a), when the tumor size (diameter) reached 3–5 mm. Tumor growth (b) was recorded(c–f) BALB/c mice (n = 5) with established CT26/E2 tumors were treated as described in Figure 6(a). Tumors were isolated on day 34, and the immune cells were analyzed by flow cytometry. (c–e) Tumor-infiltrating lymphocytes (TILs) from the tumors were stimulated with PMA and ionomycin in the presence of brefeldin A for 4 h. Intracellular production of IFN-γ by CD4+, CD8+, and gzmB+ CD8+ T cells is shown. The numbers of tumor-infiltrating myeloid-derived suppressor cells (MDSCs) are shown (f).Data are representative of three experiments. Error bars represent standard error of the mean. Data are representative of three experiments. *p < .05.

Similar articles

Cited by

References

    1. Bray F, Ferlay J, Soerjomataram I, Siegel RL, Torre LA, Jemal A.. Global cancer statistics 2018: GLOBOCAN estimates of incidence and mortality worldwide for 36 cancers in 185 countries. CA Cancer J Clin. 2018;68:394–15. doi:10.3322/caac.21492. - DOI - PubMed
    1. Force J, Leal J, McArthur HL. Checkpoint blockade strategies in the treatment of breast cancer: where we are and where we are heading. Curr Treat Options Oncol. 2019;20:35. doi:10.1007/s11864-019-0634-5. - DOI - PubMed
    1. Takegawa N, Yonesaka K. HER2 as an emerging oncotarget for colorectal cancer treatment after failure of anti-epidermal growth factor receptor therapy. Clin Colorectal Cancer. 2017;16:247–251. doi:10.1016/j.clcc.2017.03.001. - DOI - PubMed
    1. Rabinovich GA, Gabrilovich D, Sotomayor EM. Immunosuppressive strategies that are mediated by tumor cells. Annu Rev Immunol. 2007;25:267–296. doi:10.1146/annurev.immunol.25.022106.141609. - DOI - PMC - PubMed
    1. Jenne CN, Kubes P. Immune surveillance by the liver. Nat Immunol. 2013;14:996–1006. doi:10.1038/ni.2691. - DOI - PubMed

Publication types