. 2020 Jul;10(7):1228-1238.
doi: 10.1016/j.apsb.2020.04.009. Epub 2020 Apr 20.

Crystal structure of SARS-CoV-2 nucleocapsid protein RNA binding domain reveals potential unique drug targeting sites

Affiliations

Crystal structure of SARS-CoV-2 nucleocapsid protein RNA binding domain reveals potential unique drug targeting sites

Sisi Kang et al. Acta Pharm Sin B. 2020 Jul.

Abstract

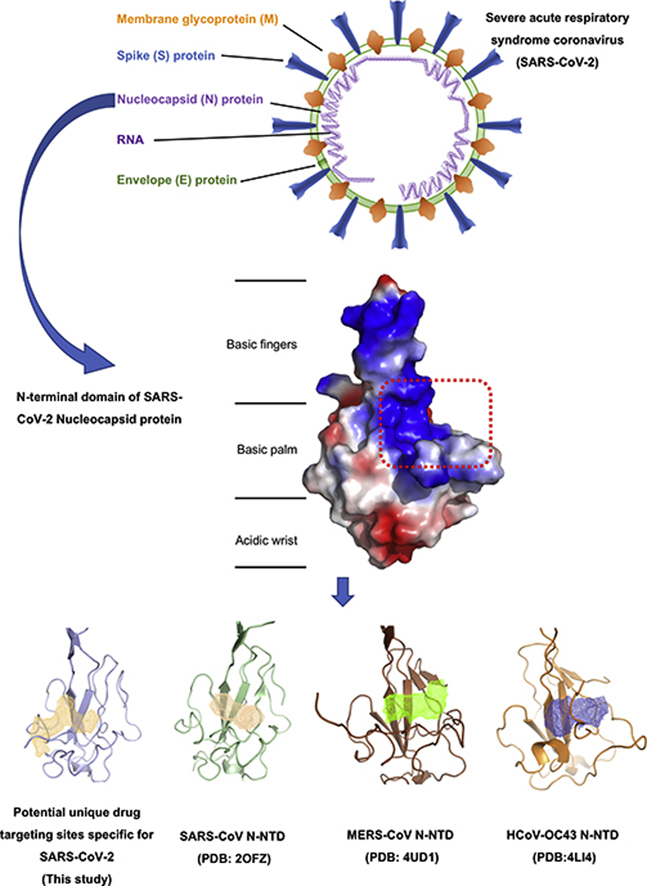
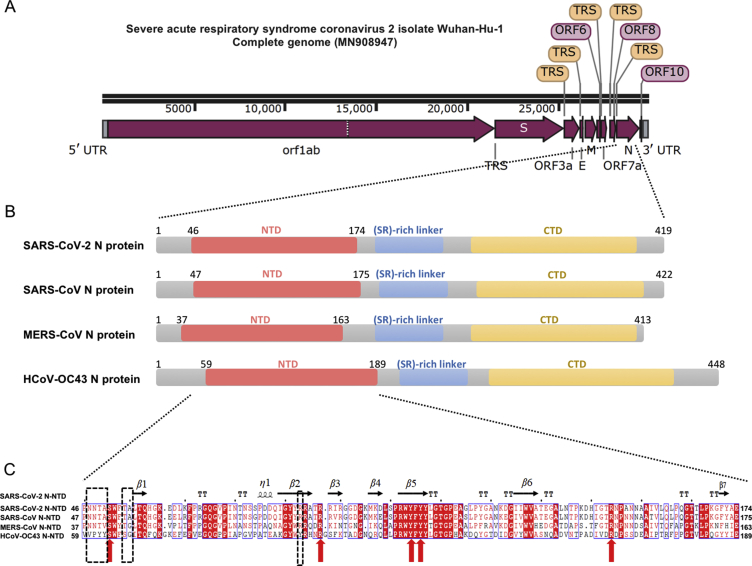
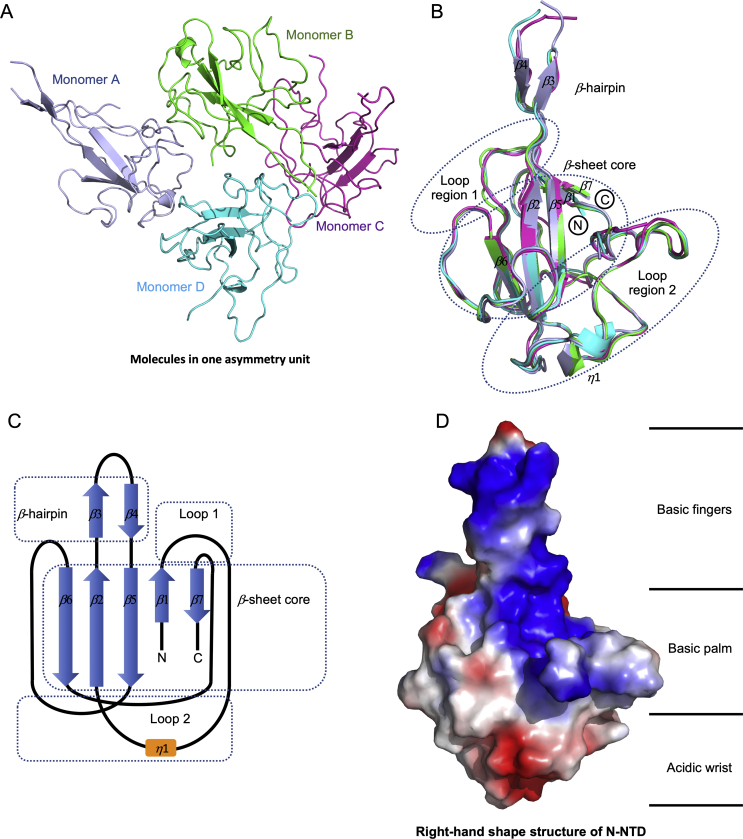
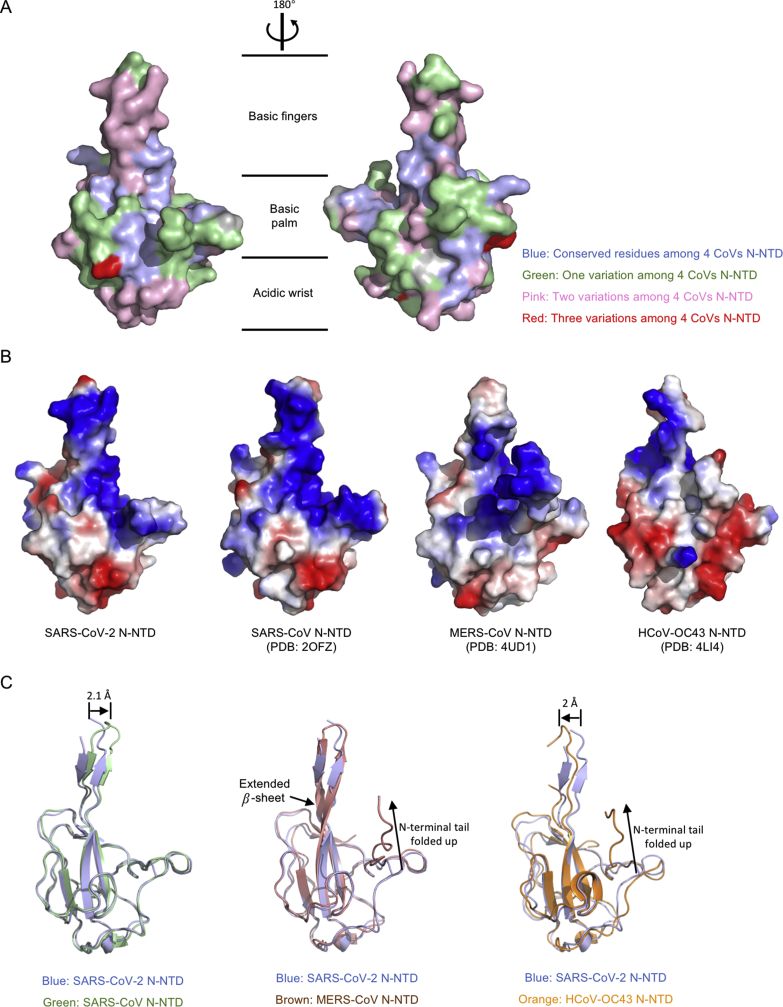
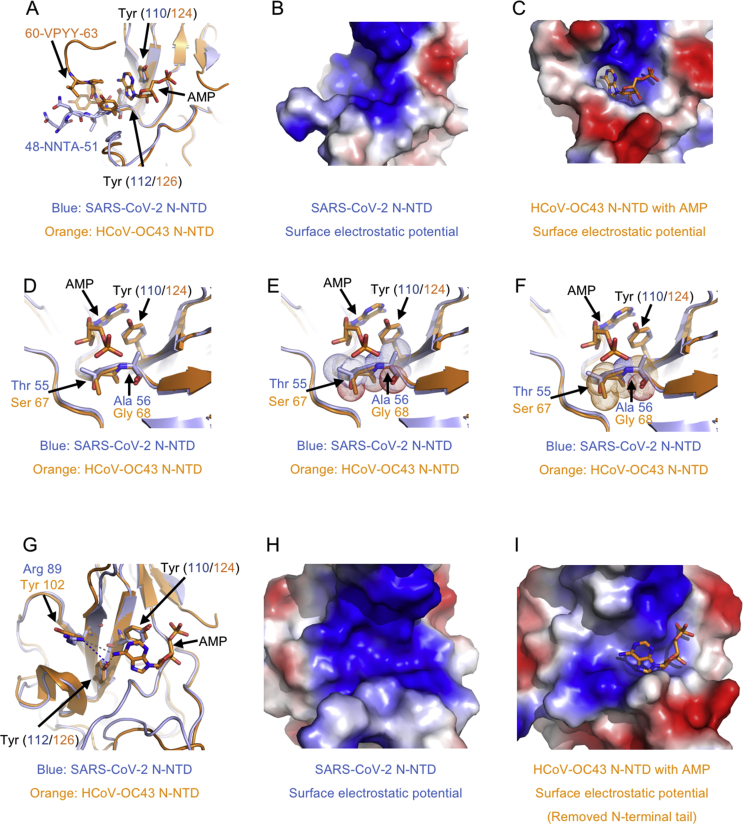
The outbreak of coronavirus disease (COVID-19) caused by SARS-CoV-2 virus continually lead to worldwide human infections and deaths. Currently, there is no specific viral protein-targeted therapeutics. Viral nucleocapsid protein is a potential antiviral drug target, serving multiple critical functions during the viral life cycle. However, the structural information of SARS-CoV-2 nucleocapsid protein remains unclear. Herein, we have determined the 2.7 Å crystal structure of the N-terminal RNA binding domain of SARS-CoV-2 nucleocapsid protein. Although the overall structure is similar as other reported coronavirus nucleocapsid protein N-terminal domain, the surface electrostatic potential characteristics between them are distinct. Further comparison with mild virus type HCoV-OC43 equivalent domain demonstrates a unique potential RNA binding pocket alongside the β-sheet core. Complemented by in vitro binding studies, our data provide several atomic resolution features of SARS-CoV-2 nucleocapsid protein N-terminal domain, guiding the design of novel antiviral agents specific targeting to SARS-CoV-2.

Keywords: Antiviral targeting site; COVID-19; Coronavirus; Crystal structure; Nucleocapsid protein; RNA binding domain; SARS-CoV-2.


Figures

Image 1
Graphical abstract
Figure 1
Figure 1
Sequence features of SARS-CoV-2 nucleocapsid protein. (A) The complete whole genomic features of SARS-CoV-2 isolate Wuhan-Hu-1 (Genebank: MN908947). UTR: untranslated region; orf/ORF: open reading frame; TRS: transcriptional regulatory sequences; S: spike glycoprotein encoding region; E: envelope protein encoding region; M: membrane protein encoding region; N: nucleocapsid protein encoding region. The figure is illustrated by SnapGene Viewer. (B) Domain architectures of coronavirus nucleocapsid protein. NTD: N-terminal RNA-binding domain; CTD: C-terminal dimerization domain. (C) Multiple sequence alignment of SARS-CoV-2 N-NTD with SARS-CoV N-NTD (UniProtKB: P59595), MERS-CoV N-NTD (UniProtKB: R9UM87), HCoV-OC43 N-NTD (UniProtKB: P33469). Red arrows indicate conserved residues for ribonucleotide binding sites, and dash boxes indicate residues variably in the structural comparisons.
Figure 2
Figure 2
Structural overview of SARS-CoV-2 N-NTD. (A) Ribbon representation of SARS-CoV-2 N-NTD molecules in one asymmetric unit. The four molecules are highlighted with different colors, respectively. (B) Superimpositions of four molecules in one asymmetric unit. The dash circles indicate the sandwiched structure composed of Loop region 1, β-sheet core, and Loop region 2. The β-strand is labeled with β1 to β7, and the 310 helix is labeled with η1. (C) Topological style illustration of SARS-CoV-2 N-NTD structure. (D) Electrostatic surface of the SARS-CoV-2 N-NTD. Blue denotes positive charge potential, while red indicates negative charge potential. The potential distribution was calculated by Pymol. The values range from –6kT (red) to 0 (white) and to +6kT (blue), where k is the Boltzmann constant, and T is the temperature.
Figure 3
Figure 3
Comparison of SARS-CoV-2 N-NTD with related viral N-NTD structures. (A) Mapping the conserved surfaces of four CoV N-NTDs in SARS-CoV-2 N-NTD structure. The multiple sequence alignment used for mapping is shown in Fig. 1C. Blue denotes conserved residues among 4 CoVs N-NTD; green denotes one variation among 4 CoVs N-NTD; pink denotes two variations among 4 CoVs N-NTD; red denotes three variations among 4 CoVs N-NTD. (B) Electrostatic surface of the SARS-CoV-2 N-NTD, SARS-CoV N-NTD, MERS-CoV N-NTD, HCoV-OC43 N-NTD. Blue denotes positive charge potential, while red indicates negative charge potential. (C) Overall structural comparison of SARS-CoV-2 N-NTD with related viral N-NTD structures. Left: superimposition of SARS-CoV-2 N-NTD (blue) to SARS-CoV N-NTD (green); middle: superimposition of SARS-CoV-2 N-NTD (blue) to MERS-CoV N-NTD (brown); right: superimposition of SARS-CoV-2 N-NTD (blue) to HCoV-OC43 N-NTD (orange).
Figure 4
Figure 4
A potential unique drug target pocket in SARS-CoV-2 N-NTD. (A) Detailed view of ribonucleotide binding pocket in superimposition structures between SARS-CoV-2 N-NTD with HCoV-OC43 N-NTD AMP complex. AMP, interacting residues and equivalents are highlighted with stick representation. (B) Electrostatic surface of the potential ribonucleotide binding pocket on SARS-CoV-2 N-NTD. (C) Electrostatic surface of the ribonucleotide binding pocket on HCoV-OC43 N-NTD. (D) Detailed view of phosphate group binding site in superimposition structures between SARS-CoV-2 N-NTD with HCoV-OC43 N-NTD AMP complex. (E) Dot representation of SARS-CoV-2 residues Thr55 and Ala56, which indicates potential steric clashes with the ribonucleotide phosphate group. (F) Dot representation of HCoV-OC43 N-NTD residues Ser67 and Gly68. (G) Detailed view of the nitrogenous base binding site in superimposition structures between SARS-CoV-2 N-NTD with HCoV-OC43 N-NTD AMP complex. (H) Electrostatic surface of the potential ribonucleotide nitrogenous base binding pocket on SARS-CoV-2 N-NTD. (I) Electrostatic surface of the ribonucleotide nitrogenous base binding pocket on HCoV-OC43 N-NTD. In electrostatic surface potential panels, blue denotes positive charge potential, while red indicates negative charge potential. The potential distribution was calculated by Pymol. The values range from –6kT (red) to 0 (white) and to +6kT (blue), where k is the Boltzmann constant, and T is the temperature.

References

    1. World Health Organization . 12 March 2020. COVID-2019 situation reports.https://www.who.int/emergencies/diseases/novel-coronavirus-2019/situatio... Available from:
    1. Brian D.A., Baric R.S. Coronavirus genome structure and replication. Curr Top Microbiol Immunol. 2005;287:1–30. - PMC - PubMed
    1. Cui J., Li F., Shi Z.L. Origin and evolution of pathogenic coronaviruses. Nat Rev Microbiol. 2019;17:181–192. - PMC - PubMed
    1. Guo Y., Cao Q., Hong Z., Tan Y., Chen S., Jin H. The origin, transmission and clinical therapies on coronavirus disease 2019 (COVID-19) outbreak—an update on the status. Mil Med Res. 2020;7:11. - PMC - PubMed
    1. Ramajayam R., Tan K.P., Liang P.H. Recent development of 3C and 3CL protease inhibitors for anti-coronavirus and anti-picornavirus drug discovery. Biochem Soc Trans. 2011;39:1371–1375. - PubMed

LinkOut - more resources