. 2020 Mar 16;4(5):657-669.
doi: 10.1002/hep4.1504. eCollection 2020 May.

Molecular Mechanism for Protection Against Liver Failure in Human Yellow Fever Infection

Affiliations

Molecular Mechanism for Protection Against Liver Failure in Human Yellow Fever Infection

Fernanda de Oliveira Lemos et al. Hepatol Commun. .

Abstract

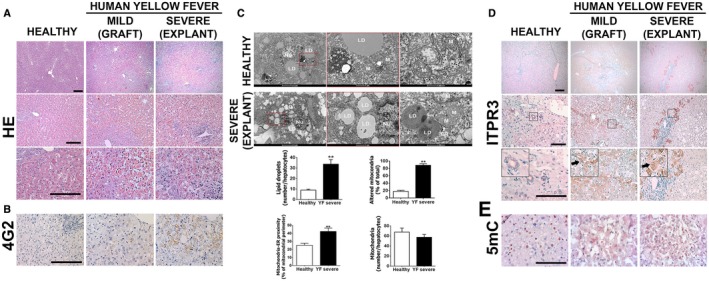
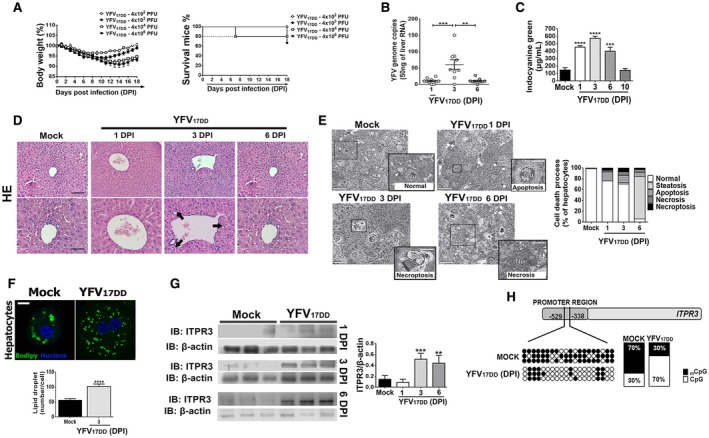
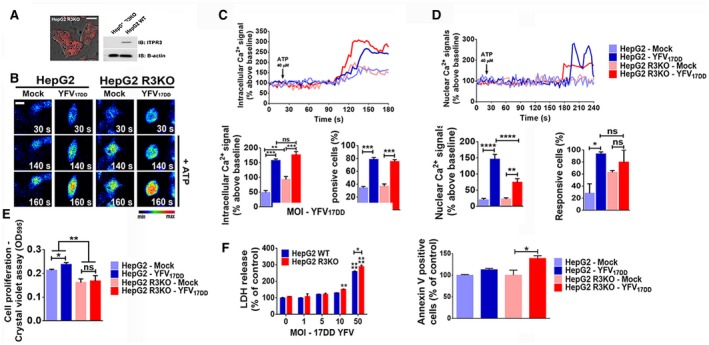
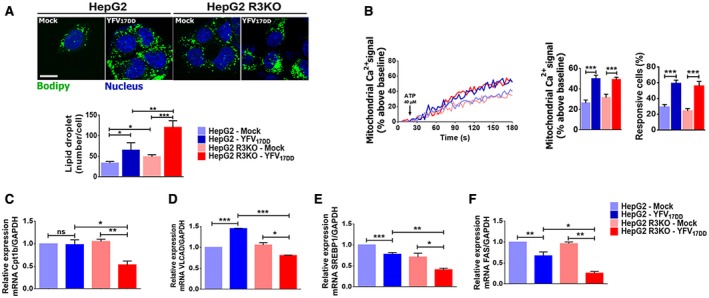
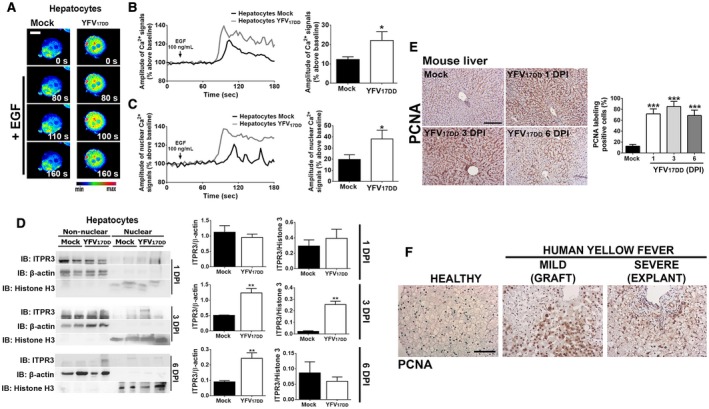
Yellow fever (YF) is a viral hemorrhagic fever that typically involves the liver. Brazil recently experienced its largest recorded YF outbreak, and the disease was fatal in more than a third of affected individuals, mostly because of acute liver failure. Affected individuals are generally treated only supportively, but during the recent Brazilian outbreak, selected patients were treated with liver transplant. We took advantage of this clinical experience to better characterize the clinical and pathological features of YF-induced liver failure and to examine the mechanism of hepatocellular injury in YF, to identify targets that would be amenable to therapeutic intervention in preventing progression to liver failure and death. Patients with YF liver failure rapidly developed massive transaminase elevations, with jaundice, coagulopathy, thrombocytopenia, and usually hepatic encephalopathy, along with pathological findings that included microvesicular steatosis and lytic necrosis. Hepatocytes began to express the type 3 isoform of the inositol trisphosphate receptor (ITPR3), an intracellular calcium (Ca2+) channel that is not normally expressed in hepatocytes. Experiments in an animal model, isolated hepatocytes, and liver-derived cell lines showed that this new expression of ITPR3 was associated with increased nuclear Ca2+ signaling and hepatocyte proliferation, and reduced steatosis and cell death induced by the YF virus. Conclusion: Yellow fever often induces liver failure characterized by massive hepatocellular damage plus steatosis. New expression of ITPR3 also occurs in YF-infected hepatocytes, which may represent an endogenous protective mechanism that could suggest approaches to treat affected individuals before they progress to liver failure, thereby decreasing the mortality of this disease in a way that does not rely on the costly and limited resource of liver transplantation.


Figures

Fig. 1
Fig. 1
Patients with acute liver failure from YF have steatosis, pan‐lobular cell death, and new expression of ITPR3. (A) H&E‐stained liver sections from healthy patient (left panel), YFV‐infected patient showing mild liver disease (middle panel, biopsy from a liver graft), and a liver explant specimen from a patient with severe hepatic disease due to YFV infection (right panel). Patients were infected in 2018 during the YFV outbreak in Minas Gerais, Brazil. (B) Immunohistochemistry (IHC) staining for flavivirus envelope protein 4G2. (C) TEM images of liver samples from healthy patients (top panels) or YFV‐infected patient displaying severe hepatic disease (bottom panels), showing mitochondria with disorganized or absent crests, phagosomes, and lipid droplets. Graphs show quantification of number of lipid droplets, percentage of altered mitochondria, mitochondria‐endoplasmic reticulum proximity, and mitochondrial number. Bars indicate the average values of samples from at least eight hepatocytes/group. (D) IHC liver slices stained for ITPR3. Arrows indicate ITPR3 localization in the cytoplasm and nucleus in hepatocytes of mild and severe cases of YF. (E) IHC stained for 5mC (scale bar: 50 μm, 100 μm, and 200 μm for H&E and IHC, and 1 μm and 5 μm for TEM). Significance was analyzed using Student t test (**P < 0.01). Abbreviations: LD, lipid droplet; Nu, nucleus; M, mitochondrion; Ph, phagosome.
Fig. 2
Fig. 2
Mouse model replicates histological findings in patients with liver failure from YF infection. IFN‐α/βR−/− SV129 mice (7–9 weeks old) were inoculated intravenously with YFV strain (YFVV17DD) vaccine. (A) Changes in body weight (left panel) and Kaplan‐Meier survival curve (right panel) after inoculums of 4 × 102 to 4 × 106 PFU. (B) Quantitative RT‐PCR analysis of YFV viral load in the mice livers on 1 dpi, 3 dpi, and 6 dpi after inoculation of 4 × 104 PFU. Results are expressed as mean ± SEM (**P < 0.01 and ***P < 0.001 using ANOVA, Bonferroni’s posttest). (C) Liver function measured by the ICG clearance after inoculation of 4 × 104 PFU. Bars indicate mean ± SEM of samples from 3‐6 animals/group (***P < 0.001 and ****P < 0.0001 using ANOVA, Bonferroni’s posttest compared with mock samples). (D) Representative H&E‐stained liver slices of mock and YFV17DD inoculated animals on 1 dpi, 3 dpi, and 6 dpi. Scale bar: 50 μm and 100 μm. Arrows indicate hydropic degeneration characterized by the presence of swollen hepatocytes with clear and vacuolated cytoplasm and central nucleus. (E) Images of high‐resolution light microscopy of 300‐μm‐thick liver sections stained with toluidine blue, and representative images of mock and YFV17DD inoculated mice on 1 dpi (B), 3 dpi (C), and 6 dpi (D) showing hepatocytes with normal aspect (white *) and ongoing different cell death processes (black *). Normal hepatocytes from mock animal with central nucleus, rough cytoplasm with many organelles, and few lipid droplets (arrowheads). Early apoptosis with initial cell and organelle condensation in hepatocyte from 1 dpi of YFV17DD. Necroptosis characterized by pale and swollen nucleus and cytoplasm with plasma membrane integrity in hepatocyte from 3 dpi of YFV17DD. Necrosis, illustrated by empty spaces of cytoplasm in hepatocyte from 6 dpi of YFV17DD (left panel). Arrows indicate sinusoid capillaries; arrowheads indicate lipid droplets (scale bar: 25 μm and 50 μm). Frequency of cell death processes and steatosis analyzed in high‐resolution images of 300‐nm‐thick sections (right panel). (F) Representative immunofluorescence images of isolated hepatocytes stained with Bodipy (green) and 4′,6‐diamidino‐2‐phenylindol (blue) from mock and YFV17DD 3‐dpi inoculated animals (upper panel) (scale bar: 20 μm). Bottom panel shows the quantification of lipid droplets (number/cell). Bars indicate mean ± SEM of samples from three animals/group (****P < 0.0001 using Student t test). (G) ITPR3 expression is increased in liver 3 and 6 days after infection of mice with YFV17DD. Left panel shows representative blots for ITPR3 expression in liver lysates from mock, and YFV17DD 1‐dpi, 3‐dpi, and 6‐dpi inoculated animals. Each lane reflects the blot for the lysate from a separate animal. Right panel shows quantification of ITPR3 expression, normalized by b‐actin. Bars indicate mean ± SEM of samples from 3‐6 animals/group (**P < 0.01 and ***P < 0.001 using ANOVA, Bonferroni’s posttest compared with mock samples). (H) Demethylation sites on cytosine‐guanine dinucleotide (CpG) islands in mouse ITPR3 promoter region after 3 dpi with YFV17DD virus. Black dots represent methylated sites, and white dots represent demethylated sites. Quantification of methylated/demethylated CpG island ratio in mock and YFV‐infected liver samples. Abbreviations: IB, immunoblot; Nu, nucleus.
Fig. 3
Fig. 3
ITPR3 expression is protective in a YF‐infected, liver‐derived cell line. (A) Representative confocal images of HepG2 ITPR3 KO (HepG2 R3KO) cells and western blot for ITPR3 expression in HepG2 and HepG2 R3KO cells. (B) Confocal images of HepG2 and HepG2 R3KO cells loaded with Fluo‐4/AM (6 μM) and stimulated with 40 μM ATP. The cells were infected with 50 MOI of YFV17DD strain 24 hours before the Ca2+ analysis (scale bar: 20 μm). (C) Representative time‐course of total Ca2+ signal (upper panel), quantification of the peak fluorescence following stimulation with ATP (bottom‐left panel), and percentage of responsive cells to increase of cytoplasmic Ca2+ signal (bottom‐right panel). (D) Representative time‐course of nuclear Ca2+ signal in the cells loaded with Fluo‐4/AM (6 μM) (upper graph). Bottom‐left panel graph shows quantification of the peak fluorescence, and bottom‐right graph shows percentage of responsive cells to increase of nuclear Ca2+ signal following stimulation with ATP. (E) Crystal violet proliferation assay 1 dpi with 50 MOI of YFV17DD. (F) YFV17DD cytotoxicity. Cell viability was measured by lactate‐dehydrogenase release by the cells 1 dpi with different YFV17DD inoculums (left panel). Proportion of apoptotic cells at day 1 of YFV17DD 50 MOI infection, measured by flow cytometer analysis for annexin V–positive cells (right panel). Bars indicate the average values of samples from 3‐6 biological replicates (>20 cells/replicate for Ca2+ signaling analysis). Significance was analyzed by the ANOVA, Bonferroni’s posttest (*P < 0.05, **P < 0.01, ***P < 0.001, and ****P < 0.0001) compared with mock samples. Abbreviations: IB, immunoblot; LDH, lactate dehydrogenase; ns, no statistical difference.
Fig. 4
Fig. 4
ITPR3 expression decreases steatosis in a YF‐infected, liver‐derived cell line. (A) Immunofluorescence images of HepG2 and HepG2 R3KO cells stained with Bodipy (green) and 4′,6‐diamidino‐2‐phenylindole (blue), both in mock and 1‐dpi YFV17DD cells (upper panel), and quantification of lipid droplets (number/cell) (scale bar: 20 μm) (bottom panel). (B) Representative time‐course of mitochondrial Ca2+ signal (left graph). Cells were transfected with the mitochondrial matrix–targeted Ca2+ indicator inverse‐pericam and stimulated with 40 μM ATP. Graphs show quantification of the peak of fluorescence following stimulation with ATP (middle graph) and percentage of responsive cells to increase of mitochondrial Ca2+ signals (right graph). Quantitative RT‐PCR analysis for mRNA expression of β‐oxidation, Cpt1b (C), VLCAD (D), lipogenesis, and SREBP1 (E) and FAS (F) genes. Bars indicate the average values of samples from three to six biological replicates (>20 cells/replicate for Ca2+ signaling analysis). Significance was analyzed by the ANOVA, Bonferroni’s posttest (*P < 0.05, **P < 0.01, ***P < 0.001, and ****P < 0.0001) compared with mock samples. Abbreviations: GAPDH, glyceraldehyde 3‐phosphate dehydrogenase; ns, no statistical difference.
Fig. 5
Fig. 5
YF infection increases Ca2+ signals in the nucleus and enhances proliferation of hepatocytes. (A) Confocal images of hepatocytes isolated from liver tissue of 3‐dpi YFV17DD‐infected mice. Cells were loaded with Fluo‐4/AM (6 μM) and stimulated with 100 ng/mL EGF (scale bar: 20 μm). (B) Representative time‐course of total Ca2+ signal (left panel) and quantification of the peak fluorescence following stimulation with EGF (right panel). (C) Representative time‐course of nuclear Ca2+ signal (left panel) and quantification of the peak fluorescence of nuclear Ca2+ signal following stimulation with EGF (right panel). (D) Nonnuclear and nuclear protein fractions of liver lysates from mock, 1‐dpi, 3‐dpi, and 6‐dpi YFV17DD‐infected animals were tested for ITPR3 expression by western blot. Left panel shows representative blots; middle and right graphs show quantification of ITPR3 in nonnuclear and nuclear protein fractions. (E) IHC images of liver slices stained for PCNA in mock and YFV17DD‐infected animals on 1 dpi, 3 dpi, and 6 dpi (left panel). Scale bar: 100 μm. Quantification of PCNA‐positive cells is shown in the right graph. (F) PCNA staining of liver slices from a healthy patient (left panel), YFV‐infected hepatic human tissue from a graft biopsy with mild liver disease (middle panel), and an explant sample from a patient with severe hepatic disease (right panel). Scale bar: 50 μm. Bars indicate the average values of samples from three to six biological replicates (>20 cells/replicate for Ca2+ signaling analysis). Significance was analyzed by Student t test or the ANOVA, Bonferroni’s posttest (*P < 0.05, **P < 0.01, and ***P < 0.001) compared with mock samples. Abbreviation: IB, immunoblot.

References

    1. Barrett AD, Monath TP. Epidemiology and ecology of yellow fever virus. Adv Virus Res 2003;61:291‐315. - PubMed
    1. Monath TP. Yellow fever: an update. Lancet Infect Dis 2001;1:11‐20. - PubMed
    1. Klitting R, Gould EA. Paupy C, de Lamballerie X. What does the future hold for yellow fever virus? Genes (Basel) 2018;9. pii: E291. - PMC - PubMed
    1. Faria NR, Kraemer MUG, Hill SC, Goes de Jesus J, Aguiar RS, Iani FCM, et al. Genomic and epidemiological monitoring of yellow fever virus transmission potential. Science 2018;361:894‐899. - PMC - PubMed
    1. Kallas EG, D'Elia Zanella L, Moreira CHV, Buccheri R, Diniz GBF, Castineiras ACP, et al. Predictors of mortality in patients with yellow fever: an observational cohort study. Lancet Infect Dis 2019;19:750‐758. - PubMed