. 2020 May 4:9:e51322.
doi: 10.7554/eLife.51322.

Wireless recording from unrestrained monkeys reveals motor goal encoding beyond immediate reach in frontoparietal cortex

Affiliations

Wireless recording from unrestrained monkeys reveals motor goal encoding beyond immediate reach in frontoparietal cortex

Michael Berger et al. Elife. .

Erratum in

Abstract

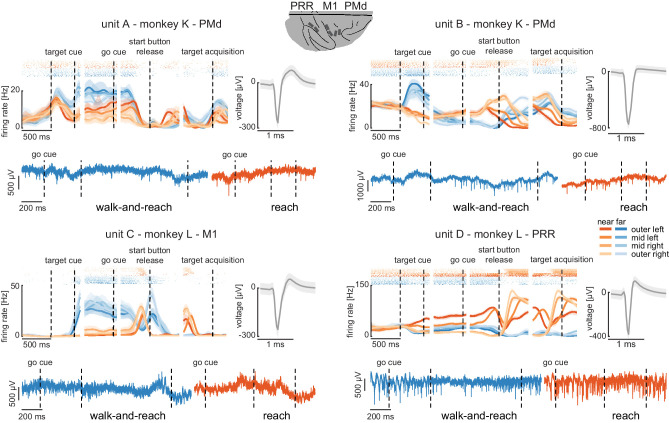
System neuroscience of motor cognition regarding the space beyond immediate reach mandates free, yet experimentally controlled movements. We present an experimental environment (Reach Cage) and a versatile visuo-haptic interaction system (MaCaQuE) for investigating goal-directed whole-body movements of unrestrained monkeys. Two rhesus monkeys conducted instructed walk-and-reach movements towards targets flexibly positioned in the cage. We tracked 3D multi-joint arm and head movements using markerless motion capture. Movements show small trial-to-trial variability despite being unrestrained. We wirelessly recorded 192 broad-band neural signals from three cortical sensorimotor areas simultaneously. Single unit activity is selective for different reach and walk-and-reach movements. Walk-and-reach targets could be decoded from premotor and parietal but not motor cortical activity during movement planning. The Reach Cage allows systems-level sensorimotor neuroscience studies with full-body movements in a configurable 3D spatial setting with unrestrained monkeys. We conclude that the primate frontoparietal network encodes reach goals beyond immediate reach during movement planning.

Keywords: arm movements; motion capture; motor cortex; neuroscience; parietal cortex; premotor cortex; rhesus macaque; wireless neurophysiology.


Conflict of interest statement

MB, NA, AG No competing interests declared

Figures

Figure 1.
Figure 1.. The Reach Cage setup.
(A) Monkey K performing a reach task on the Macaque Cage Query Extension (MaCaQuE), touching one of the illuminated MaCaQuE Cue and Target boxes (MCTs) inside the Reach Cage. (B) An MCT contains a proximity sensor to make the translucent front cover touch-sensitive and four RGB LEDs to color-illuminate it. (C) Schematic drawing of MaCaQuE showing the electronic components with the microcontroller interfacing between MCTs and an external computer for experimental control. (D) Sketch of the Reach Cage with 10 MCTs inside, two on the floor pointing upwards serving as a starting position for the monkey and two rows of four (near and far) pointing towards the starting position. The far MCTs were positioned to the back of the cage such that the animals needed to walk first. An 11thMCT is positioned outside the cage for providing additional visual cues. The universal MCTs can be arranged flexibly to serve different purposes.
Figure 2.
Figure 2.. Walk-and-reach task.
(A) Timeline of the walk-and-reach task. Yellow MCTs indicate illumination. Only near targets are shown to illustrate this example trial. The second left-most near target was indicated as target and had to be reached after an instructed memory period in response to the go cue (isoluminant color change on the MCT outside the cage). (B) An example trial to a far target for monkey K (left) and monkey L (right). The frames of the video correspond to the time periods of the trial illustrated in (A). (C) Times between go cue and start button release (button release time), and between start button release and target acquisition (movement time) were distributed narrowly in most cases for reaching movements to near (red) and far (blue) targets demonstrating the temporally well-structured behavior. Dashed vertical lines indicate averages and corresponding numbers indicate averages and standard deviations (s.d.) in ms.
Figure 3.
Figure 3.. Structured behavior during task performance in unrestrained animals.
(A) Motion tracking of the left wrist, elbow, shoulder, and the headcap implant during reach and walk-and-reach movements for monkey K (left) and monkey L (right). Video-based markers are tracked in three dimensions and projected to a side-view. Trial-by-trial marker positions for the reach (red) and walk-and-reach (blue) movements to the mid-left targets are shown for a sampling frequency of 60 Hz, overlaid for multiple sessions (light-dark colors). (B) Small trial-to-trial variability of movement trajectories, even across sessions, demonstrates spatially well-structured and consistent behavior. For each trial and marker, the average Euclidean distance to the trial-averaged trajectory at corresponding times is shown (see Materials and methods). For reference, neighboring near targets were mounted at approximately 130 mm distance (dashed line) in this experiment. The MCT diameter is 75 mm. (C) Reconstructed 3-dimensional arm posture as function of time during reach and walk-and-reach movements based on the video motion capture separately for each monkey and session. The lines connect the marker (wrist to elbow to shoulder to headcap) for each marker position averaged across trials. Gray rectangles show target and start button MCTs. Pictures below show snapshots of characteristic postures during an example reach and walk-and-reach trial.
Figure 4.
Figure 4.. Wireless recording in the Reach Cage.
Four example units from the frontoparietal reach network of monkeys K and L recorded wirelessly while the monkeys performed the memory-guided walk-and-reach task. The figure shows for each unit averaged spike densities with corresponding raster plots (top left), the waveform (top right), and the unfiltered broadband signal during reach and walk-and-reach example movements. Vertical dashed lines indicate task events in order of appearance: target cue (on and off), go cue, start button release, and target acquisition. Error bars indicate bootstrapped 95% confidence interval for the spike densities and s.d. for the waveform. Color indicates near (red) and far (blue) targets, lightness level indicates right (light) to left (dark) target positions.
Figure 4—figure supplement 1.
Figure 4—figure supplement 1.. Data loss rate per target.
The figure shows the data loss rate of all trials per target position and distance (color coded). The left plot indicates all successful trials of all 12 sessions (two monkey K and 10 monkey L). Bars indicate the mean and error bars the bootstrapped confidence interval. Data loss rate is slightly modulated by target position and distance x position (left panel and Figure 4—source data 1). This bias is introduced by a small fraction of trials with high data loss. We removed all trials with data loss of 5% or higher (right plot) for the data analyses presented in the main manuscript. When we did this, no bias by target position was observed within near or within far trials (right panel; Figure 4—source data 2).
Figure 5.
Figure 5.. Direction decoding in the walk-and-reach task.
(A) Wrist (top) and head (bottom) position during reach (orange) and walk-and-reach (blue) movements towards the eight targets projected to the top-view. Each point corresponds to one location in one trial sampled at 60 Hz. (B) Decoding accuracy of 20-fold cross validation of a linear SVM decoder in 300 ms bins at 100 ms time steps (line plots). We decoded if a trial was towards one of the two left or one of the two right targets. Premotor and parietal cortex but not motor cortex showed significant decoding walk-and-reach targets even during the memory period. Statistical testing was done on one bin in the memory period 100–400 ms after the cue and movement period 300–0 ms before target acquisition (black dashed line). The colored dashed curve indicates the significance threshold based on a one-tailed permutation test. The population average of the firing rate modulation between preferred and anti-preferred direction (left vs. right) during the memory and movement bin is shown in the bar plots. The black lines indicate the significance threshold based on a one-tailed permutation test. In both plots, an asterisk corresponds to a significant increase with Bonferroni correction.
Figure 5—figure supplement 1.
Figure 5—figure supplement 1.. Decoding walk-and-reach goals with different walking paths.
To test if target direction decoding accuracy (Figure 5) of walk-and-reach trials depends on the walking path, we recorded one session for each monkey. The sessions contained reach and walk-and-reach trials; however, we only perform the decoding analysis on walk-and-reach trials here. The sessions contained two blocks: one as presented in the results part of the manuscript (red color, ‘open’) and another with a narrow passage introduced in the middle of the walking path in a 40 cm distance to the wrist starting position (blue color, ‘passage’). See Materials and methods for more details. (A) Top view of wrist (top) and head (bottom) trajectories for the eight reach and walk-and-reach targets during trials with and without the passage. The horizontal axis is the same for wrist and head. Histogram plots show the marker position distribution on the vertical axis at the point of the dashed line. The distribution with the passage is different from the one without (Kolmogorow-Smirnow test p<0.001 for wrist and head of both animals) with a smaller range (open/passage for monkey K: wrist 276 mm / 74 mm; head: 250 mm/ 106 mm and monkey L: wrist 218 mm / 61 mm; head: 311 mm / 117 mm) and s.d. (open/passage for monkey K: wrist 88 mm / 17 mm; head: 82 mm/ 32 mm and monkey L: wrist 64 mm / 15 mm ; head: 83 mm / 26 mm). (B) Line plots show SVM decoding accuracy of left vs. right walk-and-reach target direction with 10-fold cross validation on 300 ms overlapping bins. There was no significant difference between trials with and without the narrow passage in the memory (100–400 ms after target cue, dashed line) or movement period (300–0 ms before target acquisition, dashed line) of any monkey in any brain area. The confidence intervals for decoding accuracy difference (gray area) are plotted around the curve without passage. The bar plots show the population average of the difference in firing rate modulation for trials with and without the passage during the memory and movement period. The error bars indicate confidence intervals. Again, there was no significant difference between trials with and without the narrow passage. In both cases statistical tests were two-tailed permutation tests with Bonferroni correction (see Figure 5—source data 3 and 4).
Figure 6.
Figure 6.. Implant system design.
(A) Three-dimensional computer models of the implants and electronics. The skull model of monkey L (beige) is extracted from a CT scan including the titanium implant for head fixation (4, headpost), which was already implanted before this study. Further implants are colored for illustrative purposes and do not necessarily represent the actual colors. (B) Image of microelectrode array placement during the surgery of monkey L (top) and monkey K (bottom). Anatomical landmark descriptions: IPS – intraparietal sulcus; CS – central sulcus; PCD – postcentral dimple; AS – arcuate suclus. (C) Image of the implants on monkey L’s head. (D) Different configurations of wireless headstages and protective headcaps temporally mounted on the implants. Numbers indicate: 1 – chamber; 2 – adapter board holder; 3 – array connector holder; 4 – headpost (from CT scan); 5 – flat headcap; 6 – W32 headstage; 7 – W128 headstage; 8 - Exilis headstage (two used in parallel); 9 – headcap for W128 headstage; 10 - headcap for W32 or Exilis headstages.

References

    1. Aflalo T, Kellis S, Klaes C, Lee B, Shi Y, Pejsa K, Shanfield K, Hayes-Jackson S, Aisen M, Heck C, Liu C, Andersen RA. Neurophysiology decoding motor imagery from the posterior parietal cortex of a tetraplegic human. Science. 2015;348:906–910. doi: 10.1126/science.aaa5417. - DOI - PMC - PubMed
    1. Bala PC, Eisenreich BR, Bum S, Yoo M, Hayden BY, Park HS, Zimmermann J. OpenMonkeyStudio : automated markerless pose estimation in freely moving macaques. bioRxiv. 2020 doi: 10.1101/2020.01.31.928861. - DOI - PMC - PubMed
    1. Ballesta S, Reymond G, Pozzobon M, Duhamel JR. A real-time 3D video tracking system for monitoring primate groups. Journal of Neuroscience Methods. 2014;234:147–152. doi: 10.1016/j.jneumeth.2014.05.022. - DOI - PubMed
    1. Bansal AK, Truccolo W, Vargas-Irwin CE, Donoghue JP. Decoding 3D reach and grasp from hybrid signals in motor and premotor cortices: spikes, multiunit activity, and local field potentials. Journal of Neurophysiology. 2012;107:1337–1355. doi: 10.1152/jn.00781.2011. - DOI - PMC - PubMed
    1. Batista AP, Buneo CA, Snyder LH, Andersen RA. Reach plans in eye-centered coordinates. Science. 1999;285:257–260. doi: 10.1126/science.285.5425.257. - DOI - PubMed

Publication types