. 2020 May 12;4(9):1833-1843.
doi: 10.1182/bloodadvances.2019000133.

Induction of blood-circulating bile acids supports recovery from myelosuppressive chemotherapy

Affiliations

Induction of blood-circulating bile acids supports recovery from myelosuppressive chemotherapy

Valgardur Sigurdsson et al. Blood Adv. .

Abstract

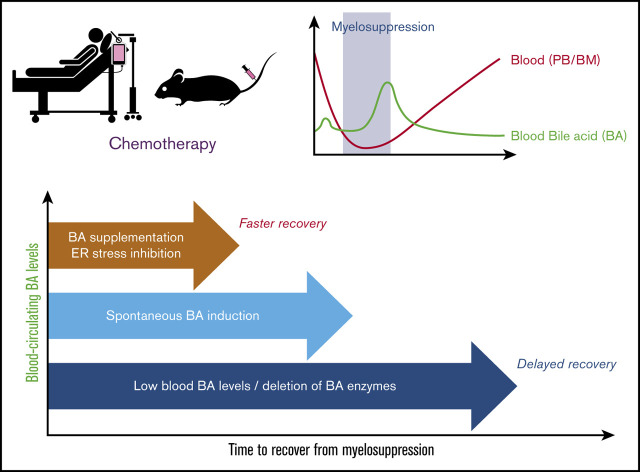
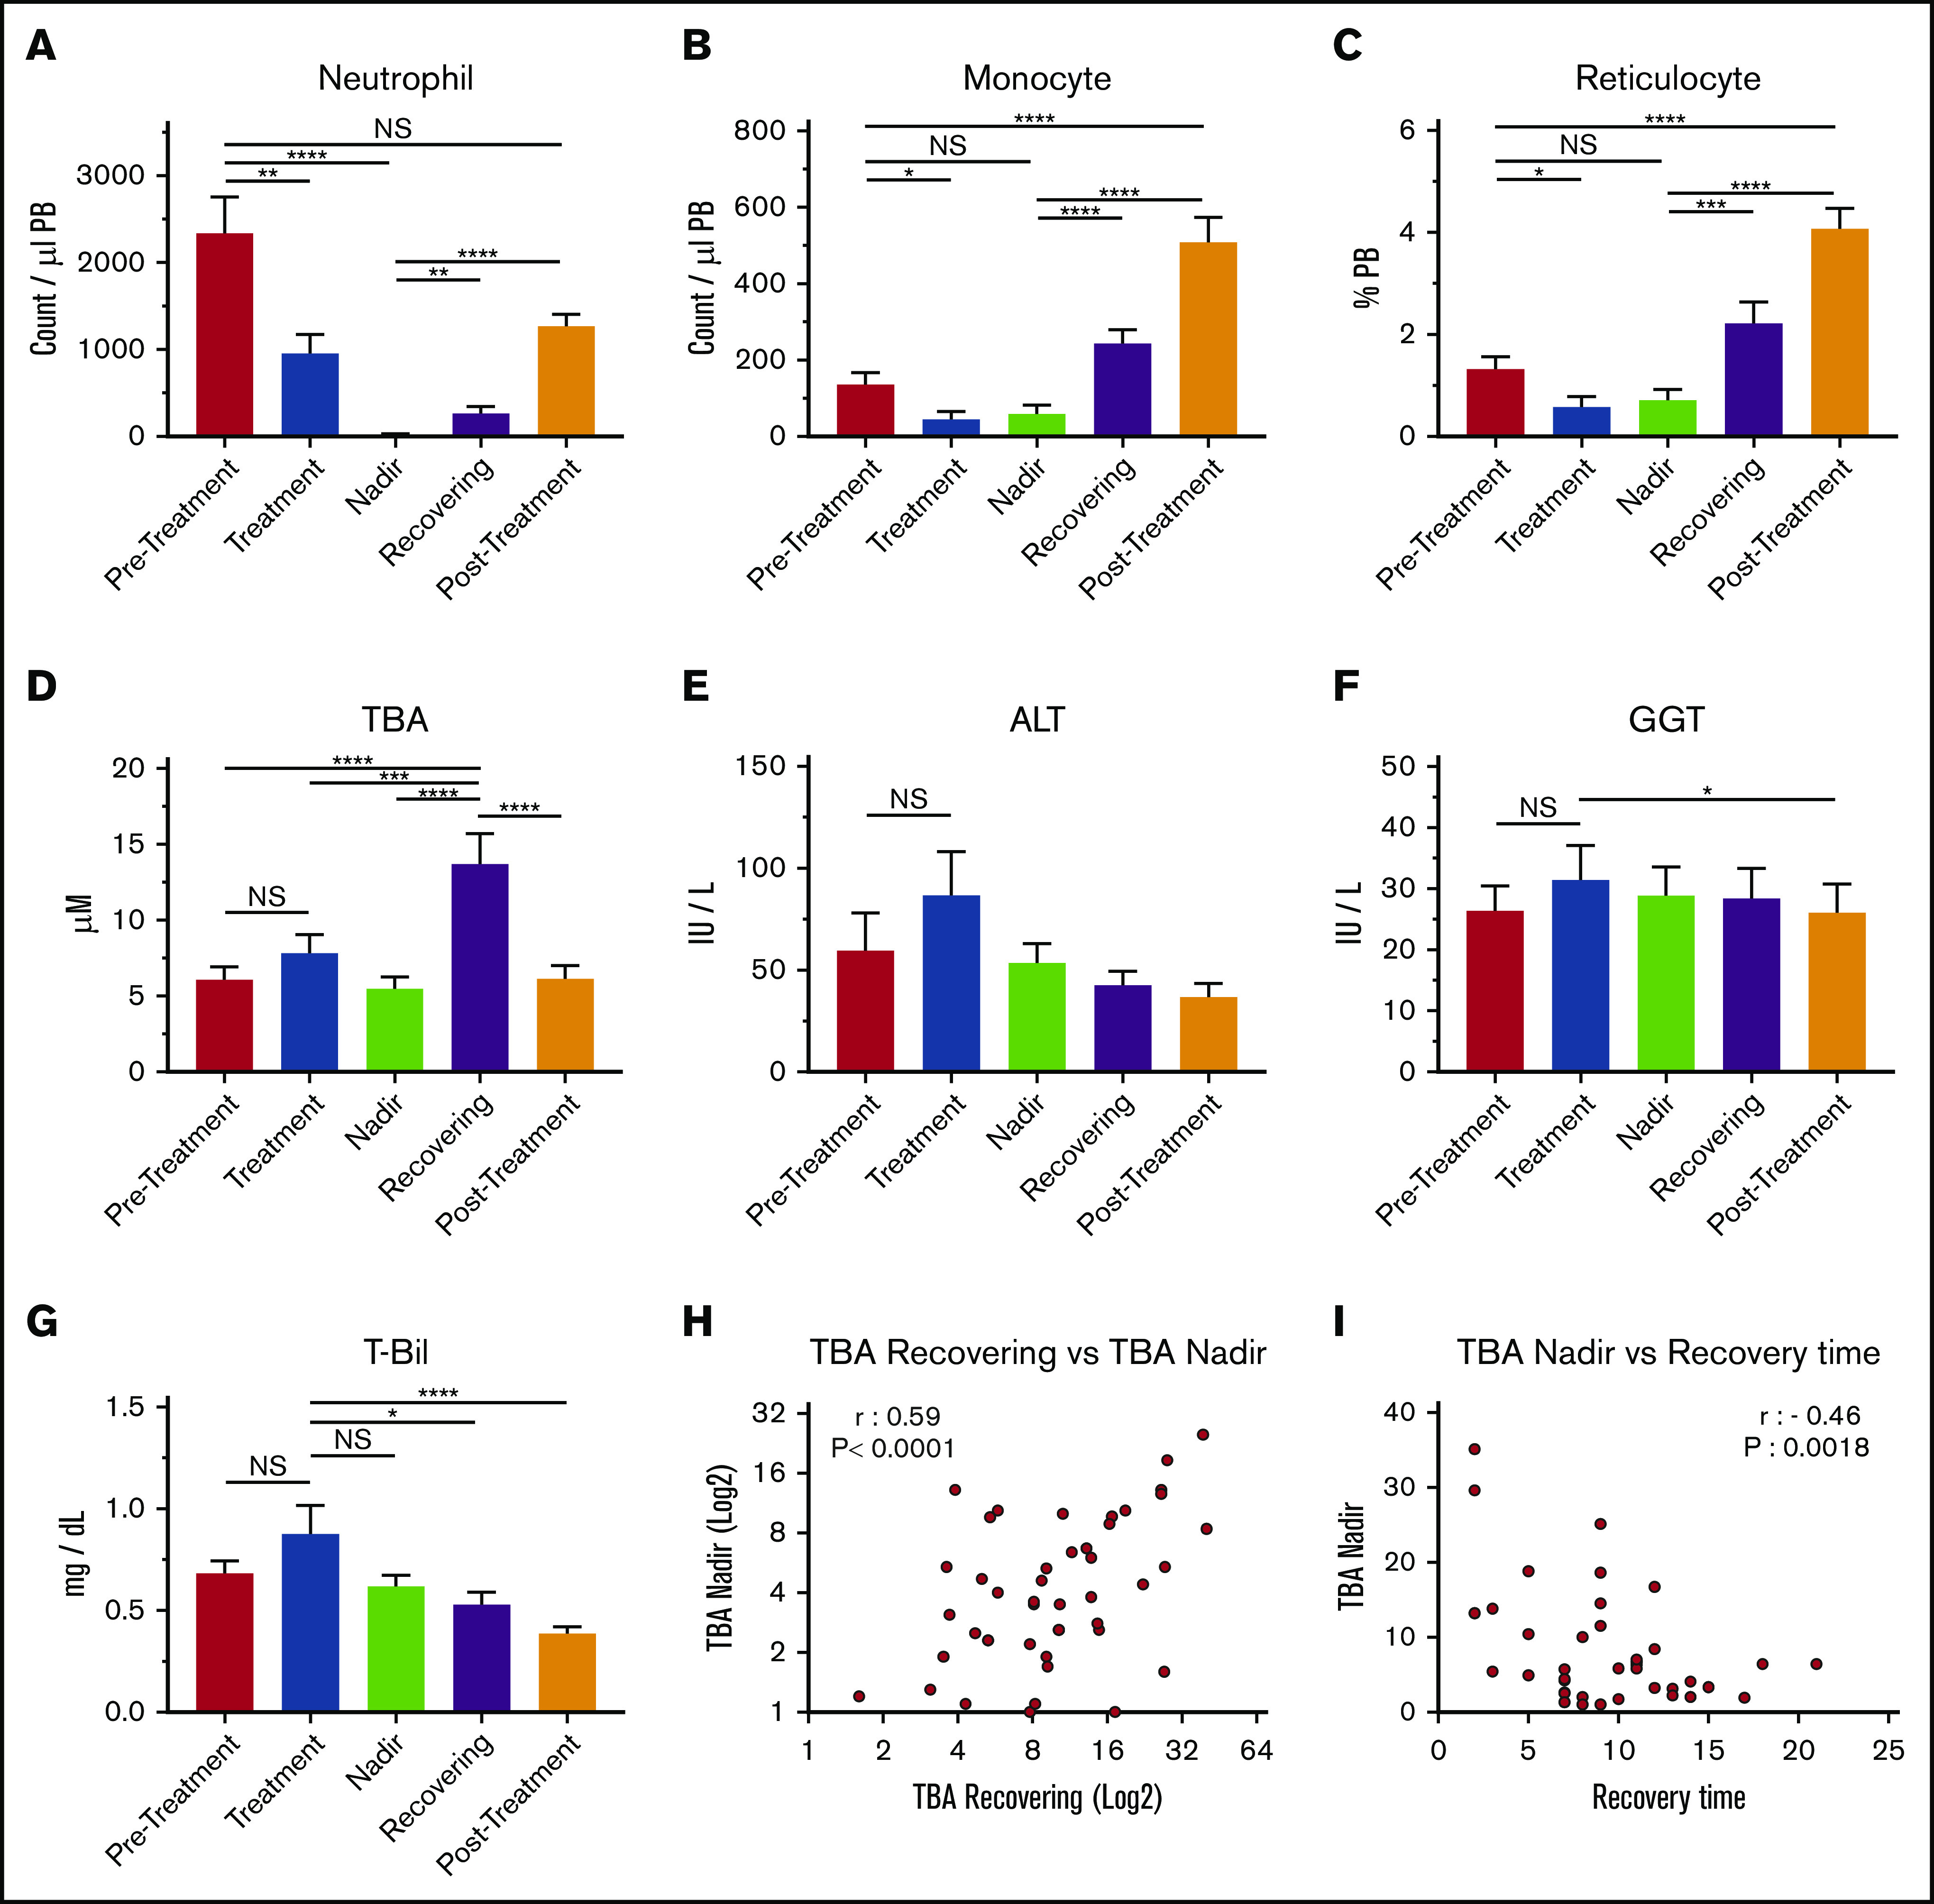
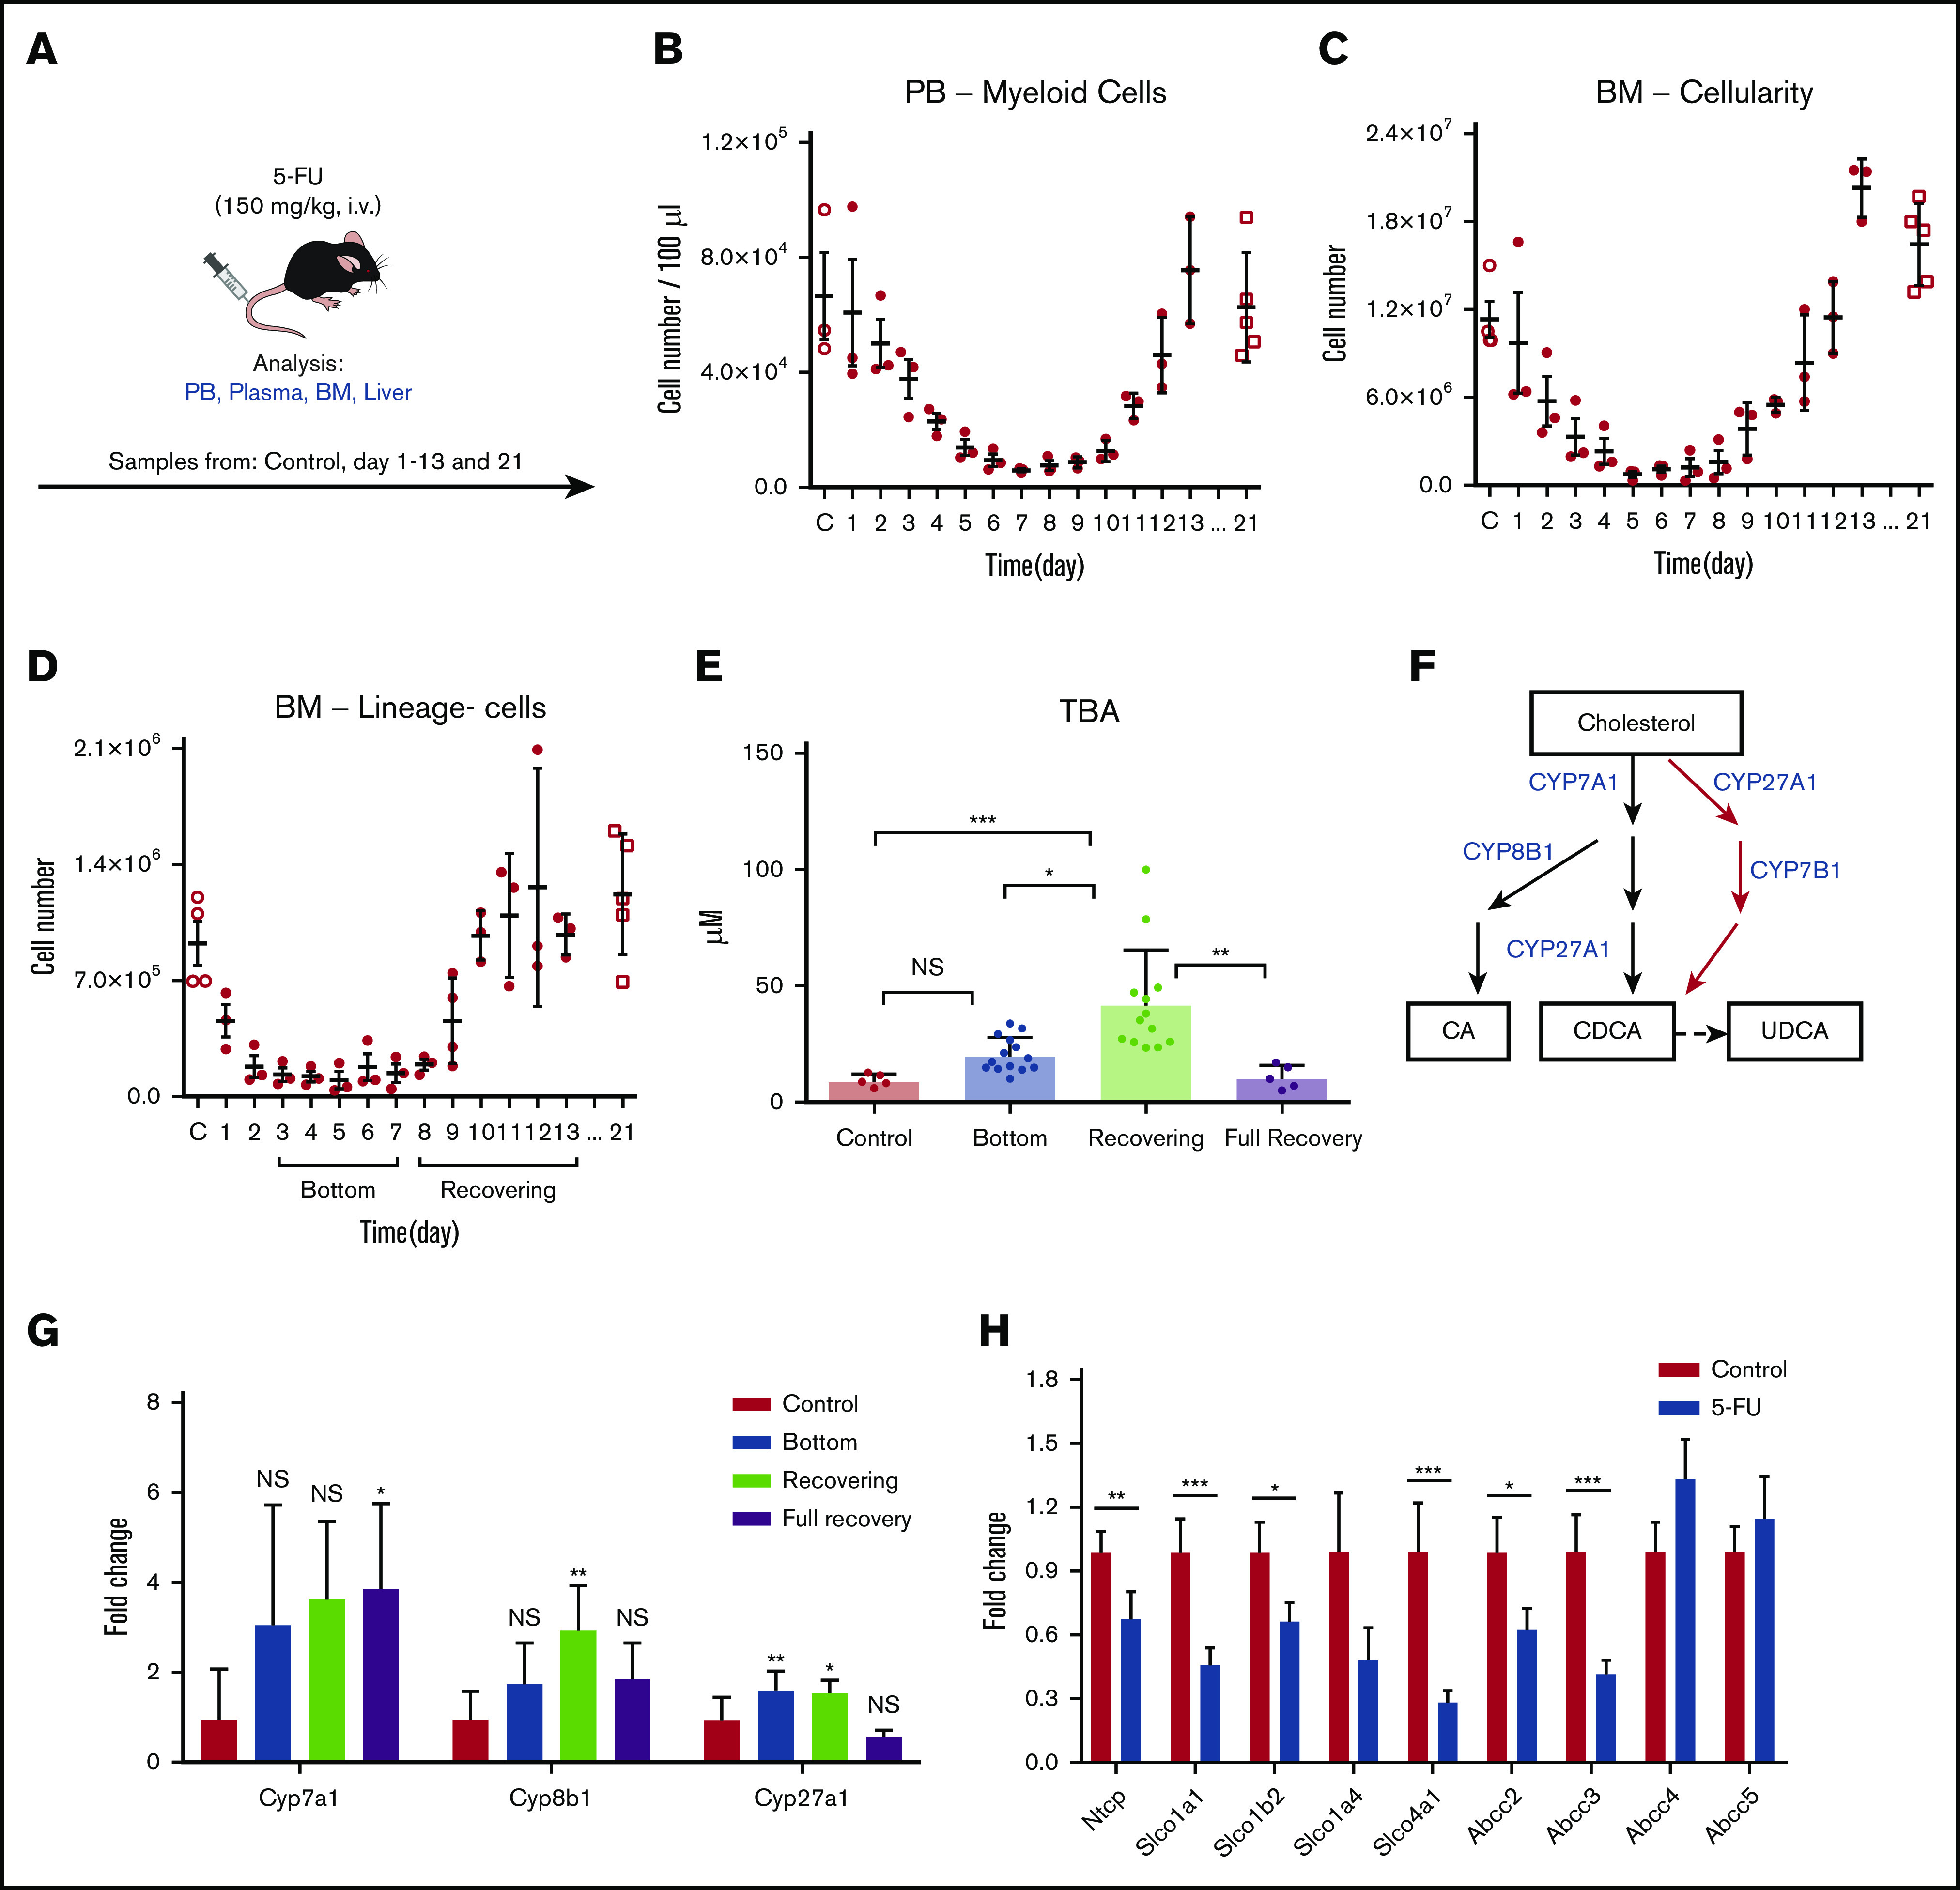
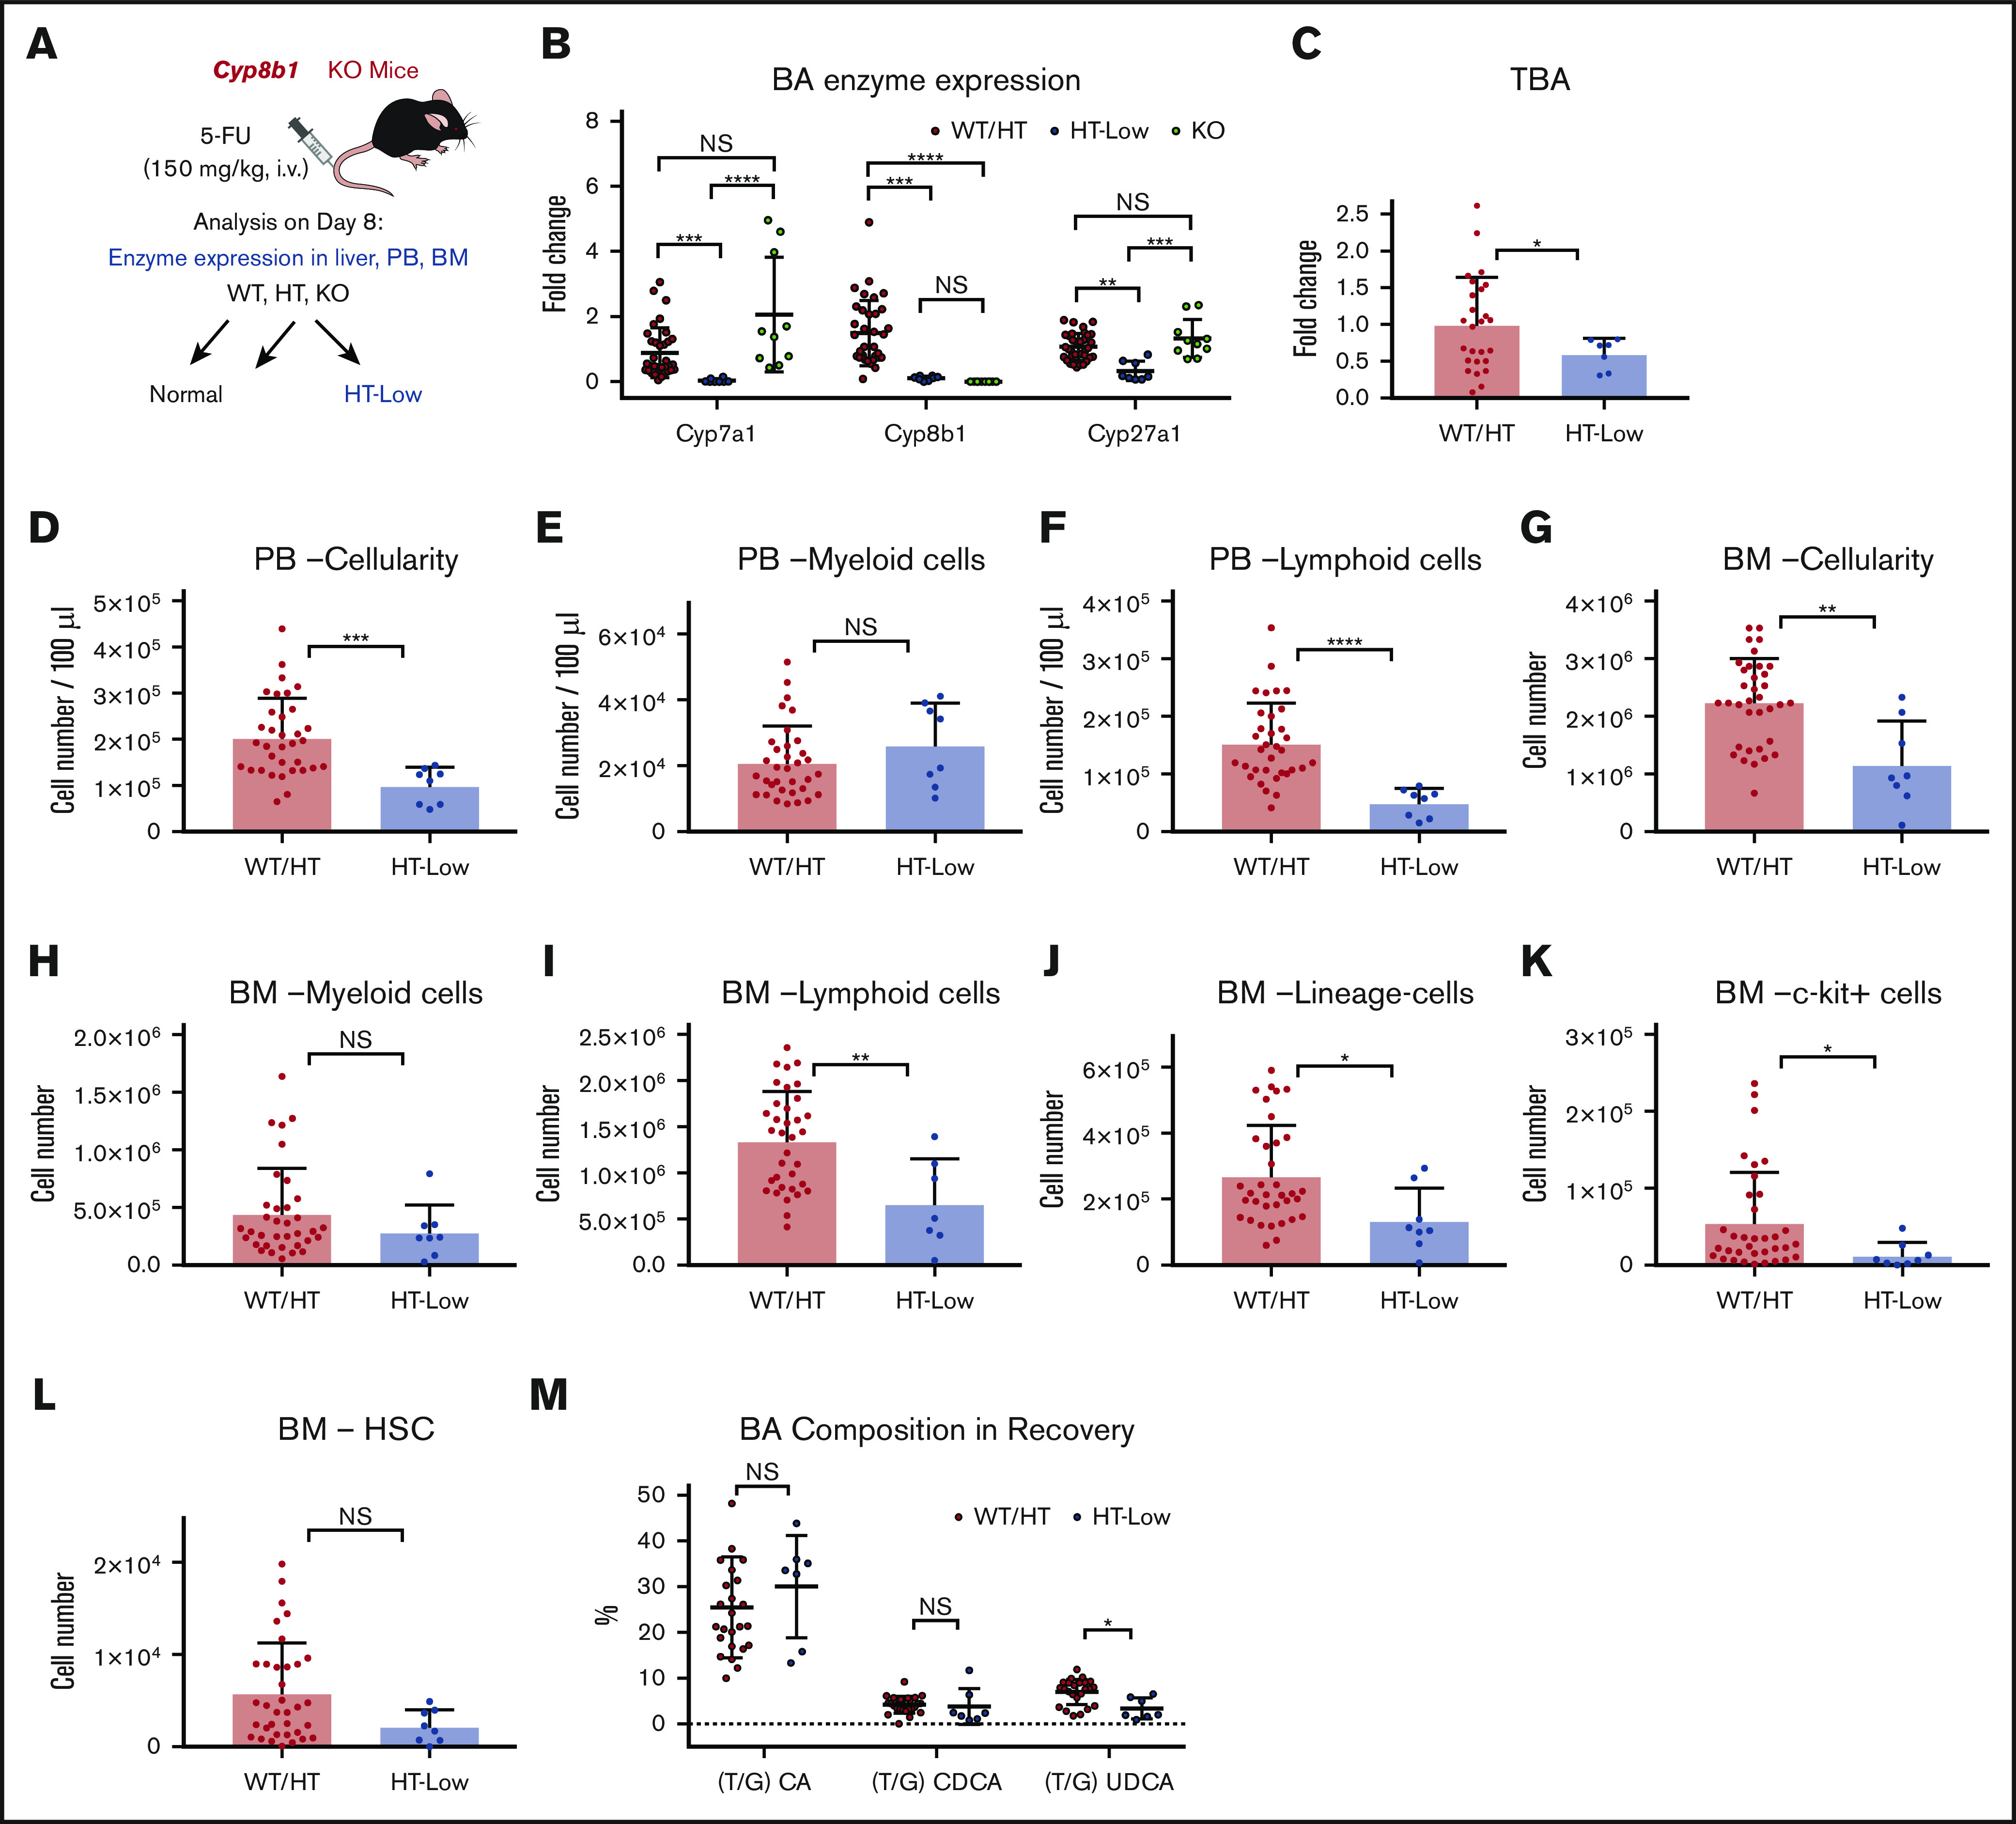
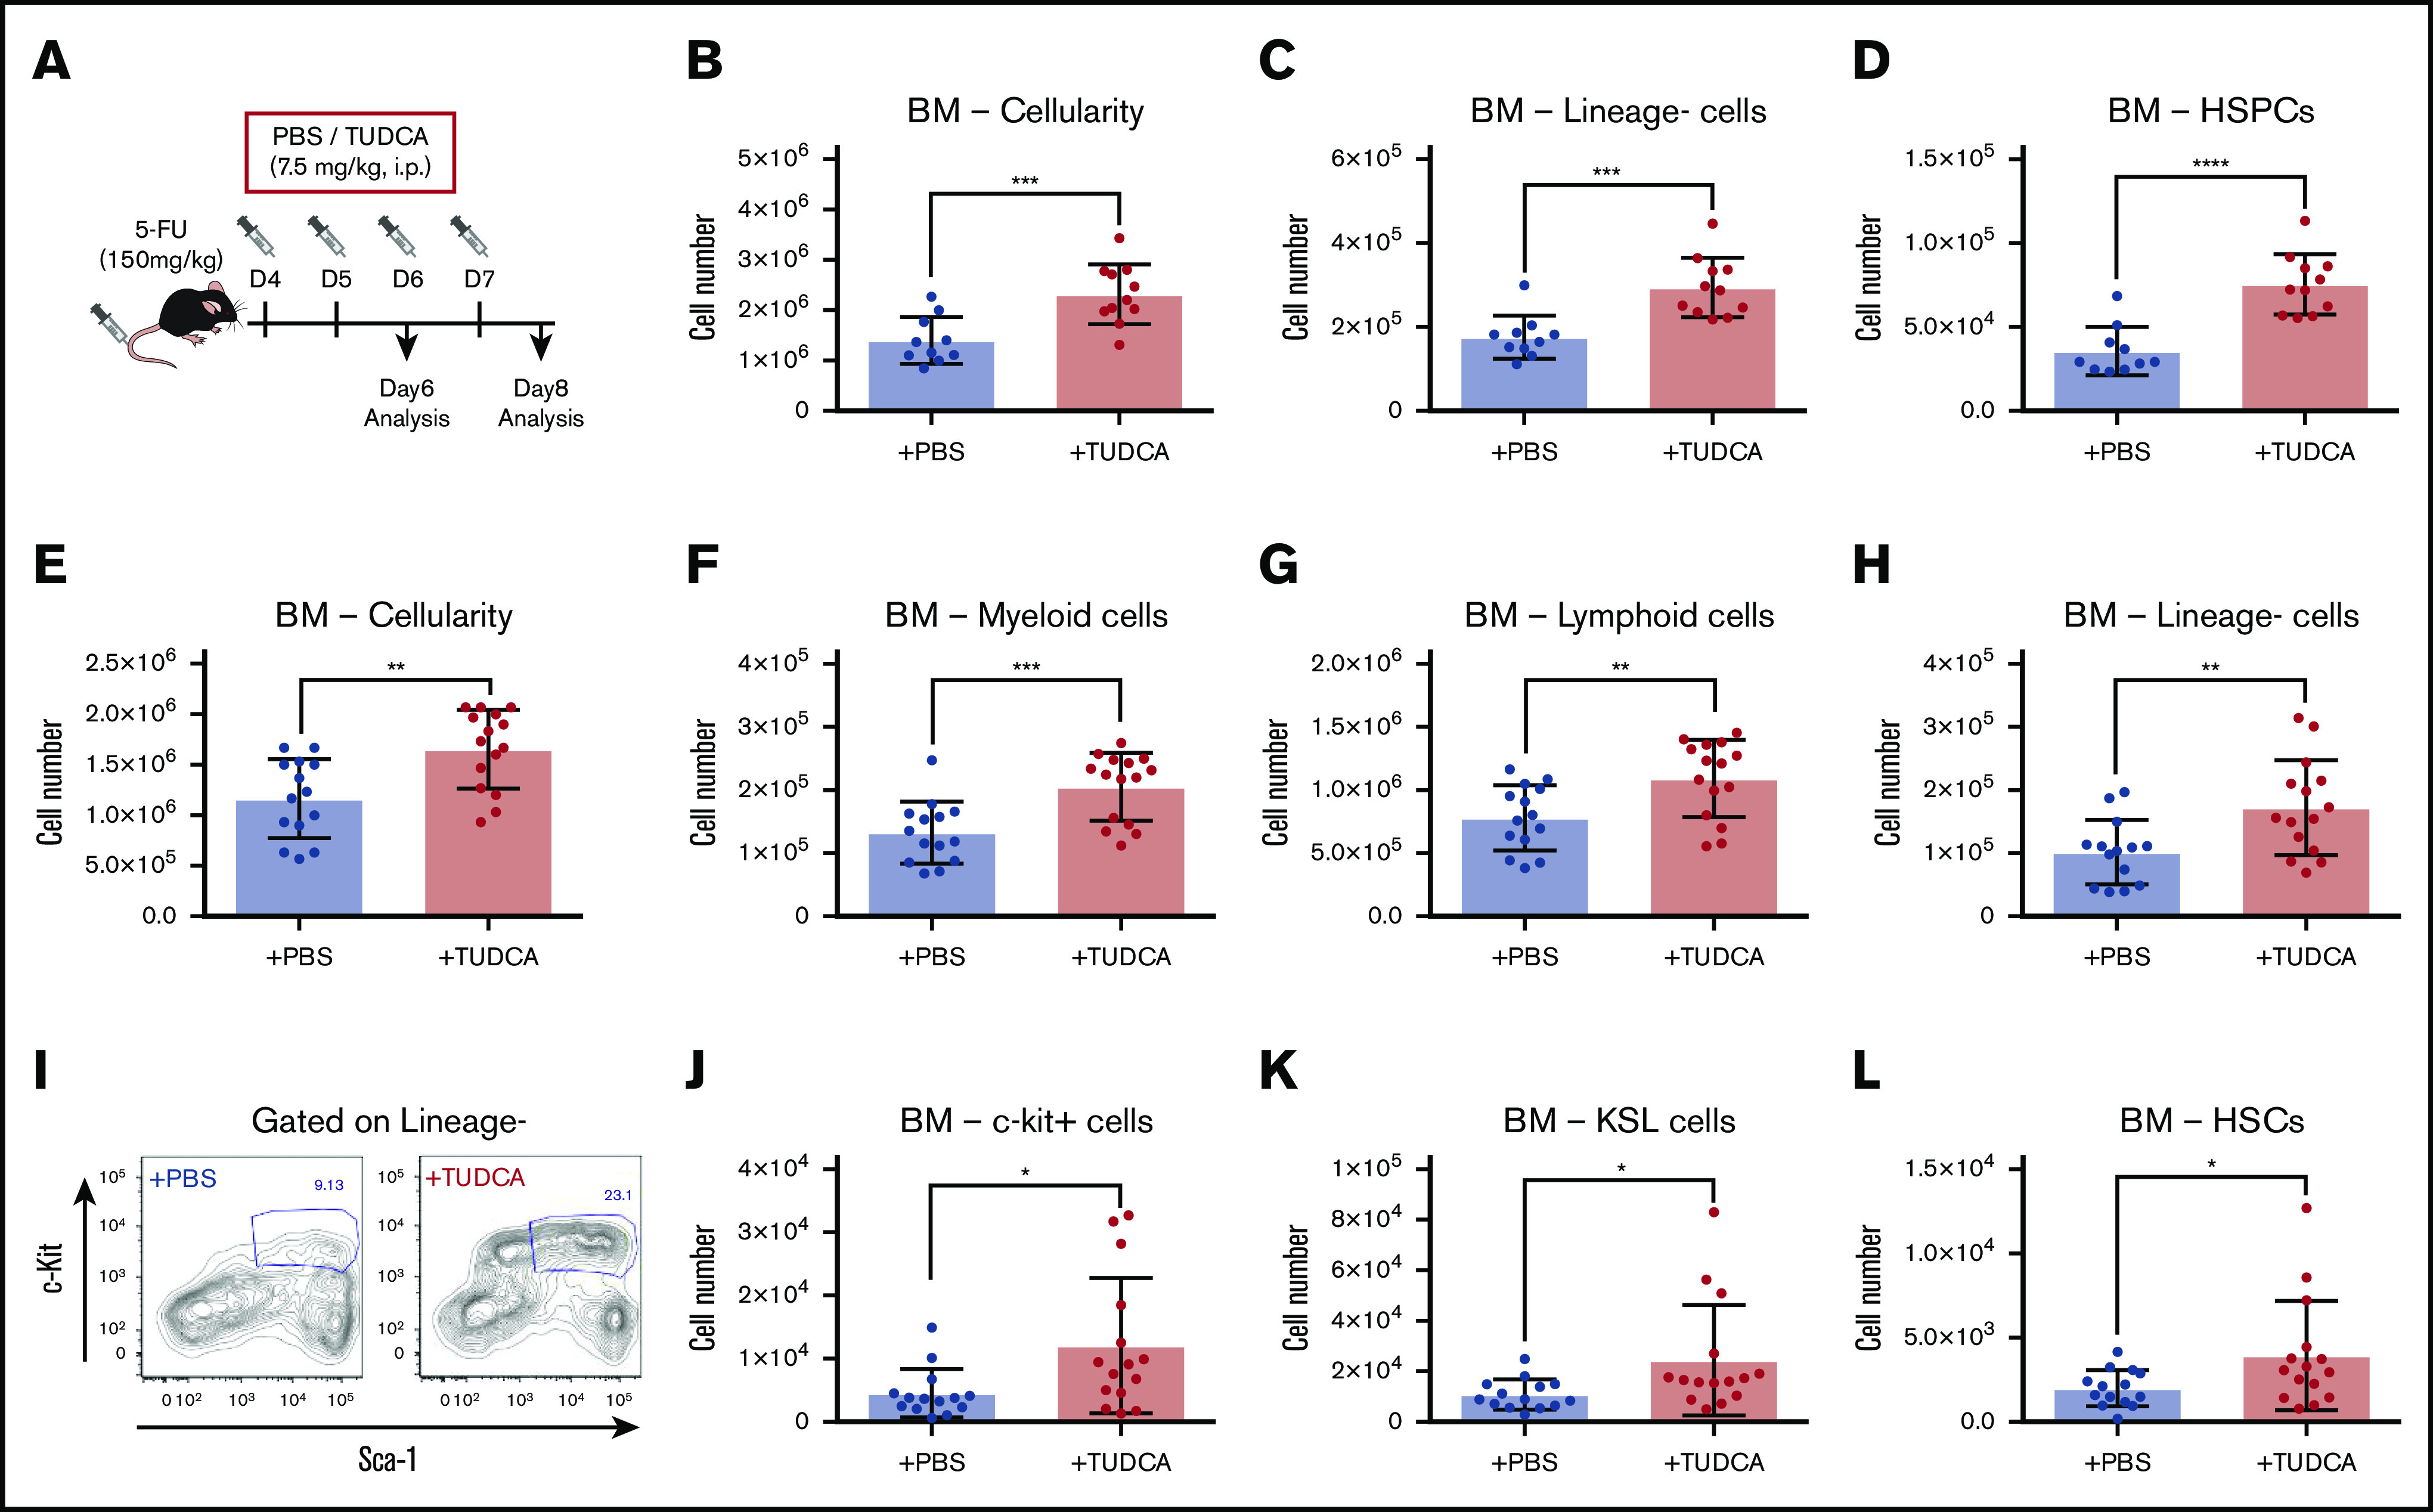
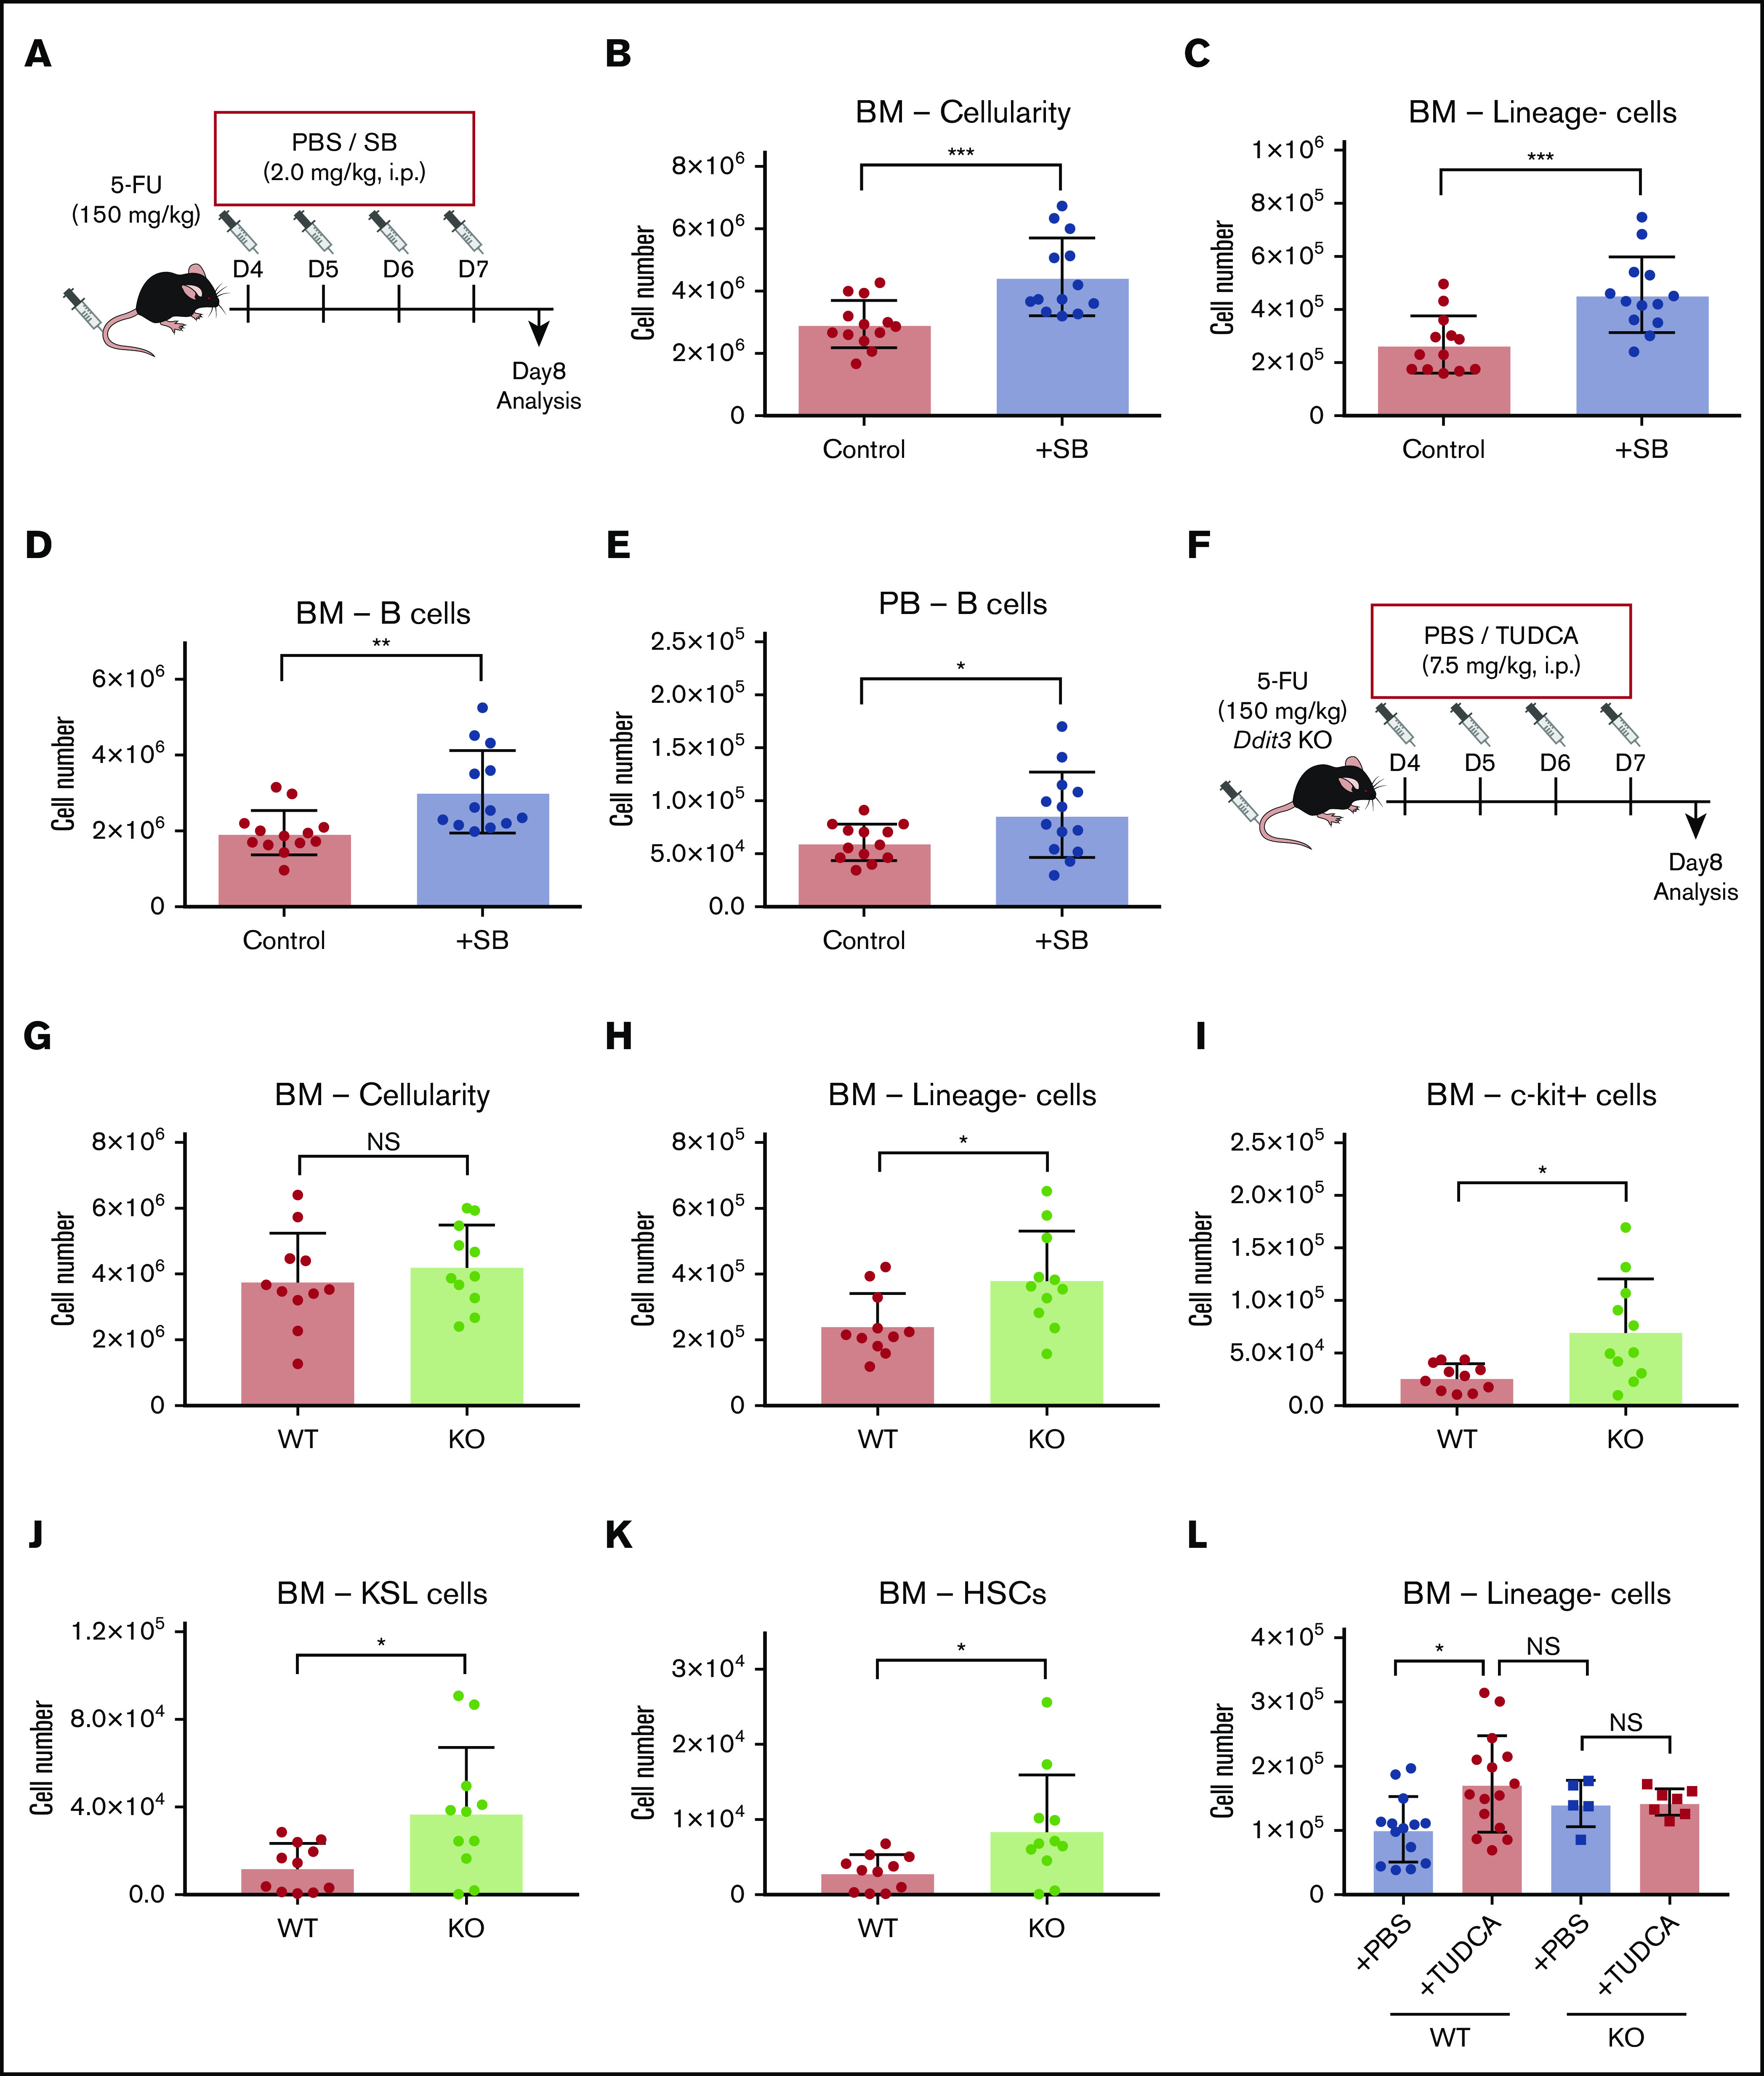
Chemotherapeutic agents can reduce bone marrow (BM) activity, causing myelosuppression, a common life-threatening complication of cancer treatment. It is challenging to predict the patients in whom prolonged myelosuppression will occur, resulting in a delay or discontinuation of the treatment protocol. An early indicator of recovery from myelosuppression would thus be highly beneficial in clinical settings. In this study, bile acids (BAs) were highly increased in the systemic circulation as a natural response during recovery from myelosuppression, supporting regeneration of BM cells. BA levels in the blood of pediatric cancer patients and mice treated with chemotherapeutic agents were increased, in synchrony with early proliferation of BM cells and recovery from myelosuppression. In a mouse model of altered BA composition, Cyp8b1 knockout mice, a subset of mice recovered poorly after chemotherapy. The poor recovery correlated with low levels and changes in composition of BAs in the liver and systemic circulation. Conversely, BA supplementation in chemotherapy-treated wild-type mice resulted in significantly improved recovery. The results suggest that part of the mechanism by which BAs support recovery is the suppression of endoplasmic reticulum stress pathways in expanding and recovering hematopoietic cells. The findings propose a novel role of BAs as early markers of recovery and active components of the recovery process after chemotherapy.


Conflict of interest statement

Conflict-of-interest disclosure: The authors declare no competing financial interests.

Figures

None
Graphical abstract
Figure 1.
Figure 1.
BAs in circulation are upregulated during the recovery of pediatric cancer patients. (A-C) PB cellularity in pediatric patients during chemotherapy protocol. Neutrophils (A), monocytes (B), and reticulocytes (C) were monitored during treatment. Samples were collected in the pretreatment, treatment, nadir, recovering, and posttreatment phases (n = 52). (D) TBA levels in patients’ plasma at the different time points. (n = 52). (E-G) Indications of liver damage. ALT (E), GGT (F), and T-Bil (G) are shown (n = 52). (H) Positive correlation of TBA levels between recovering and the nadir (n = 43). (I) Negative correlation between TBA levels at the nadir and recovery time. The recovery time was determined as days from the lowest (bottom phase) neutrophil count to the date when the count exceeded 500 cells per μL (n = 43). Results are presented as means ± SEM. *P < .05; **P < .01; ***P < .001; ****P < .0001. NS, not significant.
Figure 2.
Figure 2.
BAs in circulation are highly upregulated in a mouse model of chemotherapy. (A) The experimental setup of 5-FU treatment of mice. (B-D) 5-FU treatment and recovery in mice. PB total myeloid cellularity (B), BM total cellularity (C), and the number of lineage cells (D) are shown (n = 3 for each time point). (E) TBA measurement in different phases of treatment and recovery in 5-FU–treated mice. (D) Different phases of treatment and recovery were based on lineage cells (n = 5-14). (F) Production of primary BAs through the classic (black) and alternative (red) pathways. (G) Relative expression levels of key BA-producing enzymes in liver at different time points in 5-FU–treated mice. Fold change relative to control samples is shown (n = 5). (H) Expression changes in the main reuptake and efflux pumps in liver at recovery from 5-FU treatment, compared with the control. Fold change relative to control samples is shown (n = 5). Results are presented as means ± SEM. *P < .05; **P < .01; ***P < .001.
Figure 3.
Figure 3.
Low expression levels of key BA-producing enzymes predict poor recovery in mice. (A) The experimental setup of 5-FU treatment in Cyp8b1 KO mice. Heterozygous mice showing low messenger RNA expression levels of both Cyp7a1 and Cyp8b1 (0.01-fold compared with WT mice) were categorized as HT-low. (B) Expression of key BA-producing enzymes in Cyp8b1 KO mice. Gene expression levels relative to Actb are shown (n = 10-30). (C) TBA levels measured in plasma of Cyp8b1 KO mice on day 8 after 5-FU treatment. Fold change relative to WT/HT is shown (n = 7-26). (D-F) Cellularity in PB of WT/HT or HT-low mice on day 8 after 5-FU treatment. Total cellularity (D), myeloid cells (E), and lymphoid cells (F) are shown (n = 8-34). (G-I) Cellularity in BM of WT/HT or HT-low mice on day 8 after 5-FU treatment. Total cellularity (G), myeloid cells (H), and lymphoid cells (I) in femur and tibia are shown (n = 8-34). (J-L) Cellularity of primitive cells in BM of WT/HT or HT-low mice after 5-FU treatment. Lineage cells (J), c-kit+ cells (K), and HSCs (defined as CD150+CD48c-kit+Sca-I+lineage cells) (L) in femur and tibia are shown (n = 8-34). (M) BA composition in recovery on day 8 after 5-FU injection (n = 7-24). Results are presented as means ± SEM. *P < .05; **P < .01; ***P < .001; ****P < .0001.
Figure 4.
Figure 4.
BA supplementation improves recovery after 5-FU chemotherapy. (A) The experimental setup of TUDCA supplementation in 5-FU–treated mice. (B-D) Cellularity in BM of TUDCA-treated mice on day 6. Total BM cells (B), lineage cells (C), and HSPCs (defined as lineageCD48CD244CD150+ cells) (D) in femur and tibia are shown (n = 10-11). (E-H) Cellularity in BM of TUDCA-treated mice on day 8. Total BM cells (E), myeloid cells (F), lymphoid cells (G), and lineage cells (H) in femur and tibia are shown (n = 14-15). (I) Flow cytometry plots showing the Sca-I and c-kit expression pattern on lineage BM cells of PBS- and TUDCA-treated mice on day 8. The gate represents c-kit+Sca-I+lineage (KSL) cells. (J-L) Cellularity of primitive cells in BM of the TUDCA-treated mice on day 8. c-Kit+ cells (J), KSL cells (K), and HSCs (defined as CD150+CD48KSL) (L) in femur and tibia are shown (n = 14-15). Results are presented as means ± SEM. *P < .05; **P < .01; ***P < .001; ****P < .0001.
Figure 5.
Figure 5.
Lowering of the ER stress response supports faster recovery after chemotherapy. (A) The experimental setup of 5-FU and SB injection into mice. (B-D) Cellularity in BM and PB of the SB-treated mice on day 8. Total BM cells (B), BM lineage cells (C), BM B cells (D), and PB B cells (E) in femur and tibia are shown. (F) The experimental setup of 5-FU treatment of Ddit3 KO mice (n = 13). (G-K) Cellularity in BM and PB of treated Ddit3 KO mice on day 8. Total BM (G), lineage cells (H), c-kit+ cells (I), KSL cells (J), and HSCs (defined as CD150+CD48 KSL) (K) in BM of the treated Ddit3 KO mice are shown (n = 11). (L) Lineage BM cells of WT or Ddit3 KO mice on day 8 after 5-FU treatment, with or without supplementation of TUDCA. Mice were compared with KO mice that were treated with PBS (n = 5-15). Results are presented as means ± SEM. *P < .05; **P < .01; ***P < .001.

References

    1. Crawford J, Dale DC, Lyman GH. Chemotherapy-induced neutropenia: risks, consequences, and new directions for its management. Cancer. 2004;100(2):228-237. - PubMed
    1. Wang Y, Probin V, Zhou D. Cancer therapy-induced residual bone marrow injury: mechanisms of induction and implication for therapy. Curr Cancer Ther Rev. 2006;2(3):271-279. - PMC - PubMed
    1. Voloshin T, Gingis-Velitski S, Bril R, et al. . G-CSF supplementation with chemotherapy can promote revascularization and subsequent tumor regrowth: prevention by a CXCR4 antagonist. Blood. 2011;118(12):3426-3435. - PMC - PubMed
    1. van Os R, Robinson S, Sheridan T, Mauch PM. Granulocyte-colony stimulating factor impedes recovery from damage caused by cytotoxic agents through increased differentiation at the expense of self-renewal. Stem Cells. 2000;18(2):120-127. - PubMed
    1. Gardner RV. Long term hematopoietic damage after chemotherapy and cytokine. Front Biosci. 1999;4(5):e47-e57. - PubMed

Publication types

Substances