. 2020 Jun 18;5(12):e137495.
doi: 10.1172/jci.insight.137495.

Loss of Snord116 impacts lateral hypothalamus, sleep, and food-related behaviors

Affiliations

Loss of Snord116 impacts lateral hypothalamus, sleep, and food-related behaviors

Marta Pace et al. JCI Insight. .

Abstract

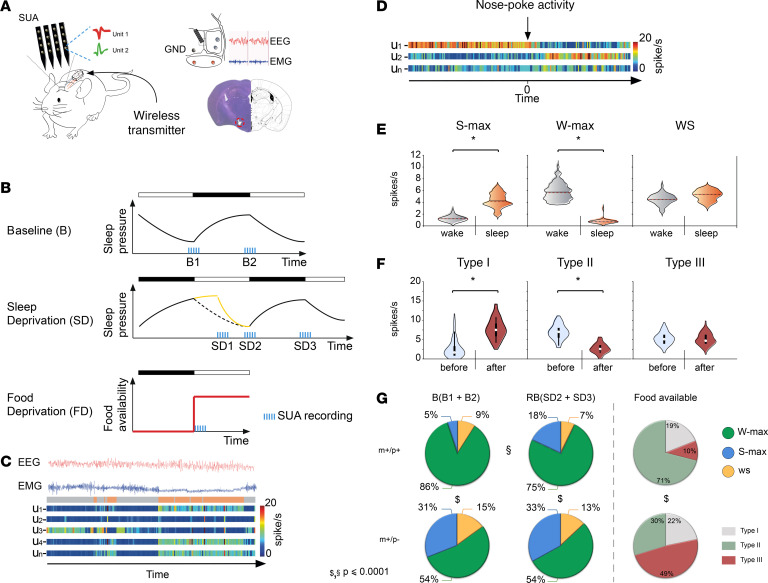
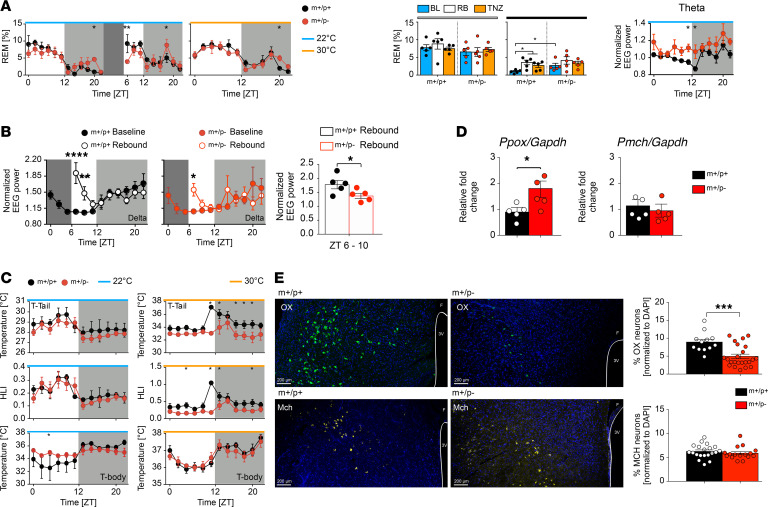
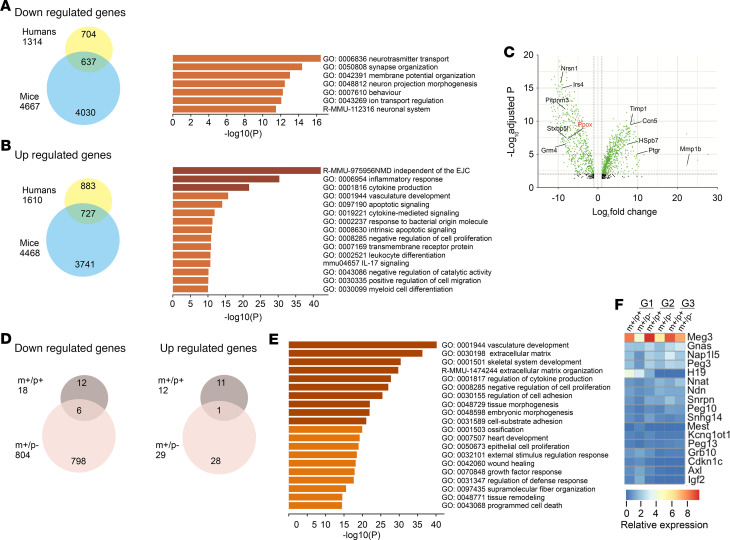
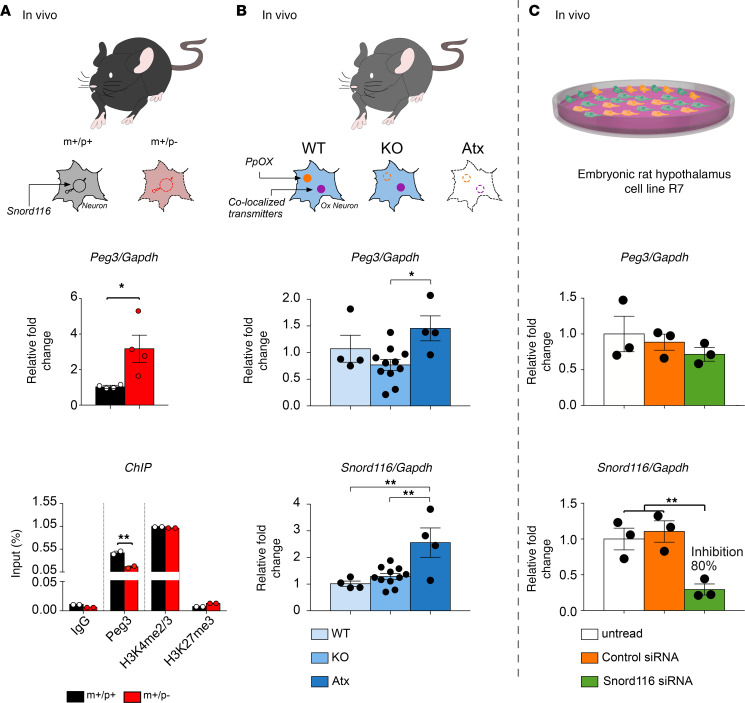
Imprinted genes are highly expressed in the hypothalamus; however, whether specific imprinted genes affect hypothalamic neuromodulators and their functions is unknown. It has been suggested that Prader-Willi syndrome (PWS), a neurodevelopmental disorder caused by lack of paternal expression at chromosome 15q11-q13, is characterized by hypothalamic insufficiency. Here, we investigate the role of the paternally expressed Snord116 gene within the context of sleep and metabolic abnormalities of PWS, and we report a significant role of this imprinted gene in the function and organization of the 2 main neuromodulatory systems of the lateral hypothalamus (LH) - namely, the orexin (OX) and melanin concentrating hormone (MCH) - systems. We observed that the dynamics between neuronal discharge in the LH and the sleep-wake states of mice with paternal deletion of Snord116 (PWScrm+/p-) are compromised. This abnormal state-dependent neuronal activity is paralleled by a significant reduction in OX neurons in the LH of mutant mice. Therefore, we propose that an imbalance between OX- and MCH-expressing neurons in the LH of mutant mice reflects a series of deficits manifested in the PWS, such as dysregulation of rapid eye movement (REM) sleep, food intake, and temperature control.

Keywords: Epigenetics; Neuroscience.


Conflict of interest statement

Conflict of interest: The authors have declared that no conflict of interest exists.

Figures

Figure 1
Figure 1. Loss of paternal Snord116 alters neuronal dynamics in the LH associated with sleep and food.
(A) The cartoon shows mice chronically implanted with a microwire array of 16 channels and with an EEG-EMG wireless transmitter. The correct placement of the SUA electrode was histologically verified by 40-μm Nissl-stained coronal brain sections (bregma, –1.10/–1.90). (B) The experimental design used to record SUA and the sleep-wake cycle. (C) An example of sleep stages (wakefulness in gray; sleep, including both NREM and REM sleep stages, in orange) aligned with the firing rate recorded in the LH. The heatmaps show the response firing rate in spikes/second from 0 Hz (blue) to 20 Hz (red). (D) The heatmaps show the response firing rate used to classify neurons before and after food consumption (firing rate in spikes/second from 0 Hz [blue] to 20 Hz [red]). (E) Violin plots of classified units according to the sleep-wake cycle according to ANOVA followed by post hoc Bonferroni’s correction (P < 0.05). (F) Violin plots of classified units according to their discharge related to food consumption (paired Student’s t test of the firing rate between before and after the pellet was released, binned at 50 ms, P < 0.05). (G) The pie chart represents the distribution of recorded neurons according to the sleep-wake stage: wake (W-max, in green), sleep (both NREM and REM sleep, S-max, in blue), and not responding (ws, yellow). Food-related neurons are classified as Type I neurons, in gray; Type II neurons are in green; and Type III neurons are in red. Differences between the 2 genotypes are indicated by $, while differences within groups across time points are indicated by §. Significance was computed with the χ2 test; for details on the statistical analysis, see Supplemental Tables 2–4. The 2 genotypes investigated were PWScrm+/p− mice (n = 4) and PWScrm+/p+ mice (n = 4).
Figure 2
Figure 2. Homeostatic regulation and thermoregulatory response.
(A) REM distribution in PWScrm+/p+ and PWScrm+/p– mice over a 24-hour (LD:12/12). Baseline (BL), 6 hours sleep deprivation (SD), and 18 hours rebound (RB) are shown. Data are shown as 2-hour bin percentages. Conditions: 22°C and 30°C (TNZ). REM differences across the 2 cohorts (2-way ANOVA; time, F[20,160] = 8.66, P ≤ 0.0001; genotypes, F[8, 160] = 3.33, P ≤ 0.001); at TNZ (2-way ANOVA; time, F[11, 88] = 11.61, P ≤ 0.0001). PWScrm+/p– mice showed an increase in REM sleep (F[1.85,4.74]= 18.06, P = 0.0082). Theta power in REM increased in mutants (2-way ANOVA; F[11,88]= 3.08, P ≤.001 “time”; F(1,8) = 8.04,P = 0.02 “genotypes”). (B) PWScrm+/p+ mice displayed an increased delta from ZT6 to ZT10 (2-way ANOVA: F[11,88]= 28.77 P ≤ 0.0001 “interaction”), while mutants showed a mild increase at ZT 6 (2-way ANOVA; F[11,88] = 12.25 P ≤ 0.0001 “interaction”). PWScrm+/p– mice showed lower delta than PWScrm+/p+ mice in RB (unpaired t test: t[8] = 2.31, P = 0.04). PWScrm+/p– mice (n = 10, 5 mice at 22°C and 5 mice at 30°C) and PWScrm+/p+ mice (n = 10, 5 mice at 22°C and 5 mice at 30°C). (C) T-tail, Heat loss index (HLI), and body temperature profiles are expressed as 2-hour mean ± SEM. Mutants showed increased body temperature at ZT 6 at 22°C (2-way ANOVA: F[11,88] = 3.53, P = 0.0004 “time”; F[11,88] = 7.86, P ≤ 0.0001 “genotypes”). At 30°C, T-tail (2-way ANOVA; F[11,88] = 2.68, P ≤ 0.0001; “interaction”) and HLI (2-way ANOVA; main effect of time of day, F[11,88] = 4.72, P ≤ 0.0001 “interaction”) were increased in PWScrm+/p+ mice. PWScrm+/p– mice (n = 10, 5 mice at 22°C and 5 mice at 30°C) and PWScrm+/p+ mice (n = 10, 5 mice at 22°C and 5 mice at 30°C). (D) PWScrm+/p– mice showed an increase in Ppox (unpaired t test; t[8] = 2.49, P = 0.03). (E) Cell count distribution of OX immunoreactive neurons (upper) and MCH immunoreactive neurons (below) in the lateral hypothalamus. Coronal sections were stained with OX- and MCH-specific antibodies, counterstained with DAPI, and scored. PWScrm+/p– mice (n = 4) and PWScrm+/p+ mice (n = 4). OX+ neurons were reduced in the PWScrm+/p– mutants (unpaired t test; t[33] = 3.85, P = 0.0005). Values are expressed as the percentage of positive neurons relative to all stained nuclei (mean ± SEM). *P ≤ 0.05; **P ≤ 0.01; ***P ≤ 0.001; ****P ≤ 0.0001.
Figure 3
Figure 3. Snord116 loss significantly impacts molecular machinery in the hypothalamus.
(A and B) Venn diagrams illustrating the number of differentially expressed genes (DEGs) that are downregulated (A) and upregulated (B) in the hypothalamus of Prader–Willi syndrome (PWS) PWScrm+/p− mice relative to control mice and that overlap in human patients (29). The results of gene ontology (GO) enrichment analysis of biological processes for the overlapping DEGs are also shown in both A and B. (C) Volcano plots of 637 and 727 DEGs in PWScrm+/p− mice in group 1 (G1; non–sleep deprived). (D) Significantly down- and upregulated genes in the hypothalamus of PWScrm+/p− mutant mice compared with PWScrm+/p+ control mice affected by sleep deprivation (G2 versus G3). (E) GO enrichment analysis of biological processes for 833 (804 down- and 29 upregulated genes in D) DEGs in PWScrm+/p−mutant mice that are significantly affected by sleep deprivation. (F) Heatmap of the relative expression of imprinted genes common in humans and mice assessed in PWScrm+/p− mutant mice compared with the PWScrm+/p+ mice in G1, G2, and G3 (Supplemental Tables 8 and 9). PWScrm+/p− mice and PWScrm+/p+ mice at 3 different time points at ZT 0 (G1; PWS, n = 3, and WT, n = 3), immediately after 6 hours of total SD (G2; PWS, n = 4, and WT, n = 4), and 1 hour after previous SD (G3, n = 4; WT, n = 4).
Figure 4
Figure 4. Snord116 and Peg3 play roles in the formation and maintenance of OX neurons.
Peg3 regulates orexin expression in an independent manner from paternal Snord116. (A) Upper panel, the gene expression analysis of Peg3 in PWScrm+/p− mice (red) versus controls (black). Peg3 mRNA assessed by qPCR was significantly increased in PWScrm+/p− mice compared with PWScrm+/p+ mice (unpaired t test; t(6) = 2.46, P = 0.04). Values expressed are relative to the WT control mean ± SEM. Gapdh was used as a housekeeping gene; see Supplemental Methods. Bottom panel, ChIP analysis of PEG3 binding to the Ppox promoter region in PWScrm+/p− mice (red) versus controls (black). PEG3 binding was lower in PWScrm+/p– mice than in PWScrm+/p+ mice (unpaired t test; t(2) = 7.11, P = 0.01); see Supplemental Methods. (B) Peg3 gene expression (upper panel) and Snord116 gene expression (bottom panel) in Ppox-KO and orexin neuron–ablated (ataxin-3 [Atx] mice). One-way ANOVA indicated that Peg3 was significantly increased in Atx mice relative to KO mice, (F[2,16] = 0.02, Bonferroni’s post hoc test, P = 0.03). Snord116 was increased in Atx mice relative to KO and control mice (WT) (1-way ANOVA; F[2,16]= 3.50, Bonferroni’s post hoc test, P = 0.002). The following genotypes of narcoleptic mice were investigated: WT (n = 4), KO (n = 12), and Atx (n = 4). (C) Snord116 and Peg3 gene expression analysis in the Snord116 siRNA–treated immortalized hypothalamic rat cell line. Snord116 siRNA (green bars) reduced the expression of the Snord116 gene compared with untreated cells or scrambled siRNA–treated cells (white and orange bars, respectively) (1-way ANOVA; F[2,6] = 11.36, Bonferroni’s post hoc test, P = 0.009). Peg3 mRNA levels were unchanged, similar to Snord116 siRNA, in untreated cells and scrambled siRNA–treated cells. The experiment was conducted in triplicate. Data are presented as the mean ± SEM. *P ≤ 0.05; **P ≤ 0.01.

References

    1. Keverne EB, Fundele R, Narasimha M, Barton SC, Surani MA. Genomic imprinting and the differential roles of parental genomes in brain development. Brain Res Dev Brain Res. 1996;92(1):91–100. doi: 10.1016/0165-3806(95)00209-X. - DOI - PubMed
    1. Bonnavion P, Mickelsen LE, Fujita A, de Lecea L, Jackson AC. Hubs and spokes of the lateral hypothalamus: cell types, circuits and behaviour. J Physiol (Lond) 2016;594(22):6443–6462. doi: 10.1113/JP271946. - DOI - PMC - PubMed
    1. Tucci V. Genomic Imprinting: A New Epigenetic Perspective of Sleep Regulation. PLoS Genet. 2016;12(5):e1006004. doi: 10.1371/journal.pgen.1006004. - DOI - PMC - PubMed
    1. Tucci V, Isles AR, Kelsey G, Ferguson-Smith AC, Erice Imprinting Group Genomic Imprinting and Physiological Processes in Mammals. Cell. 2019;176(5):952–965. doi: 10.1016/j.cell.2019.01.043. - DOI - PubMed
    1. Lassi G, et al. Deletion of the Snord116/SNORD116 Alters Sleep in Mice and Patients with Prader-Willi Syndrome. Sleep. 2016;39(3):637–644. doi: 10.5665/sleep.5542. - DOI - PMC - PubMed

Publication types