. 2020 Sep;585(7825):410-413.
doi: 10.1038/s41586-020-2293-x. Epub 2020 May 4.

Effect of non-pharmaceutical interventions to contain COVID-19 in China

Affiliations

Effect of non-pharmaceutical interventions to contain COVID-19 in China

Shengjie Lai et al. Nature. 2020 Sep.

Abstract

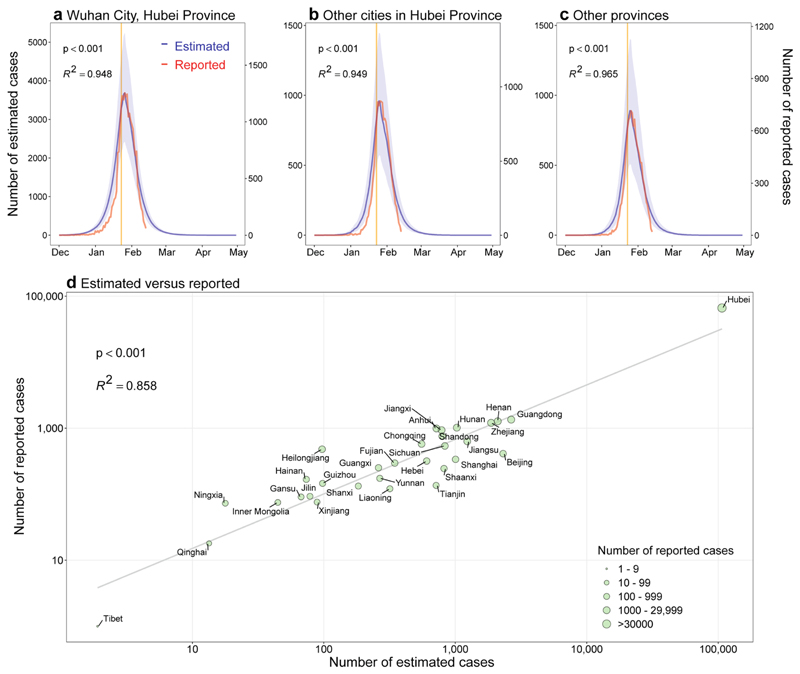
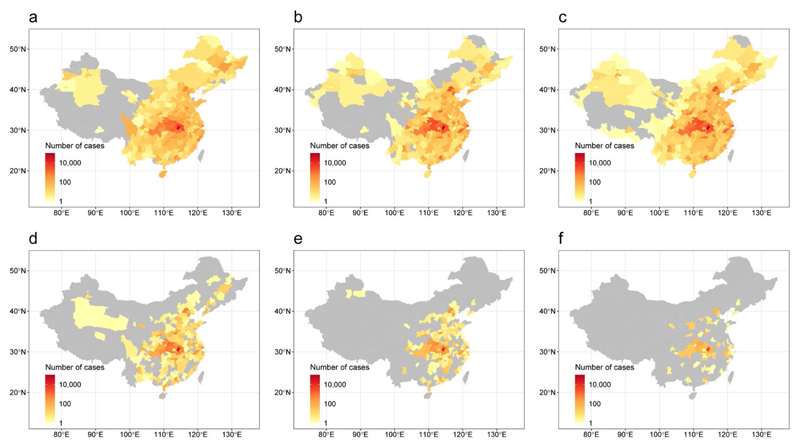
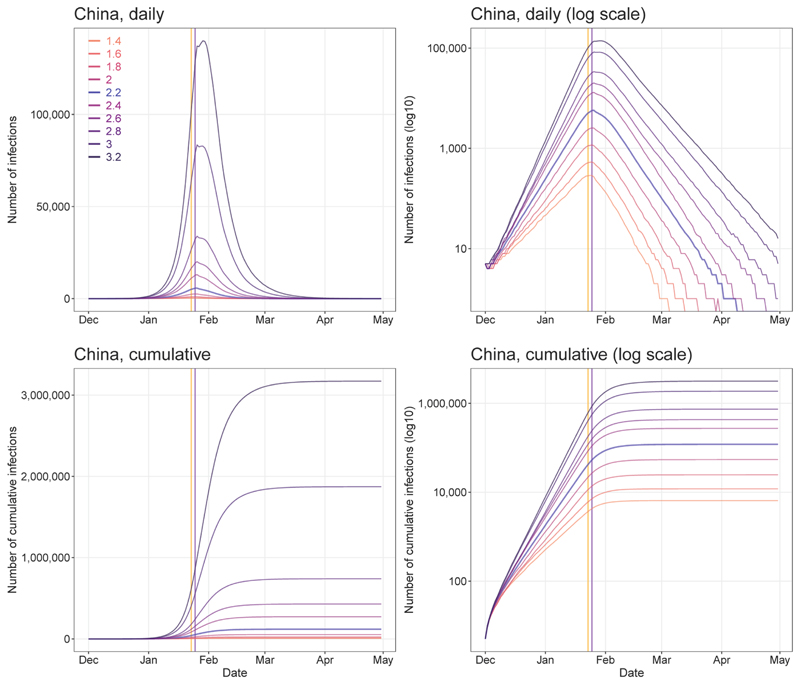
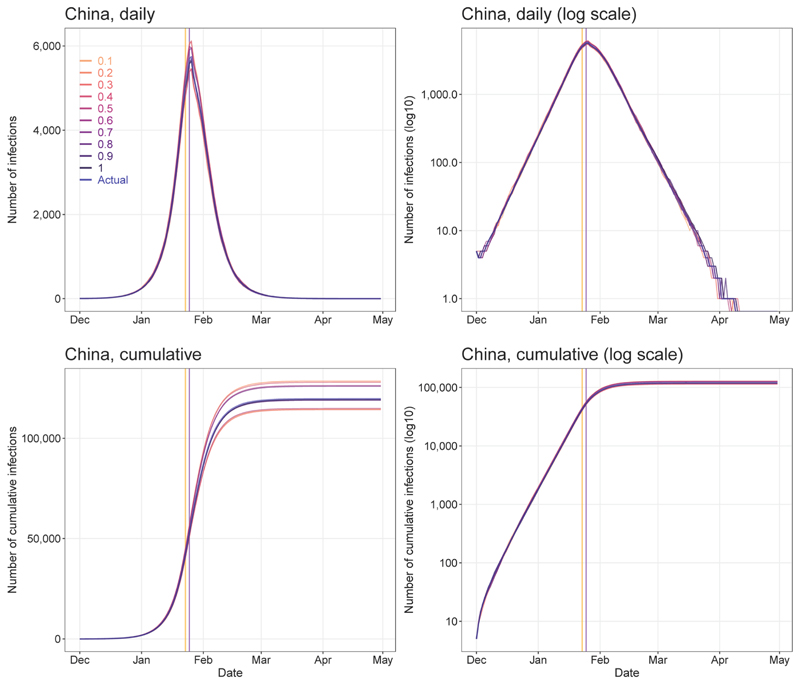
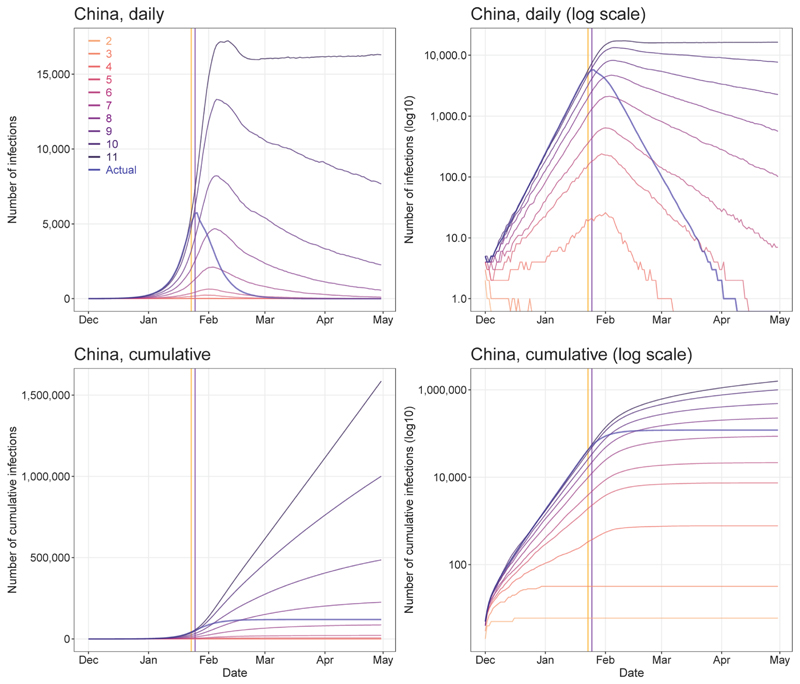
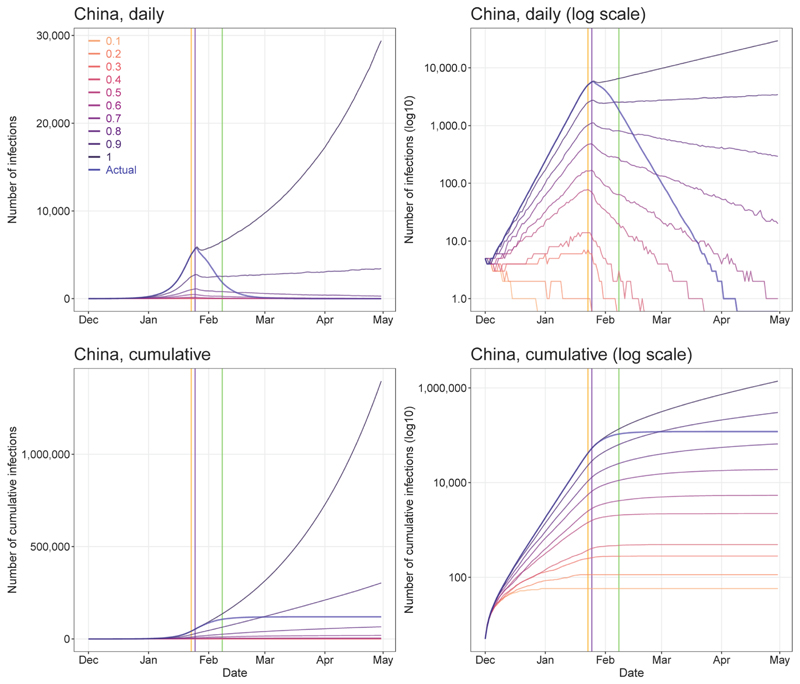
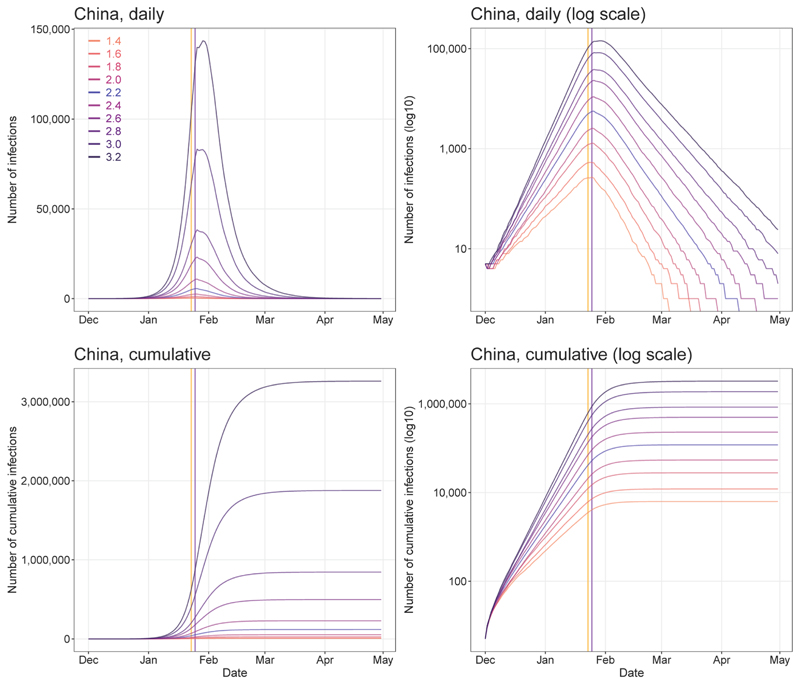
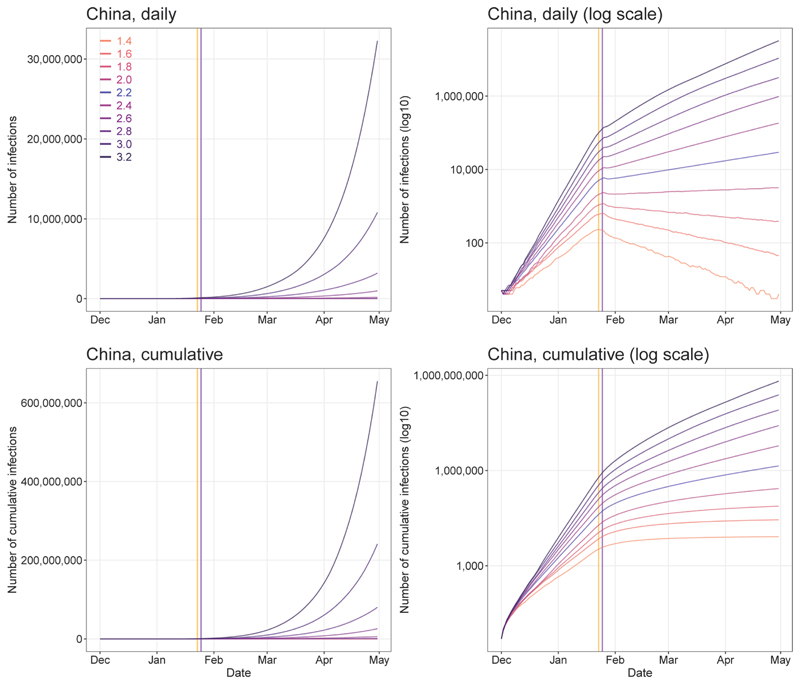
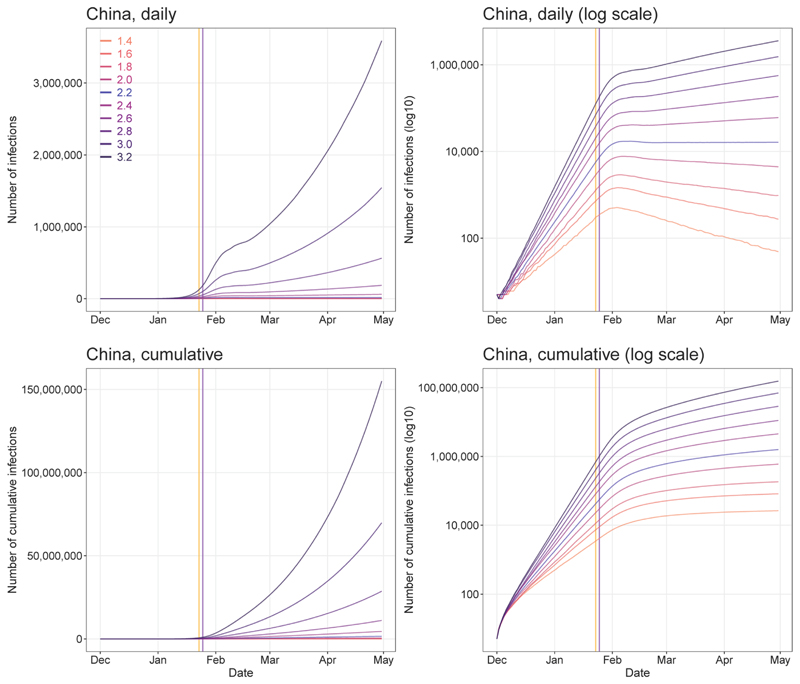
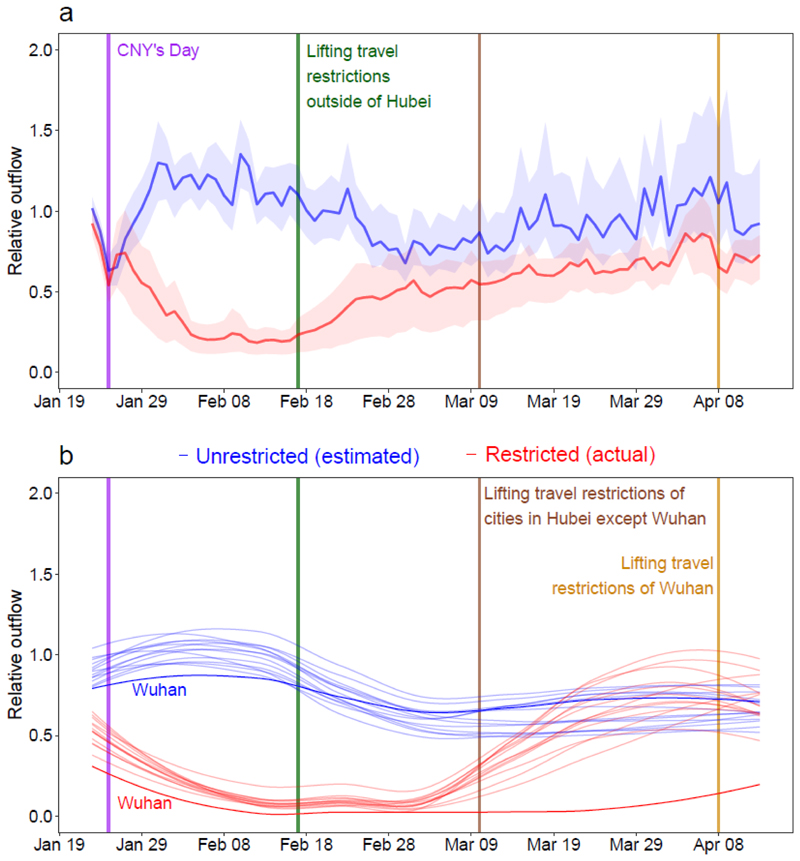
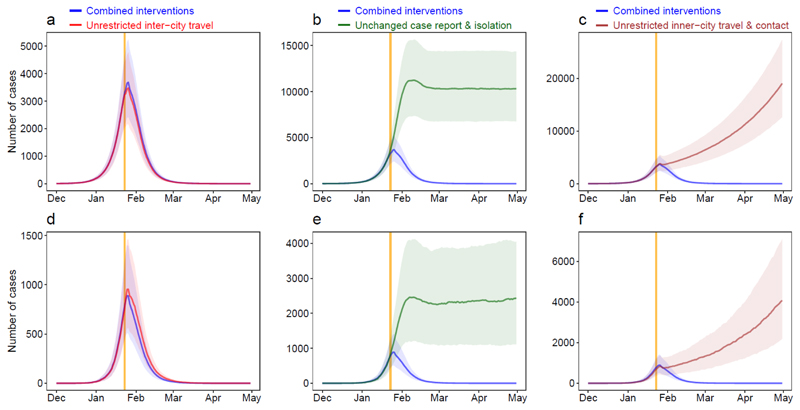
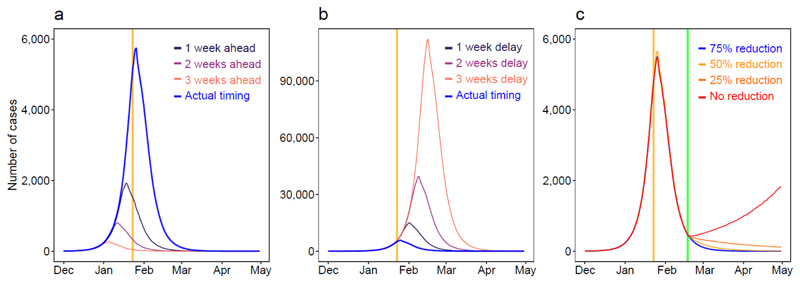
On 11 March 2020, the World Health Organization (WHO) declared coronavirus disease 2019 (COVID-19) a pandemic1. The strategies based on non-pharmaceutical interventions that were used to contain the outbreak in China appear to be effective2, but quantitative research is still needed to assess the efficacy of non-pharmaceutical interventions and their timings3. Here, using epidemiological data on COVID-19 and anonymized data on human movement4,5, we develop a modelling framework that uses daily travel networks to simulate different outbreak and intervention scenarios across China. We estimate that there were a total of 114,325 cases of COVID-19 (interquartile range 76,776-164,576) in mainland China as of 29 February 2020. Without non-pharmaceutical interventions, we predict that the number of cases would have been 67-fold higher (interquartile range 44-94-fold) by 29 February 2020, and we find that the effectiveness of different interventions varied. We estimate that early detection and isolation of cases prevented more infections than did travel restrictions and contact reductions, but that a combination of non-pharmaceutical interventions achieved the strongest and most rapid effect. According to our model, the lifting of travel restrictions from 17 February 2020 does not lead to an increase in cases across China if social distancing interventions can be maintained, even at a limited level of an on average 25% reduction in contact between individuals that continues until late April. These findings improve our understanding of the effects of non-pharmaceutical interventions on COVID-19, and will inform response efforts across the world.


Conflict of interest statement

Competing interests

The authors declare no competing interests.

Figures

Extended Data Fig. 1
Extended Data Fig. 1. Estimated and reported epicurves of COVID-19 outbreak in mainland China.
(a) Wuhan City in Hubei Province. (b) Other cities in Hubei Province. (c) Other 30 provincial regions in mainland China. The orange vertical lines indicate Wuhan’s lockdown on January 23, 2020. The estimated epicurve of COVID-19 cases presents the median (dark blue) and interquatile range (light blue) of estimates (1000 simulations), and the Pearson's correlation between the median of daily estimates and the number of daily reported cases by region as of February 13, 2020 are also presented. (d) The Pearson’s correlation between the total number of estimated cases and the total number of reported cases by province as of February 29, 2020. The p values of two-sided t-test are also provided.
Extended Data Fig. 2
Extended Data Fig. 2. Affected areas of COVID-19 in mainland China under various intervention timings.
(a) A total of 308 cities reported COVID-19 cases, based on the data obtained from national and local health authorities, as of February 29, 2020. (b) Affected areas (298 cities) estimated by models under interventions implemented at actual timing. (c) Estimated affected areas (326 cities) under interventions at actual timing, but without inter-city travel restrictions. (d) Estimated affected areas (192 cities) under interventions at one week earlier than actual timing. (e) Estimated affected areas (130 cities) under interventions implemented at two weeks earlier than actual timing. (f) Estimated affected areas (61 cities) under interventions at three weeks earlier than actual timing. The administrative boundary maps were obtained from the National Platform of Common Geospatial Information Services of China (www.tianditu.gov.cn).
Extended Data Fig. 3
Extended Data Fig. 3. Sensitivity of estimates of COVID-19 epidemics under various values of R0.
All other parameters, NPIs and input data were the same as the baseline model with R0 = 2.2. Vertical lines: orange – date of Wuhan’s lockdown; purple - CNY’s day.
Extended Data Fig. 4
Extended Data Fig. 4. Sensitivity of estimates of COVID-19 epidemics under various levels of inter-city travel restrictions since January 23, 2020.
All other parameters, NPIs and input data were the same as the baseline model with R0 = 2.2. The actual percentages of inter-city travel restrictions changed day-by-day across cities in China (0.1 means 90% reduction from normal travel, 1 means no travel restrictions). Vertical lines: orange – date of Wuhan’s lockdown; purple - CNY’s day.
Extended Data Fig. 5
Extended Data Fig. 5. Sensitivity of estimates of COVID-19 epidemics under various numbers of days from illness onset to report/isolation.
All other parameters, NPIs and input data were the same as the baseline model with R0 = 2.2. The actual delays of illness onset to report/isolation changed day-by-day (appendix Table S2). Vertical lines: orange – date of Wuhan’s lockdown; purple -CNY’s day.
Extended Data Fig. 6
Extended Data Fig. 6. Sensitivity of estimates of COVID-19 epidemics under various contact rate values.
All other parameters, NPIs and input data were the same as the baseline model with R0 = 2.2. The actual percentage of population contact (0.1 means 10% contact as usual, 1 means no contact restrictions) changed day-by-day across the country (appendix Table S1). Vertical lines: orange – date of Wuhan’s lockdown; purple - CNY’s day.
Extended Data Fig. 7
Extended Data Fig. 7. Sensitivity of estimates of COVID-19 epidemics under various values of R0 and without inter-city travel restrictions.
All other parameters, NPIs and input data were the same as the baseline model with R0 = 2.2. Vertical lines: orange – date of Wuhan’s lockdown; purple - CNY’s day.
Extended Data Fig. 8
Extended Data Fig. 8. Sensitivity of estimates of COVID-19 epidemics under various values of R0 but without the intervention of inner-city contact restrictions.
All other parameters, NPIs and input data were the same as the baseline model with R0 = 2.2. Vertical lines: orange – date of Wuhan’s lockdown; purple - CNY’s day.
Extended Data Fig. 9
Extended Data Fig. 9. Sensitivity of estimates of COVID-19 epidemics under various values of R0 but without improved timeliness of case detection and isolation.
The delay from illness onset to detection and isolation was set as a constant of 11 days as that on January 16-18, 2020. All other parameters, NPIs and input data were the same as the baseline model with R0 = 2.2. Vertical lines: orange – date of Wuhan’s lockdown; purple - CNY’s day
Fig. 1
Fig. 1. Relative daily volume of outbound travellers from cities (prefecture level) across mainland China, January 23 – April 13, 2020.
(a) All cities (n=340) in mainland China, presented with the median (solid line) and interquartile range (shading) of relative outbound flows. (b) Cities in Hubei province with Wuhan highlighted by using darker colours. Each red line represents the outflow of each city in 2020, standardized by the mean of daily outflows of each city on January 20th – 22nd, 2020. Each blue line represents estimates of normal outflow by city under the scenario of no travel restrictions, following travel in previous years. The lines of relative volume in (b) were smoothed by using locally estimated scatterplot smoothing (LOESS) regression.
Fig. 2
Fig. 2. Estimated epicurves of the COVID-19 outbreak under various scenarios with or without non-pharmaceutical interventions (NPIs) by region.
(a) – (c) Wuhan City. (d) – (f) Provinces outside of Hubei Province in mainland China. The blue lines present estimated transmission under current combined NPIs, and each other line represents the scenario without one type of intervention. The median and interquartile range of estimates (1000 simulations) are presented here. The orange vertical line indicates the date of Wuhan’s lockdown on January 23, 2020.
Fig. 3
Fig. 3. Estimates of the COVID-19 outbreak under various scenarios of intervention timing and lifting of travel restrictions across China.
(a) Estimated epicurves under interventions implemented earlier than actual timing. (b) Estimated epicurves under interventions implemented later than actual timing. (c) Estimated COVID-19 spread under different population contact rates after lifting intercity travel restrictions on Feburary 17, 2020. The orange vertical lines indicate the date of Wuhan’s lockdown, and the green line shows the date of travel restrictions being lifted.

Update of

References

    1. World Health Organization. WHO Director-General's opening remarks at the media briefing on COVID-19 - 11 March 2020. 2020 https://www.who.int/dg/speeches/detail/who-director-general-s-opening-re....
    1. Novel Coronavirus Pneumonia Emergency Response Epidemiology Team. The epidemiological characteristics of an outbreak of 2019 novel coronavirus diseases (COVID-19) in China. Chinese Journal of Epidemiology. 2020;41:145–151. - PubMed
    1. World Health Organization. Report of the WHO-China Joint Mission on Coronavirus Disease 2019 (COVID-19) 2020 https://www.who.int/docs/default-source/coronaviruse/who-china-joint-mis....
    1. Baidu Migration. 2020 https://qianxi.baidu.com/
    1. Li Q, et al. Early Transmission Dynamics in Wuhan, China, of Novel Coronavirus-Infected Pneumonia. N Engl J Med. 2020;382:1199–1207. - PMC - PubMed

Publication types

MeSH terms