. 2020 Apr 29;10(5):260.
doi: 10.3390/brainsci10050260.

Transient Conductive Hearing Loss Regulates Cross-Modal VGLUT Expression in the Cochlear Nucleus of C57BL/6 Mice

Affiliations

Transient Conductive Hearing Loss Regulates Cross-Modal VGLUT Expression in the Cochlear Nucleus of C57BL/6 Mice

Takaomi Kurioka et al. Brain Sci. .

Abstract

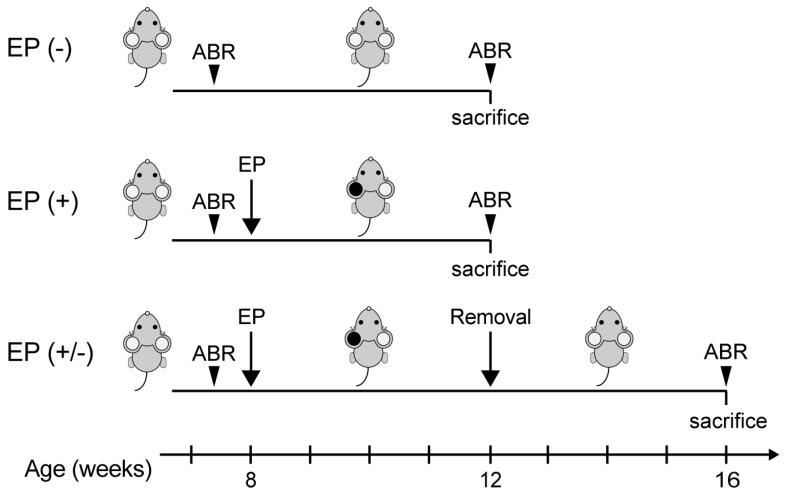
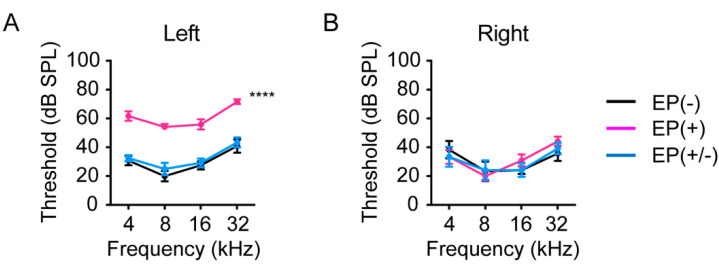
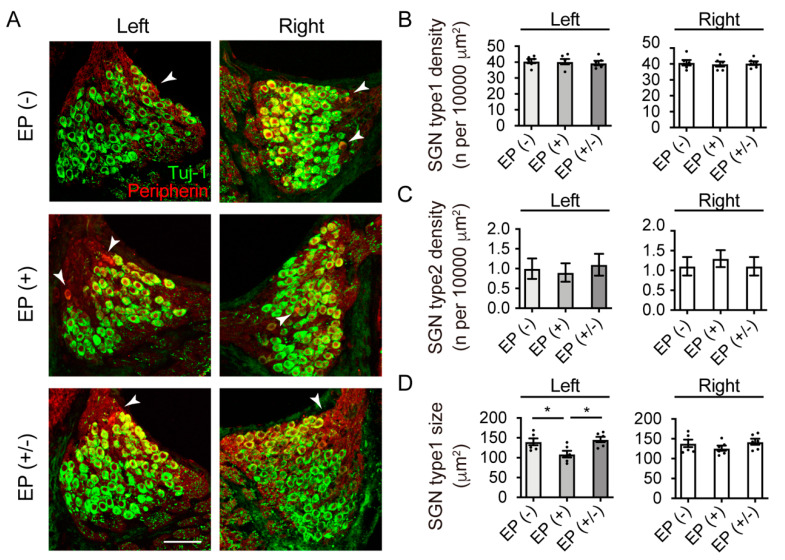
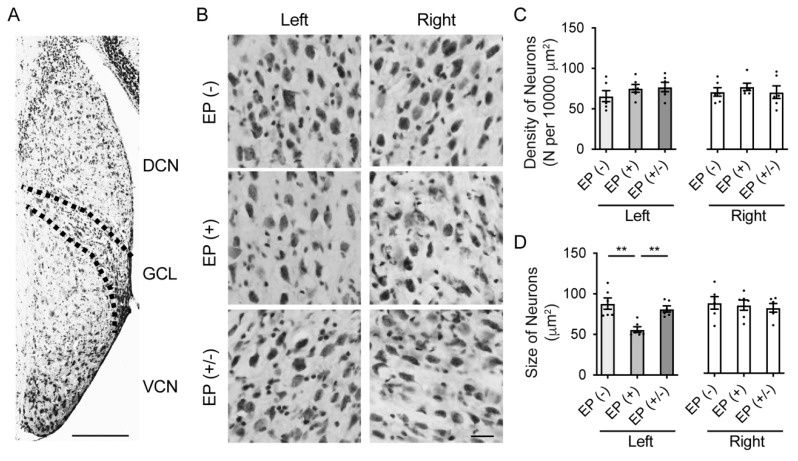
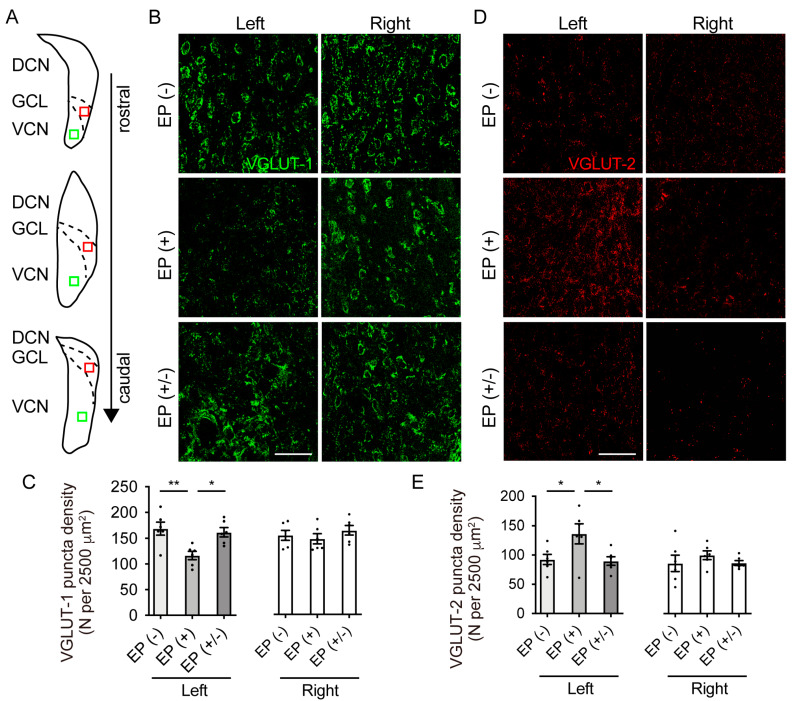
Auditory nerve fibers synapse onto the cochlear nucleus (CN) and are labeled using the vesicular glutamate transporter-1 (VGLUT-1), whereas non-auditory inputs are labeled using the VGLUT-2. However, the underlying regulatory mechanism of VGLUT expression in the CN remains unknown. We examined whether a sound level decrease, without primary neural damage, induces cellular and VGLUT expression change in the CN, and examined the potential for neural plasticity of the CN using unilateral conductive hearing loss models. We inserted earplugs in 8-week-old mice unilaterally for 4 weeks and subsequently removed them for another 4 weeks. Although the threshold of an auditory brainstem response significantly increased across all tested frequencies following earplug insertion, it completely recovered after earplug removal. Auditory deprivation had no significant impact on spiral ganglion and ventral CN (VCN) neurons' survival. Conversely, although the cell size and VGLUT-1 expression in the VCN significantly decreased after earplug insertion, VGLUT-2 expression in the granule cell lamina significantly increased. These cell sizes decreased and the alterations in VGLUT-1 and -2 expression almost completely recovered at 1 month after earplug removal. Our results suggested that the cell size and VGLUT expression in the CN have a neuroplasticity capacity, which is regulated by increases and decreases in sound levels. Restoration of the sound levels might partly prevent cell size decrease and maintain VGLUT expression in the CN.

Keywords: VGLUT; auditory deprivation; cochlear nucleus; neuroplasticity; synapse.


Conflict of interest statement

The authors declare that they have no conflict of interest.

Figures

Figure 1
Figure 1
Experimental schedule. ABR, auditory brainstem response; EP, earplug.
Figure 2
Figure 2
Effects of earplugs on hearing thresholds. (A) ABR thresholds in the EP(+) mice were significantly different from those in the EP(-) and EP(+/-) mice in the occluded left ear. ABR thresholds were measured at 12 weeks of age in the EP(-) and EP(+) mice, and at 4 weeks after EP removal in the EP(+/-) mice (n = 5 per group). (B) No significant differences were observed in the ABR thresholds of the right ear among the groups. ABR measurements were examined at 12 weeks of age in the EP(-) and EP(+) groups and at 16 weeks of age in the EP(+/-) group (n = 5 per group). EP, earplug; ABR, auditory brainstem response; SPL, sound pressure level. ****p < 0.0001.
Figure 3
Figure 3
Immunofluorescence images of TuJ1 (green) and peripherin (red) in the Rosenthal’s canal and quantitative analyses. (A) The Rosenthal canal in all groups appeared densely packed with SGNs with a normal shape appearance. White arrows indicate the peripherin-positive SGNs. The EP(+) and EP(+/-) mice showed roughly similar SGN densities compared to those in the EP(-) group. (B) Type I SGN (TuJ1 positive) density indicated no statistically significant difference among groups in both ears (n = 5 per group). (C) Type II SGN (peripherin positive) density indicated no statistically significant difference among groups in both ears (n = 5 per group). (D) Quantitative analysis showed significantly smaller SGN sizes in the EP(+) than in the EP(−) and EP(+/−) mice in the left ear. No statistically significant differences were observed among the groups in the right ear. Scale bar indicates 50 μm. EP, earplug; SGN, spiral ganglion neuron. *p < 0.05.
Figure 4
Figure 4
Stereological analysis in the VCN and quantitative analyses of cell density and size. (A) Representative images of low magnification stained with cresyl violet show the area of the DCN, GCN, and VCN in the EP(-) mice. Scale bar indicates 200 μm. (B) Representative images of the VCN in high magnification showed the characteristics of VCN cells in each group. Scale bar indicates 50 μm. (C) Quantitative analysis showed that the density of neurons was not significantly different among groups in both ears. (D) Quantitative analysis showed that the neuron size in the VCN for the right ear was not significantly different among groups; however, neuron size was significantly smaller in the left ear of the EP(+) mice than in the EP(-) and EP(+/-) mice. EP, earplug; DCN, dorsal cochlear nucleus; GCL, granule cell lamina; VCN, ventral cochlear nucleus. **, p < 0.01.
Figure 5
Figure 5
VGLUT-1 and VGLUT-2 expression in the VCN and quantitative analyses of puncta density. (A) Schematic view of the right cochlear nucleus (CN) regions indicates the locations where photomicrographs were taken for the analysis of VGLUT-1 (green box) and VGLUT-2 (red box). (B) Representative images of the VCN stained with VGLUT-1 show that puncta density in the right ear was similar in all mice, but lower in the left ear of the EP(+) mice. Scale bar indicates 50 μm. (C) VGLUT-1 puncta density in the right ear showed no significant difference among groups, but was significantly lower in the left ear of the EP(+) than in the corresponding ear of the EP(-) and EP(+/-) mice (n = 5 animals in each group). (D) Representative images of the GCL stained with VGLUT-2 show that the puncta density of the right ear in all mice was similar, but higher in the left ear of the EP(+) mice. Scale bar indicates 50 μm. (E) VGLUT-2 puncta density in the right ear showed no significant difference among groups but was significantly higher in the left ear of the EP(+) mice than in the EP(-) and EP(+/-) mice (n = 5 animals per group). DCN, dorsal cochlear nucleus; GCL, granule cell lamina; VCN, ventral cochlear nucleus; VGLUT-1, vesicular glutamate transporter-1; VGLUT-2, vesicular glutamate transporter-2. **, p < 0.01; *, p < 0.05.

Similar articles

Cited by

References

    1. Spoendlin H. Neuroanatomical Basis of Cochlear Coding Mechanisms. Audiology. 1975;14:383–407. doi: 10.3109/00206097509071752. - DOI - PubMed
    1. Flores E.N., Duggan A., Madathany T., Hogan A.K., Marquez F.G., Kumar G., Seal R.P., Edwards R.H., Liberman M.C., Garcia-Anoveros J. A Non-Canonical Pathway from Cochlea to Brain Signals Tissue-Damaging Noise. Curr. Biol. 2015;25:606–612. doi: 10.1016/j.cub.2015.01.009. - DOI - PMC - PubMed
    1. Barker M., Solinski H.J., Hashimoto H., Tagoe T., Pilati N., Hamann M. Acoustic Overexposure Increases the Expression of Vglut-2 Mediated Projections from the Lateral Vestibular Nucleus to the Dorsal Cochlear Nucleus. PLoS ONE. 2012;7:e35955. doi: 10.1371/journal.pone.0035955. - DOI - PMC - PubMed
    1. Shore S.E. Multisensory Integration in the Dorsal Cochlear Nucleus: Unit Responses to Acoustic and Trigeminal Ganglion Stimulation. Eur. J. Neurosci. 2005;21:3334–3348. doi: 10.1111/j.1460-9568.2005.04142.x. - DOI - PubMed
    1. Zeng C., Nannapaneni N., Zhou J., Hughes L.F., Shore S. Cochlear Damage Changes the Distribution of Vesicular Glutamate Transporters Associated with Auditory and Nonauditory Inputs to the Cochlear Nucleus. J. Neurosci. 2009;29:4210–4217. doi: 10.1523/JNEUROSCI.0208-09.2009. - DOI - PMC - PubMed

LinkOut - more resources