. 2020 Apr 30;12(5):498.
doi: 10.3390/v12050498.

Codon Usage and Phenotypic Divergences of SARS-CoV-2 Genes

Affiliations

Codon Usage and Phenotypic Divergences of SARS-CoV-2 Genes

Maddalena Dilucca et al. Viruses. .

Abstract

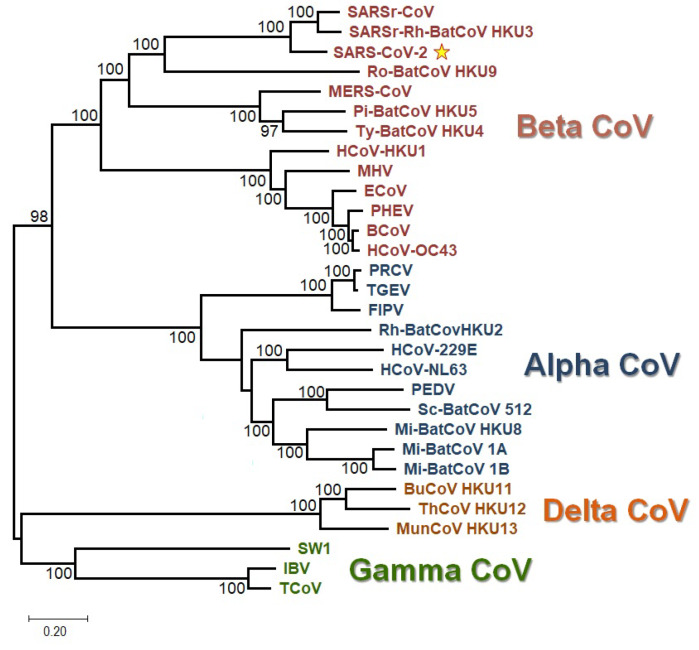
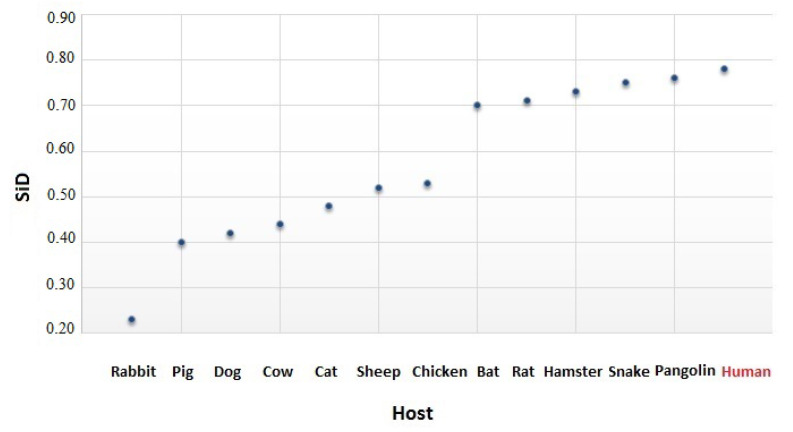
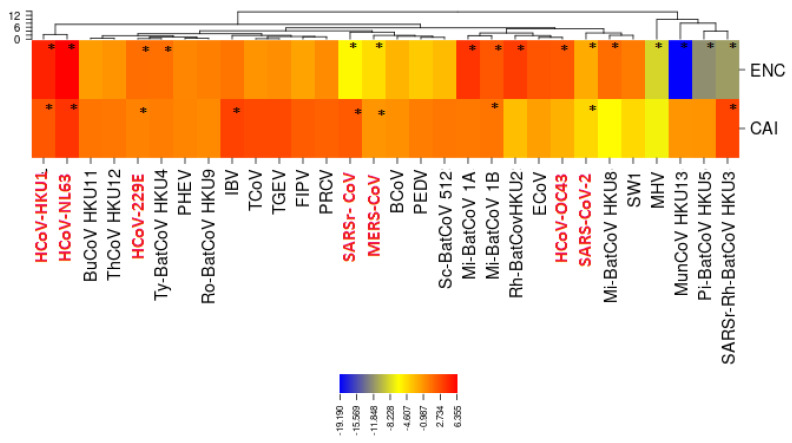
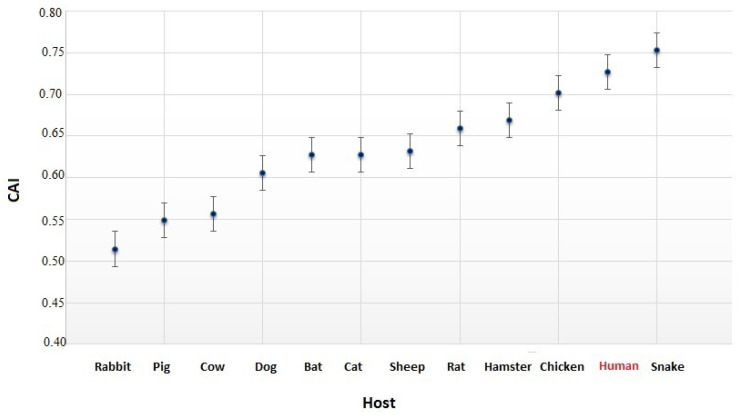
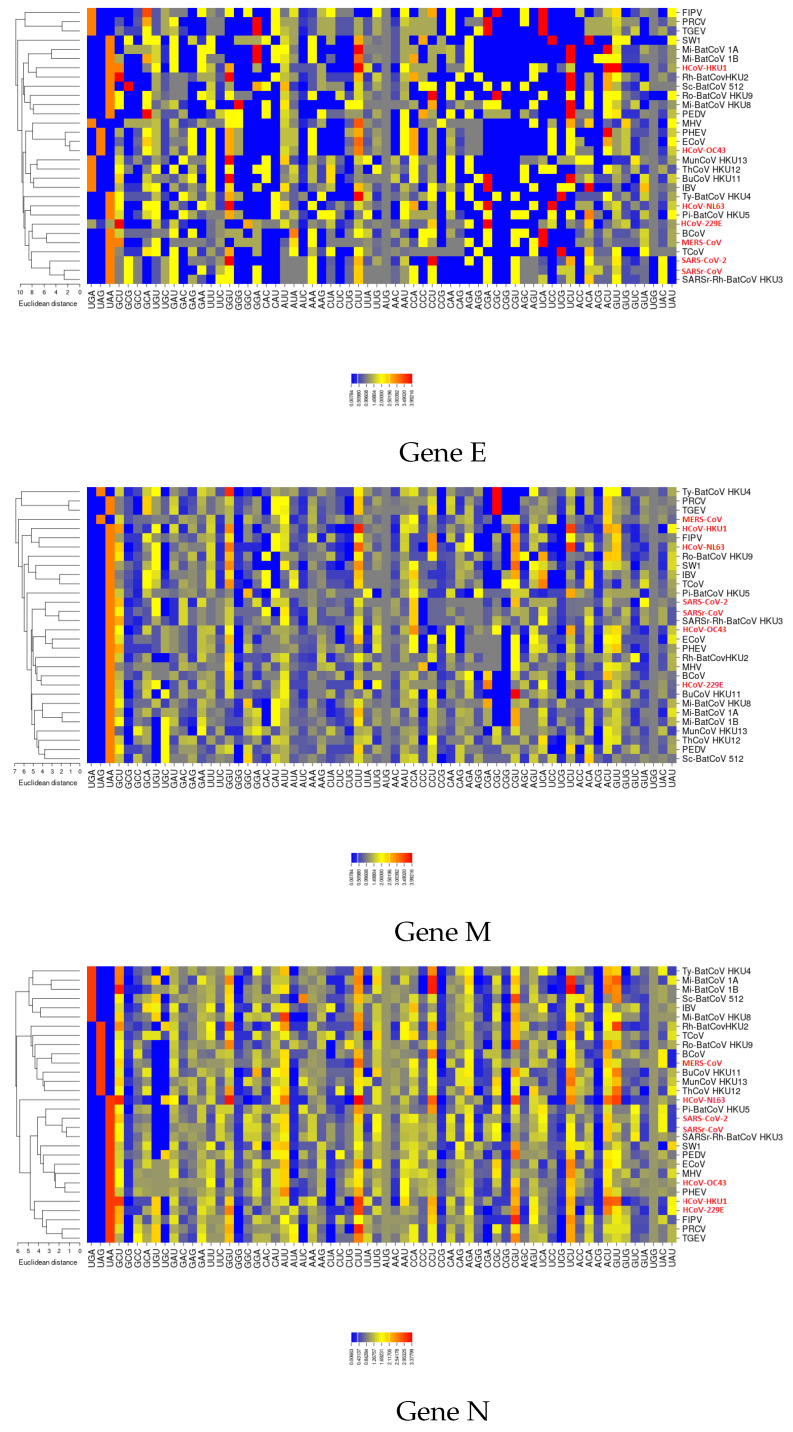
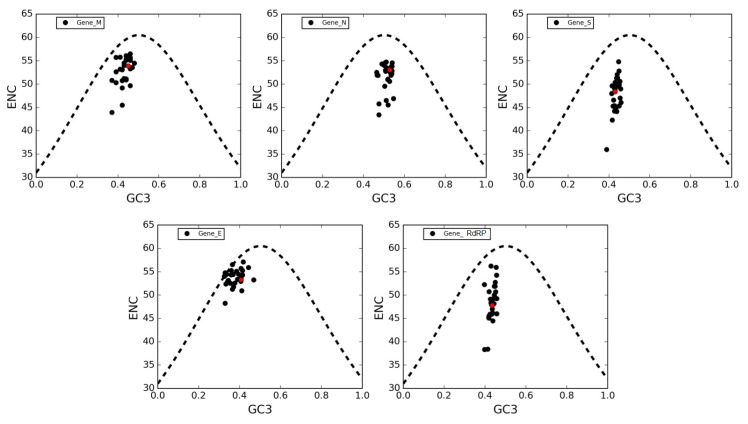
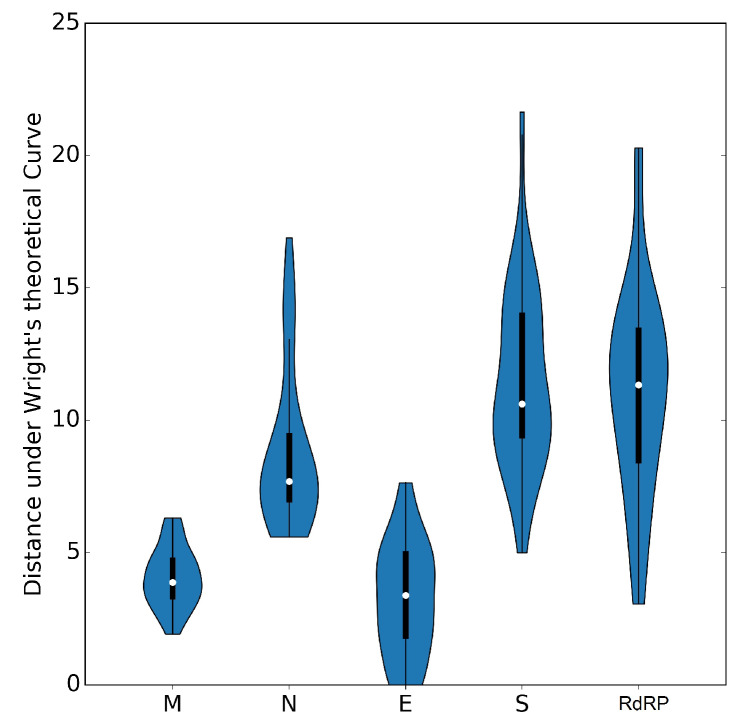
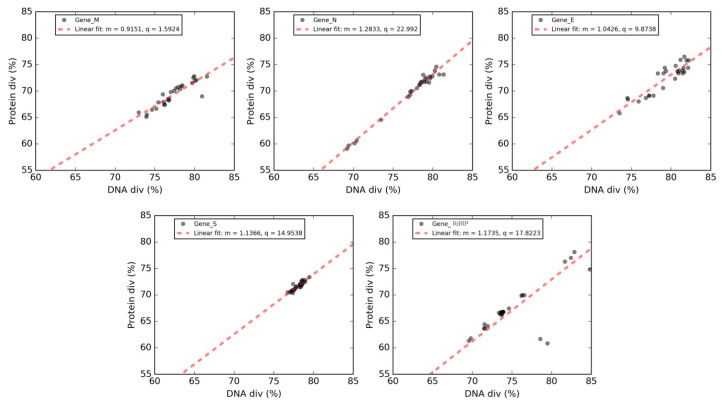
Severe acute respiratory syndrome coronavirus 2 (SARS-CoV-2), which first occurred in Wuhan (China) in December of 2019, causes a severe acute respiratory illness with a high mortality rate, and has spread around the world. To gain an understanding of the evolution of the newly emerging SARS-CoV-2, we herein analyzed the codon usage pattern of SARS-CoV-2. For this purpose, we compared the codon usage of SARS-CoV-2 with that of other viruses belonging to the subfamily of Orthocoronavirinae. We found that SARS-CoV-2 has a high AU content that strongly influences its codon usage, which appears to be better adapted to the human host. We also studied the evolutionary pressures that influence the codon usage of five conserved coronavirus genes encoding the viral replicase, spike, envelope, membrane and nucleocapsid proteins. We found different patterns of both mutational bias and natural selection that affect the codon usage of these genes. Moreover, we show here that the two integral membrane proteins (matrix and envelope) tend to evolve slowly by accumulating nucleotide mutations on their corresponding genes. Conversely, genes encoding nucleocapsid (N), viral replicase and spike proteins (S), although they are regarded as are important targets for the development of vaccines and antiviral drugs, tend to evolve faster in comparison to the two genes mentioned above. Overall, our results suggest that the higher divergence observed for the latter three genes could represent a significant barrier in the development of antiviral therapeutics against SARS-CoV-2.

Keywords: SARS-CoV-2; codon usage bias; coronaviruses; host adaptation; mutational bias; natural selection.


Conflict of interest statement

The authors declare no conflict of interest.

Figures

Figure A1
Figure A1
Phylogenetic tree from GISAID.
Figure A2
Figure A2
RSCU vectors of coronavirus. Patterns of RSCU vectors for 306 patients with SARS-CoV-2 from different countries (data downloaded from GISAID).
Figure A3
Figure A3
Unrooted ML-based tree of the 30 CoV genomic sequences. The four distinct color-coded clades correspond to the respective genera of CoVs. The SARS-CoV-2 sequence is indicated by a star. The branch lengths depict evolutionary distance. Bootstrap values higher than 50 are shown at the nodes. The scale bar at the lower left denotes the length of nucleotide substitutions per position.
Figure A4
Figure A4
Similarity index (SiD) of SARS-CoV-2, using different host organisms as references. On the horizontal axis, the 13 eukaryotic species that were considered in the comparisons are shown. The host species are ranked in ascending order. CAI values for the bat, rat, hamster, snake, pangolin, and human are higher compared to the other species.
Figure A5
Figure A5
Heatmaps of RSCU vectors for genes RdRP (upper panel) and S (bottom panel).
Figure 1
Figure 1
Clustering of the relative synonymous codon usage (RSCU) vectors associated with the 30 coronaviruses. Human coronaviruses are shown in red. The newly identified SARS-CoV-2 coronavirus is closer to HCoV-229E and SARSr-CoV in terms of codon usage, as measured by their RSCU vectors. Heatmap was drawn with the CIMminer software [20], which uses Euclidean distances and the average linkage algorithm.
Figure 2
Figure 2
Z-score values. Z-score is calculated for two codon bias indeces: effective number of codons (ENC) and the competition adaptation index (CAI). CAI values are calculated by considering the hosts specified in Table 3 by Woo et al. [4]. Regarding SARS-CoV-2, we considered a human host. In red, we show the human coronaviruses. Several coronaviruses have a codon usage preference values higher than the average value of the family (|Z-score| > 3). The statistically significant differences are marked with asterisks. In particular, SARS-CoV-2 genes have average values of CAI and ENC that are higher than the average of all coronaviruses. (*): |Z-score| > 3.
Figure 3
Figure 3
CAI values of SARS-CoV-2 for different hosts. On the horizontal axis, the 12 eukaryotic species are shown that were considered in the comparisons. The host species are ranked in ascending order. CAI values for snake and human hosts are higher than those for other hosts.
Figure 4
Figure 4
RSCU vectors of three different coronavirus genes. Heatmaps confirm that the RSCU patterns of the newly identified coronavirus SARS-CoV-2 sequence are more related to those of SARSr-CoV and SARSr-Rh-BatCoV HKU3 for genes E, M and N.
Figure 5
Figure 5
ENC-plots of genes M, N, S, E and RdRP. In these plots, each point corresponds to a single gene. The black-dotted lines in all panels are plots of Wright’s theoretical curve corresponding to codon usage biases (CUBs) that occur merely due to mutational bias (no selective pressure). Red dots represent SARS-CoV-2 genes.
Figure 6
Figure 6
Violin plots of the distances of genes M, N, S, E and RdRP from Wright’s theoretical curve.
Figure 7
Figure 7
Neutrality plot of genes M, N, S, E and RdRP. In these plots, each point corresponds to a single gene in a virus. The solid black lines in all panels are the bisectors corresponding to those CUBs occurring merely due to mutational bias (no selective pressure). The black-dotted lines are the linear regressions. Red dots represent SARS-CoV-2 genes.
Figure 8
Figure 8
Forsdyke plots of genes M, N, S, E and RdRP. Phenotype (Protein div) vs. nucleotide (DNA div) sequence divergence between SARS-CoV-2 and orthologous genes in the other coronaviruses. Each point corresponds to an individual gene. In each panel, the best-fit line is shown in red, together with the associated values of the slope (m) and the intercept (q) in the legend.

Similar articles

Cited by

References

    1. Lai M.M.C. Coronavirus: Organization, replication and expression of genome. Annu. Vet. Microbiol. 1990;44:303–333. doi: 10.1146/annurev.mi.44.100190.001511. - DOI - PubMed
    1. Gorbalenya A.E., Enjuanes L., Ziebuhr J., Snijder E.J. Nidovirales: Evolving the largest RNA virus genome. Virus Res. 2006;117:17–37. doi: 10.1016/j.virusres.2006.01.017. - DOI - PMC - PubMed
    1. Siddell S.G., Ziebuhr J., Snijder E.J. Coronaviruses, Toroviruses, and Arteriviruses. Topley Wilson’s Microbiol. Microb. Infect. 2005 doi: 10.1002/9780470688618.taw0245. - DOI
    1. Woo P.C., Huang Y., Lau S.K., Yuen K.Y. Coronavirus genomics and bioinformatics analysis. Viruses. 2010;2:1804–1820. doi: 10.3390/v2081803. - DOI - PMC - PubMed
    1. Fouchier R.A., Kuiken T., Schutten M., Van Amerongen G., Van Doornum G.J., Van den Hoogen B.G., Peiris M. Aetiology: Koch’s postulates fulfilled for SARS virus. Nature. 2003;423:240. doi: 10.1038/423240a. - DOI - PMC - PubMed

LinkOut - more resources