. 2020 Apr 30;21(9):3187.
doi: 10.3390/ijms21093187.

Season Affects Yield and Metabolic Profiles of Rice (Oryza sativa) under High Night Temperature Stress in the Field

Affiliations

Season Affects Yield and Metabolic Profiles of Rice (Oryza sativa) under High Night Temperature Stress in the Field

Stephanie Schaarschmidt et al. Int J Mol Sci. .

Abstract

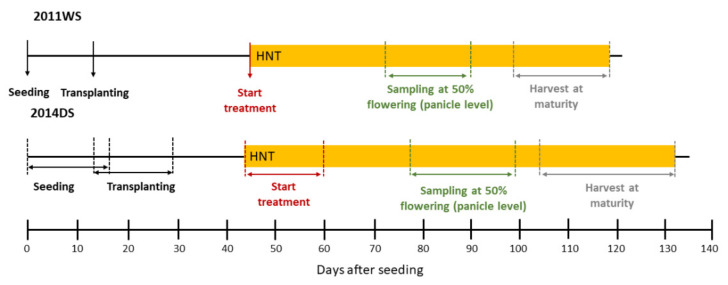
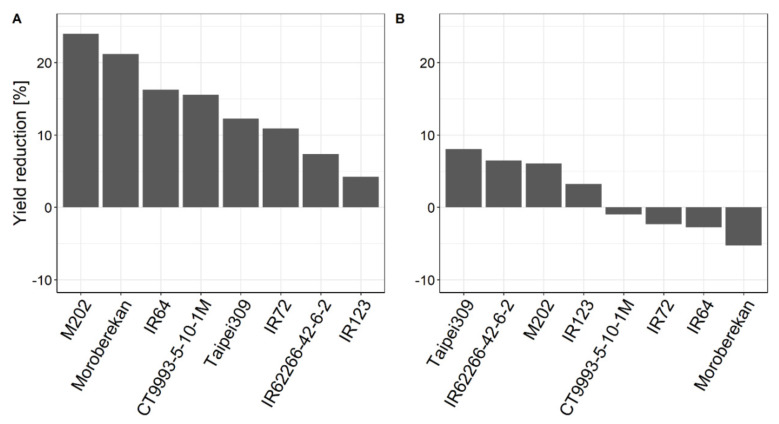
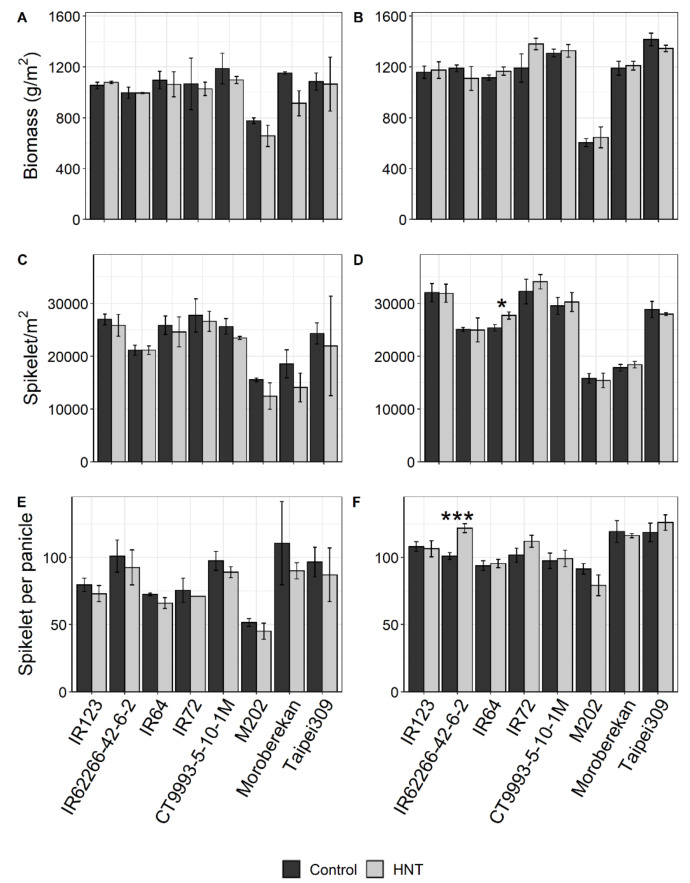
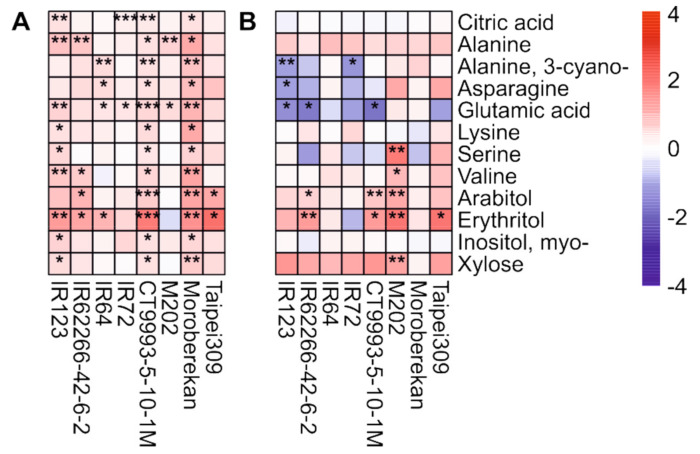
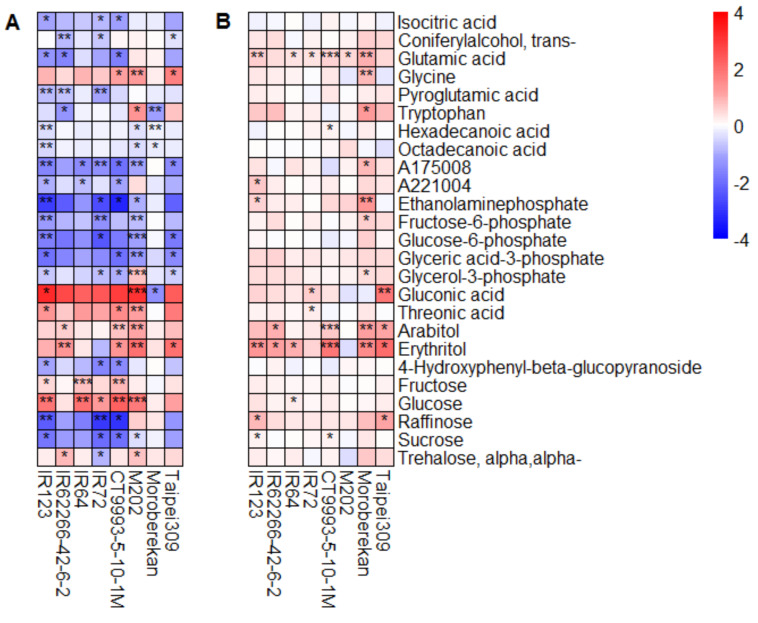
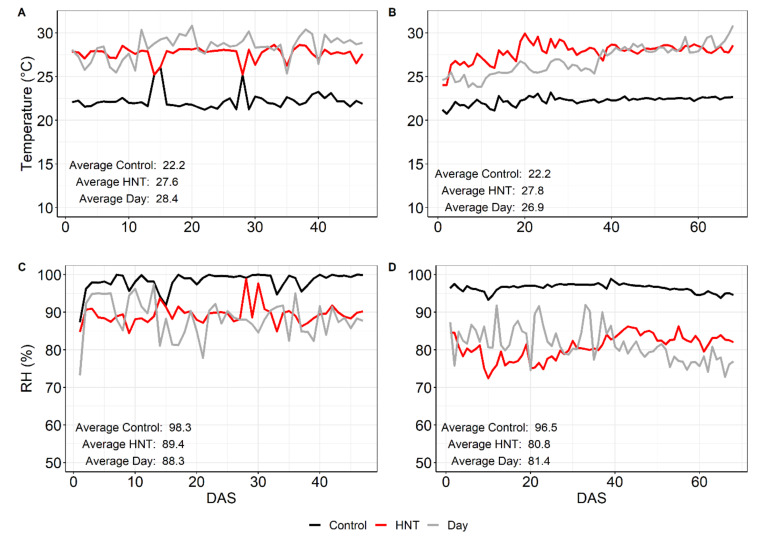
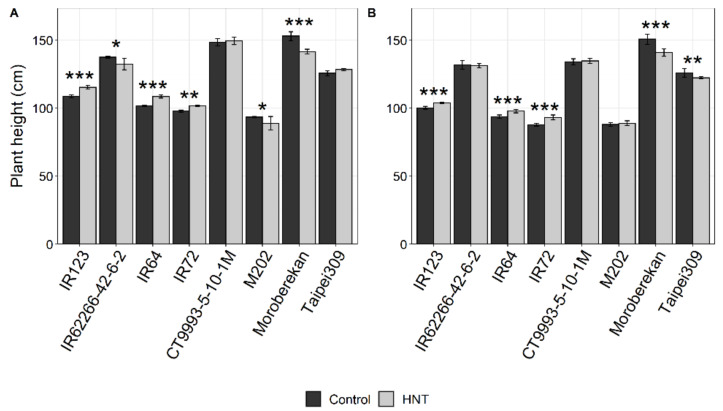
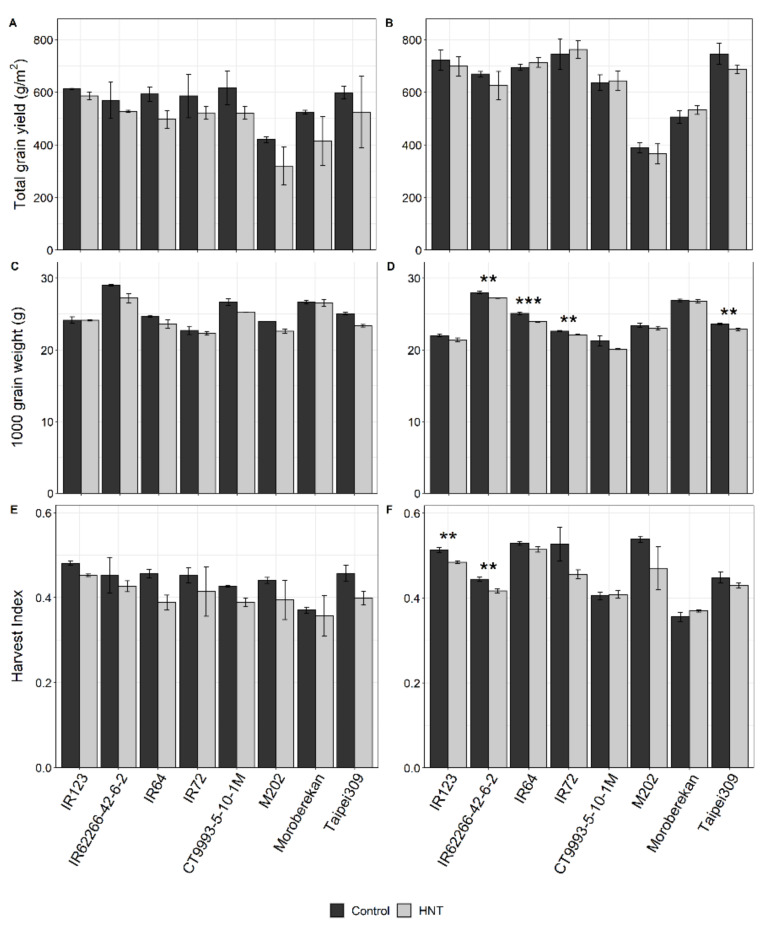
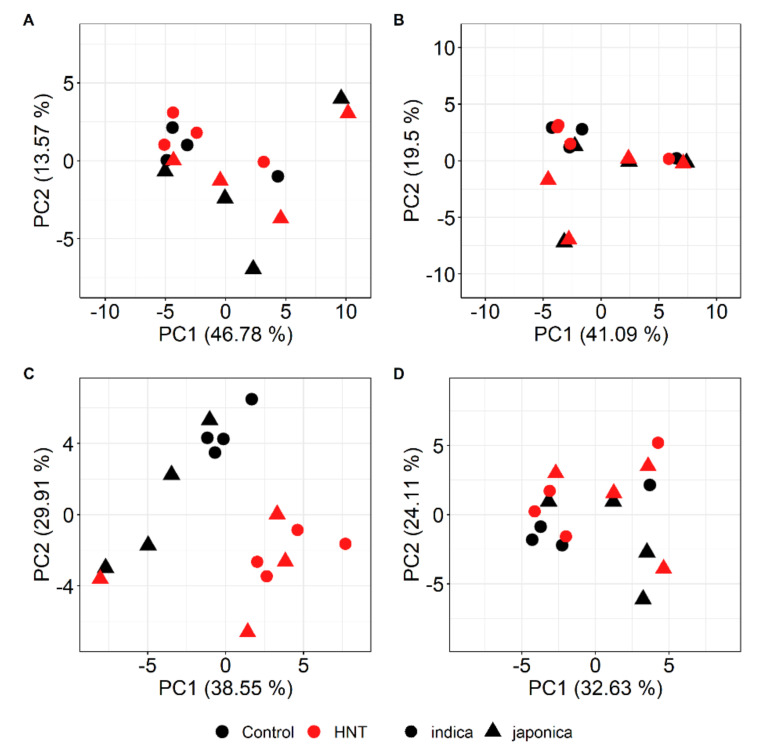
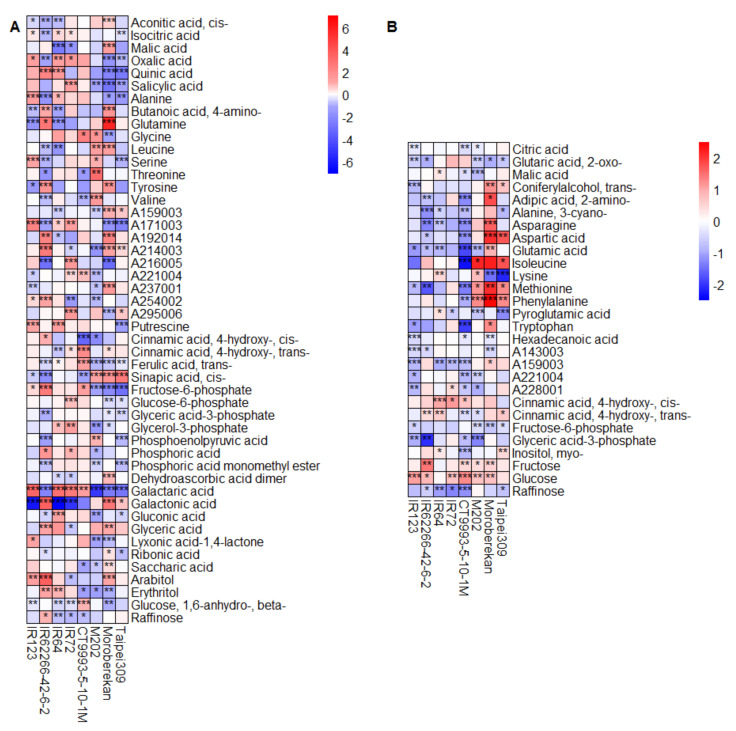
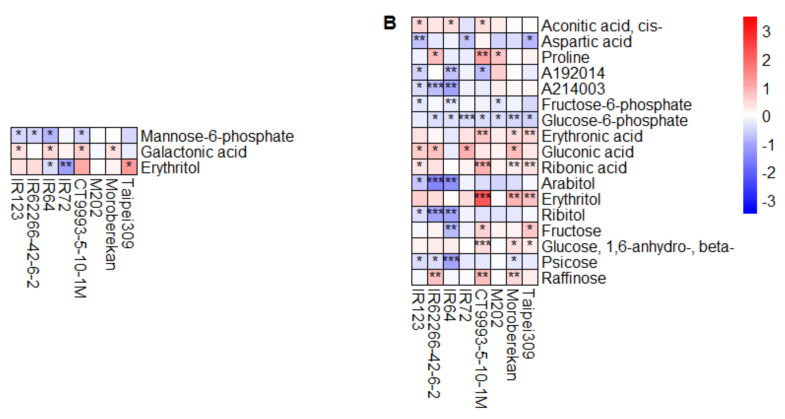
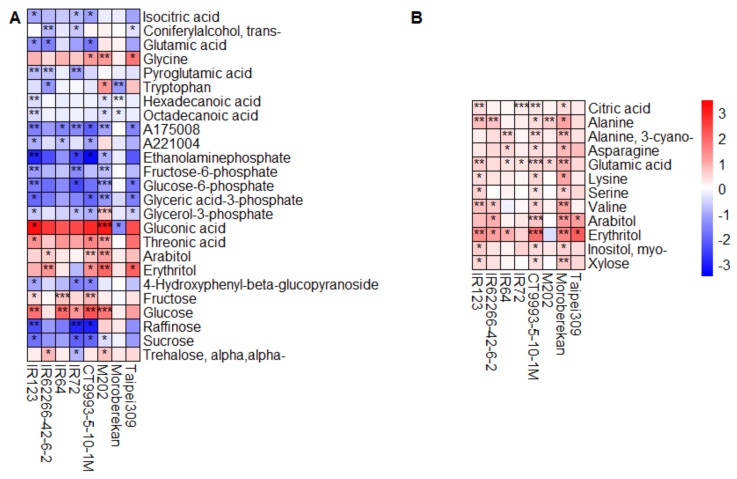
Rice (Oryza sativa) is the main food source for more than 3.5 billion people in the world. Global climate change is having a strong negative effect on rice production. One of the climatic factors impacting rice yield is asymmetric warming, i.e., the stronger increase in nighttime as compared to daytime temperatures. Little is known of the metabolic responses of rice to high night temperature (HNT) in the field. Eight rice cultivars with contrasting HNT sensitivity were grown in the field during the wet (WS) and dry season (DS) in the Philippines. Plant height, 1000-grain weight and harvest index were influenced by HNT in both seasons, while total grain yield was only consistently reduced in the WS. Metabolite composition was analysed by gas chromatography-mass spectrometry (GC-MS). HNT effects were more pronounced in panicles than in flag leaves. A decreased abundance of sugar phosphates and sucrose, and a higher abundance of monosaccharides in panicles indicated impaired glycolysis and higher respiration-driven carbon losses in response to HNT in the WS. Higher amounts of alanine and cyano-alanine in panicles grown in the DS compared to in those grown in the WS point to an improved N-assimilation and more effective detoxification of cyanide, contributing to the smaller impact of HNT on grain yield in the DS.

Keywords: dry season; grain yield; high night temperature; metabolomics; rice; wet season.


Conflict of interest statement

The authors declare no conflict of interest. The funders had no role in the design of the study; in the collection, analyses, or interpretation of data; in the writing of the manuscript, or in the decision to publish the results.

Figures

Figure A1
Figure A1
Experimental set-up for the DS and WS experiment. WS—wet season, DS—dry season.
Figure A2
Figure A2
Weather data for the DS and WS experiment measured at the IRRI weather station as average values per day. Radiation (A), sunshine duration (B), rainfall (C), relative humidity (D), maximal temperature Tmax (E), minimal temperature Tmin (F). Broken lines represent a trend line for the respective data set. DAT—days after transplanting. Average values for all weather parameters were significantly different (p < 0.05) between WS and DS.
Figure A3
Figure A3
Yield reduction under HNT in the WS (A) and DS (B). Cultivars are sorted from highest to lowest yield reduction.
Figure A4
Figure A4
Biomass (A, B), spikelets per m2 (C, D), and spikelets per panicle (E, F) of eight rice cultivars in response to HNT stress for the WS (A, C, E) and DS (B, D, F). For the WS, variance is displayed as range between means of two replicates with 12 plants each; for the DS, the standard error of the mean of five replicates with 12 plants each is shown. Cultivars are sorted alphabetically within the respective O. sativa subspecies indica (1-4) and japonica (5–8). Significance levels were only calculated for the DS due to the insufficient replicate number in the WS and are indicated by asterisks: 0.001 < ***; 0.001 > ** < 0.01; 0.01 > * < 0.05.
Figure A5
Figure A5
Log2 fold changes in significantly changed metabolite pools under HNT compared to under control conditions in panicles for the DS (A). For comparison, the same metabolites are shown for the WS (B) independent of a significant change. For the DS, only metabolites that showed a significant change in at least three out of eight cultivars are displayed in (A). The level of significance is indicated by asterisks (* p < 0.05; ** p < 0.01; *** p < 0.001), and the log2 fold difference is indicated by the color code. Blue indicates a lower metabolite level compared to under the control condition, and red, a higher level. Cultivars were sorted alphabetically within the respective O. sativa subspecies indica (1–4) and japonica (5–8).
Figure A6
Figure A6
Log2 fold changes in significantly changed metabolite pools under HNT compared to under control conditions in panicles for the WS (A). For comparison, the same metabolites are shown for the DS (B) independent of a significant change. For the WS (A), only metabolites that showed a significant change in at least three out of eight cultivars are displayed. The level of significance is indicated by asterisks (* p < 0.05; ** p < 0.01; *** p < 0.001), and the log2 fold difference is indicated by the color code. Blue indicates a lower metabolite level compared to under the control condition, and red, a higher level. Cultivars were sorted alphabetically within the respective O. sativa subspecies indica (1–4) and japonica (5–8).
Figure 1
Figure 1
Average temperature (A,B) and relative humidity (RH) (C,D) during the night (6 p.m.–6 a.m.) in the wet season (WS) (A,C) and dry season (DS) (B,D) under control and HNT conditions, measured till the end of sampling at 50% flowering. For comparison, day temperature and humidity are included (grey lines). Measurements, which were done every 30 min, were averaged. DAS—Days after stress; WS—wet season; DS—dry season.
Figure 2
Figure 2
Plant height of the investigated rice cultivars under control and HNT conditions in the WS (A) and DS (B). Bars for the WS represent means ± SEM of 24 plants per condition, and bars for the DS, those of 60 plants per condition. Cultivars are sorted alphabetically within the respective O. sativa subspecies indica (1–4) and japonica (5–8). Significance levels are indicated by asterisks: 0.001 < ***; 0.001 > ** < 0.01; 0.01 > * < 0.05.
Figure 3
Figure 3
Grain yield (A,B), 1000-grain weight (C,D) and harvest Index (E,F) of eight rice cultivars under control and HNT conditions in the WS (A,C,E) and DS (B,D,F). For the WS, bars represent the means and error bars, the range of two replicates generated from 12 plants, each. For the DS, the bars represent the means ± SEM of five replicates generated from 12 plants, each. Cultivars are sorted alphabetically within the respective O. sativa subspecies indica (1–4) and japonica (5–8). Significance levels were only calculated for the DS due to an insufficient replicate number in the WS and are indicated by asterisks: 0.001 < ***; 0.001 > ** < 0.01; 0.01 > * < 0.05.
Figure 4
Figure 4
Score plots of the first two Principal Components (PC1 and PC2) from the Principal Component Analysis (PCA) of the metabolite profiles of rice flag leaves (A, B) and panicles (C, D) of the eight investigated rice cultivars under control and HNT conditions in the WS (A, C) and DS (B, D). For flag leaves, means of the median-normalized and log2-transformed mass spectral intensities of 76 metabolites, and for panicles, those of 69 metabolites, were used. Numbers in parentheses indicate the fractions of the total variance explained by the respective PCs.
Figure 5
Figure 5
Heat maps showing the log2 fold changes in metabolite levels under control conditions in the DS compared to the WS for flag leaves (A) and panicles (B). Only metabolites with a significant change in at least three out of the eight cultivars are displayed. The level of significance is indicated by asterisks (* p < 0.05; ** p < 0.01; *** p < 0.001) and the log2 fold change is represented by the indicated color code. Blue indicates a lower metabolite level in the DS compared to the WS, and red, a higher level. Metabolites are listed alphabetically within the metabolite classes (compare Supplementary Table S2). Cultivars are sorted alphabetically within the respective O. sativa subspecies indica (1–4) and japonica (5–8).
Figure 6
Figure 6
Heat maps showing the log2 fold changes in metabolite pool sizes in flag leaves under HNT compared to control conditions for the WS (A) and DS (B). Only metabolites with a significant change in at least three out of the eight cultivars are displayed. The level of significance is indicated by asterisks (* p < 0.05; ** p < 0.01; *** p < 0.001), and the log2 fold change is represented by the indicated color code. Blue indicates a lower metabolite level under HNT compared to under control conditions, and red, a higher level. Cultivars were sorted alphabetically within the respective O. sativa subspecies indica (1–4) and japonica (5–8).
Figure 7
Figure 7
Heat maps showing the log2 fold changes in metabolite pool sizes in panicles under HNT compared to control conditions for the WS (A) and DS (B). Only metabolites with a significant change in at least three out of the eight cultivars are displayed. The level of significance is indicated by asterisks (* p < 0.05; ** p < 0.01; *** p < 0.001), and the log2 fold change is represented by the indicated color code. Blue indicates a lower metabolite level under HNT compared to control conditions, and red, a higher level. Cultivars were sorted alphabetically within the respective O. sativa subspecies indica (1–4) and japonica (5–8).
Figure 8
Figure 8
Activity of the enzyme alanine aminotransferase (AlaAT) in panicles of the indicated rice cultivars under control and HNT conditions for the WS (A) and DS (B). Values are averages of three replicates per cultivar and condition, with four exceptions with two replicates. The level of significance is indicated by asterisks (* p < 0.05; ** p < 0.01; *** p < 0.001). Cultivars were sorted alphabetically within the respective O. sativa subspecies indica (1–4) and japonica (5–8).
Figure 9
Figure 9
Metabolites with significant correlations (Spearman’s rank correlation, p < 0.05) between total grain yield reduction under HNT in the WS and the corresponding changes in metabolite contents (log2 fold change) in flag leaves (A) and in panicles (B). Red color indicates positive correlations. Metabolites are sorted alphabetically.

Similar articles

Cited by

References

    1. GRISP . Global Rice Science Partnership. International Rice Research Institute; Los Baños, Philippines: 2013.
    1. FAO. FAOSTAT Database 2009. [(accessed on 23 October 2019)]; Available online: http://faostat.fao.org/
    1. IPCC . AR5 Climate Change 2014: Impacts, Adaptation, and Vulnerability. Cambridge Univ. Press; Cambridge, UK: 2014.
    1. FAO. FAOSTAT Database 2014. [(accessed on 2 November 2019)]; Available online: http://faostat.fao.org/
    1. Easterling D.R., Horton B., Jones P.D., Peterson T.C., Karl T.R., Parker D.E., Salinger M.J., Razuvayev V., Plummer N., Jamason P., et al. Maximum and minimum temperature trends for the globe. Science. 1997;277:364–367. doi: 10.1126/science.277.5324.364. - DOI

LinkOut - more resources