Burst, Short, and Sustained Vitamin D3 Applications Differentially Affect Osteogenic Differentiation of Human Adipose Stem Cells
- PMID: 32366057
- PMCID: PMC7247321
- DOI: 10.3390/ijms21093202
Burst, Short, and Sustained Vitamin D3 Applications Differentially Affect Osteogenic Differentiation of Human Adipose Stem Cells
Abstract
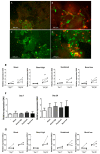
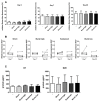
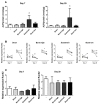
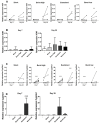
Incorporation of 1,25(OH)2 vitamin D3 (vitD3) into tissue-engineered scaffolds could aid the healing of critical-sized bone defects. We hypothesize that shorter applications of vitD3 lead to more osteogenic differentiation of mesenchymal stem cells (MSCs) than a sustained application. To test this, release from a scaffold was mimicked by exposing MSCs to exactly controlled vitD3 regimens. Human adipose stem cells (hASCs) were seeded onto calcium phosphate particles, cultured for 20 days, and treated with 124 ng vitD3, either provided during 30 min before seeding ([200 nM]), during the first two days ([100 nM]), or during 20 days ([10 nM]). Alternatively, hASCs were treated for two days with 6.2 ng vitD3 ([10 nM]). hASCs attached to the calcium phosphate particles and were viable (~75%). Cell number was not affected by the various vitD3 applications. VitD3 (124 ng) applied over 20 days increased cellular alkaline phosphatase activity at Days 7 and 20, reduced expression of the early osteogenic marker RUNX2 at Day 20, and strongly upregulated expression of the vitD3 inactivating enzyme CYP24. VitD3 (124 ng) also reduced RUNX2 and increased CYP24 applied at [100 nM] for two days, but not at [200 nM] for 30 min. These results show that 20-day application of vitD3 has more effect on hASCs than the same total amount applied in a shorter time span.
Keywords: bioactive components; bone; burst release; calcitriol; short stimulation; sustained release; tissue engineering.
Conflict of interest statement
The authors declare no conflict of interest and the founding sponsors had no role in the design of the study; in the collection, analyses, or interpretation of data; in the writing of the manuscript, and in the decision to publish the results.
Figures


Similar articles
-
Growth factor gene expression profiles of bone morphogenetic protein-2-treated human adipose stem cells seeded on calcium phosphate scaffolds in vitro.Biochimie. 2013 Dec;95(12):2304-13. doi: 10.1016/j.biochi.2013.08.034. Epub 2013 Sep 9. Biochimie. 2013. PMID: 24028822
-
[A novel tissue-engineered bone constructed by using human adipose-derived stem cells and biomimetic calcium phosphate scaffold coprecipitated with bone morphogenetic protein-2].Beijing Da Xue Xue Bao Yi Xue Ban. 2017 Feb 18;49(1):6-15. Beijing Da Xue Xue Bao Yi Xue Ban. 2017. PMID: 28202997 Chinese.
-
The poly (l-lactid-co-glycolide; PLGA) fiber component of brushite-forming calcium phosphate cement induces the osteogenic differentiation of human adipose tissue-derived stem cells.Biomed Mater. 2019 Aug 29;14(5):055012. doi: 10.1088/1748-605X/ab3544. Biomed Mater. 2019. PMID: 31465298
-
The osteogenic differentiation of SSEA-4 sub-population of human adipose derived stem cells using silicate nanoplatelets.Biomaterials. 2014 Nov;35(33):9087-99. doi: 10.1016/j.biomaterials.2014.07.052. Epub 2014 Aug 12. Biomaterials. 2014. PMID: 25123923
-
Effects of BMP-2 and vitamin D3 on the osteogenic differentiation of adipose stem cells.Biochem Biophys Res Commun. 2011 Apr 29;408(1):126-31. doi: 10.1016/j.bbrc.2011.03.135. Epub 2011 Apr 2. Biochem Biophys Res Commun. 2011. PMID: 21463608
Cited by
-
Cells Derived from Human Long Bone Appear More Differentiated and More Actively Stimulate Osteoclastogenesis Compared to Alveolar Bone-Derived Cells.Int J Mol Sci. 2020 Jul 17;21(14):5072. doi: 10.3390/ijms21145072. Int J Mol Sci. 2020. PMID: 32709153 Free PMC article.
-
1,25-Dihydroxyvitamin D3: A Positive Factor for the Osteogenic Differentiation of hPDLSCs and for the Tissue Regenerative Activity of Cell Sheets.Cell Transplant. 2023 Jan-Dec;32:9636897231202541. doi: 10.1177/09636897231202541. Cell Transplant. 2023. PMID: 37798942 Free PMC article.
References
-
- Myeroff C., Archdeacon M. Autogenous Bone Graft: Donor Sites and Techniques. J. Bone Jt. Surgery- 2011;93:2227–2236. - PubMed
-
- Kim B.S., Choi M.K., Yoon J.H., Lee J. Evaluation of bone regeneration with biphasic calcium phosphate substitute implanted with bone morphogenetic protein 2 and mesenchymal stem cells in a rabbit calvarial defect model. Oral Surg. Oral Med. Oral Pathol. Oral Radiol. 2015;120:2–9. doi: 10.1016/j.oooo.2015.02.017. - DOI - PubMed
MeSH terms
Substances
LinkOut - more resources
Full Text Sources
Medical

