. 2020 May 4;20(1):130.
doi: 10.1186/s12876-020-01281-4.

Fecal microbiota composition is linked to the postoperative disease course in patients with Crohn's disease

Affiliations

Fecal microbiota composition is linked to the postoperative disease course in patients with Crohn's disease

Anna Strömbeck et al. BMC Gastroenterol. .

Abstract

Background: The role of the fecal microbiota composition for the postoperative disease course of patients with Crohn's disease (CD) who have undergone ileocecal resection remains to be established. In this study, we investigated if the fecal microbiota composition, determined by a high throughput test quantifying a pre-selected set of bacteria, is associated with the postoperative disease course of CD patients.

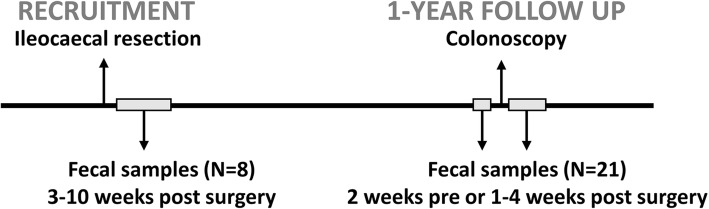
Methods: Fecal samples were obtained from healthy subjects as well as from CD patients, 3-10 weeks and 1 year after ileocaecal resection. The fecal microbial composition was analyzed by Genetic Analysis GA-map Dysbiosis test, targeting ≥300 bacteria on different taxonomic levels. Postoperative disease status was assessed endoscopically according to Rutgeerts scoring system 1 year after surgery. Differences in fecal microbiota composition between groups were analyzed by multivariate factor analyses and cluster analysis. Microbial stability over time was determined using Bray-Curtis dissimilarity.

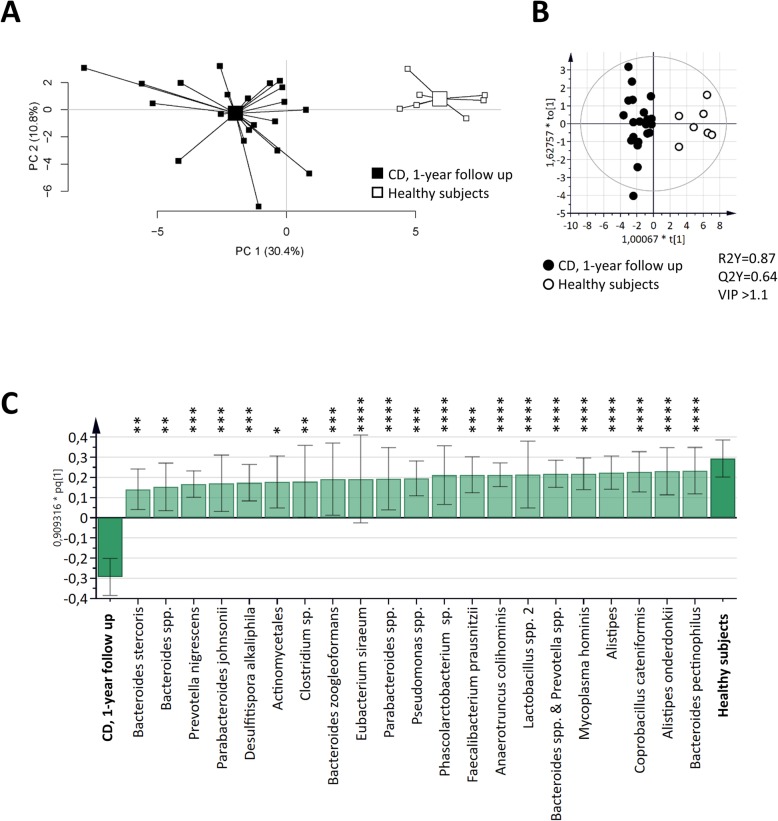
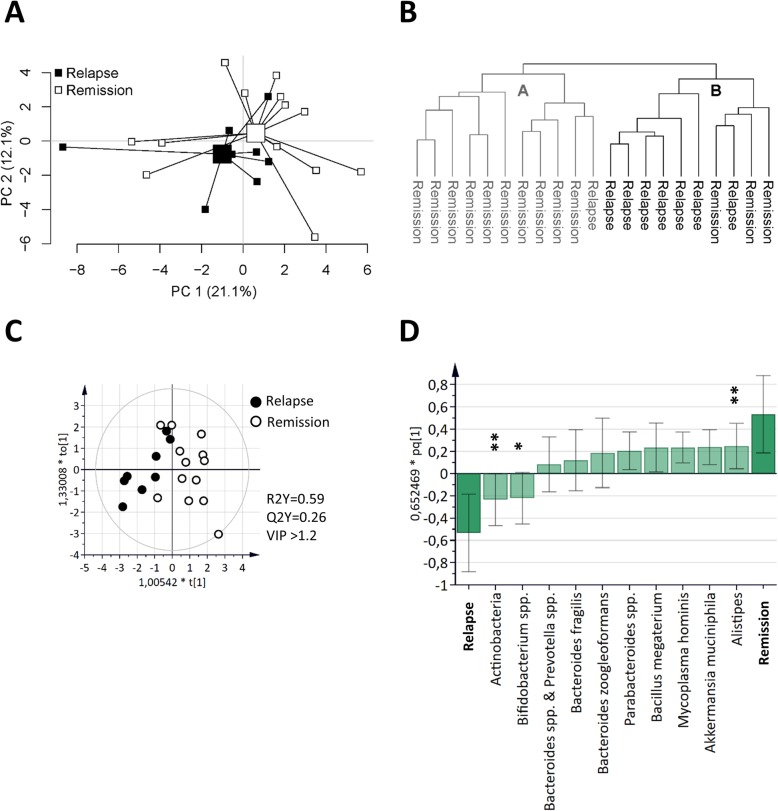
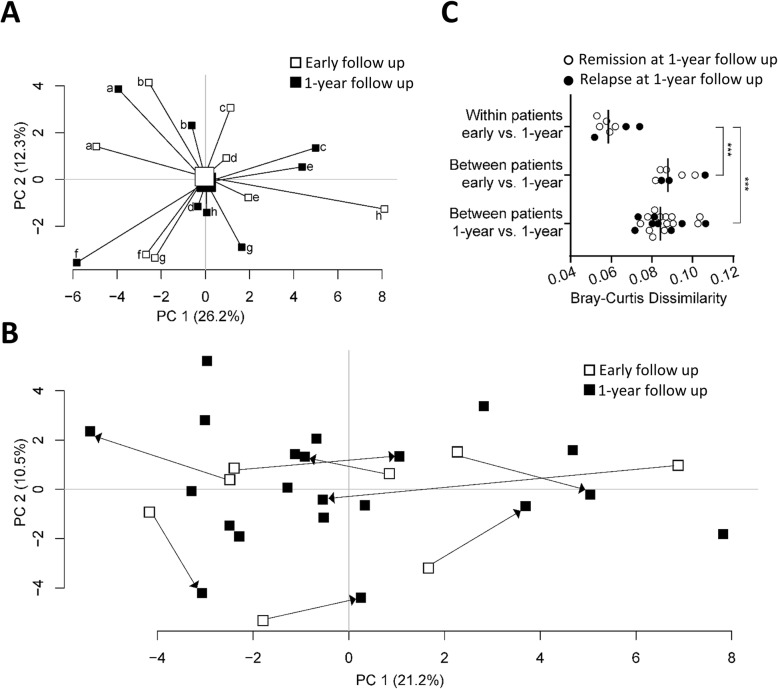
Results: One year after surgery, the fecal microbiota composition differed between CD patients (n = 21) and healthy subjects (n = 7). At this time point, the microbiota composition of CD patients was associated with disease course, clearly separating patients with disease relapse (n = 8) and patients in remission (n = 13). Further, the microbial within-patient stability was high during the first year after surgery, irrespective of disease course.

Conclusion: The fecal microbiota composition of CD patients, analyzed by GA-map Dysbiosis test, is subject to little variation over time, and may potentially be used as a non-invasive diagnostic tool for the postoperative disease course.

Keywords: Crohn’s disease; Fecal microbiota; Postoperative disease recurrence.


Conflict of interest statement

Lena Öhman is a member of the advisory board of Genetic Analysis. The remaining authors declare that they have no competing interest.

Figures

Fig. 1
Fig. 1
Graphical flowchart of the prospective study design. Adult patients who had undergone ileocaecal resection for Crohn’s disease were included (N = 21). Fecal samples were obtained 3–10 weeks after resection (N = 8) and 1 year after resection (N = 21). Postoperative disease status was assessed by colonoscopy approximately 1 year after surgery
Fig. 2
Fig. 2
Differences in fecal microbiota composition in CD patients and healthy subjects (HS). Fecal samples from CD patients 1 year after ileocaecal resection (n = 21) and from HS (n = 7) were analyzed by the GA-map™ Dysbiosis test. a PCA plot of CD patients and HS based on fecal bacterial taxa (X-variables; n = 54). Lines to the centroid, showing the group mean, connect each group. OPLS-DA scatter plot (b) and loadings column plot (c) of CD patients and HS (Y-variables) and fecal bacterial taxa (X-variables; VIP > 1.1; n = 21). Statistically significant differences between study groups are indicated with asterisks in the OPLS-DA loadings column plot (* p ≤ 0.05; ** p ≤ 0.01; *** p ≤ 0.001; **** p ≤ 0.0001)
Fig. 3
Fig. 3
Associations between fecal microbiota and postsurgical disease course in CD. Fecal microbiota from CD patients with endoscopic disease relapse (n = 8) and patients with endoscopic disease remission (n = 13) 1 year after ileocaecal resection was analyzed by the GA-map™ Dysbiosis test. a PCA plot of CD patients with disease relapse and patients with remission based on fecal bacterial taxa (X-variables; n = 54). Lines to the centroid, showing the group mean, connect each group. b Cluster analysis of fecal bacterial taxa (n = 54) from CD patients with disease relapse and remission 1 year after ileocaecal resection (n = 21). OPLS-DA scatter plot (c) and loadings column plot (d) of postoperative disease course (Y-variables, i.e., disease relapse vs remission) and fecal bacterial taxa (X-variables; VIP > 1.2; n = 10). Statistically significant differences between study groups are indicated with asterisks in the OPLS-DA loadings column plot (* p ≤ 0.05; ** p ≤ 0.01)
Fig. 4
Fig. 4
Stability of fecal microbiota composition the first year after ileocaecal resection. Fecal microbiota from 8 CD patients at early follow up (3–10 weeks after ileocaecal resection) and at the 1-year follow, and from 13 patients at the 1 year follow up was analyzed by the GA-map™ Dysbiosis test. a PCA based on fecal microbiota composition (X-variables; n = 54) from 8 CD patients at early follow up and from the same patients at the 1-year follow up. Lines to the centroid, showing the group mean, connect each group. Individual patients are marked from a-h for each time point. b PCA displaying the within-patient mobility of fecal microbial composition from early follow up to 1-year follow up in relation to the total population at the 1-year follow up (n = 21) (paired samples indicated with arrows pointing from early to 1-year follow up, n = 8). c Within-patient microbial similarity from early follow up to 1-year follow up (top, n = 8) in relation to between-patient similarity from early follow up to 1-year follow up (middle, n = 8), and to between-patient similarity at 1 year follow up (bottom, n = 21) analyzed by Bray-Curtis dissimilarity index. Between-patient dissimilarities show mean values for a unique individual to all non-related patients (mean of n = 20). Closed and open circles represent patients with disease relapse and remission, respectively, at the 1-year postsurgical follow-up; *** p ≤ 0.001

References

    1. Burr NE, Lord R, Hull MA, Subramanian V. Decreasing risk of first and subsequent surgeries in patients with Crohn’s disease in England from 1994 through 2013. Clin Gastroenterol Hepatol. 2019;17(10):2042–2049. - PubMed
    1. Rungoe C, Langholz E, Andersson M, Basit S, Nielsen NM, Wohlfahrt J, et al. Changes in medical treatment and surgery rates in inflammatory bowel disease: a nationwide cohort study 1979-2011. Gut. 2014;63(10):1607–1616. - PubMed
    1. Domenech E, Garcia V, Iborra M, Gutierrez A, Garcia-Lopez S, Martin Arranz MD, et al. Incidence and Management of Recurrence in patients with Crohn's disease who have undergone intestinal resection: the Practicrohn study. Inflamm Bowel Dis. 2017;23(10):1840–1846. - PubMed
    1. Buisson A, Chevaux JB, Allen PB, Bommelaer G, Peyrin-Biroulet L. Review article: the natural history of postoperative Crohn's disease recurrence. Aliment Pharmacol Ther. 2012;35(6):625–633. - PubMed
    1. Peyrin-Biroulet L, Loftus EV, Jr, Colombel JF, Sandborn WJ. The natural history of adult Crohn's disease in population-based cohorts. Am J Gastroenterol. 2010;105(2):289–297. - PubMed

MeSH terms