. 2020 Jul 15;80(14):3009-3022.
doi: 10.1158/0008-5472.CAN-19-2270. Epub 2020 May 4.

HACE1 Prevents Lung Carcinogenesis via Inhibition of RAC-Family GTPases

Affiliations

HACE1 Prevents Lung Carcinogenesis via Inhibition of RAC-Family GTPases

Melanie Kogler et al. Cancer Res. .

Abstract

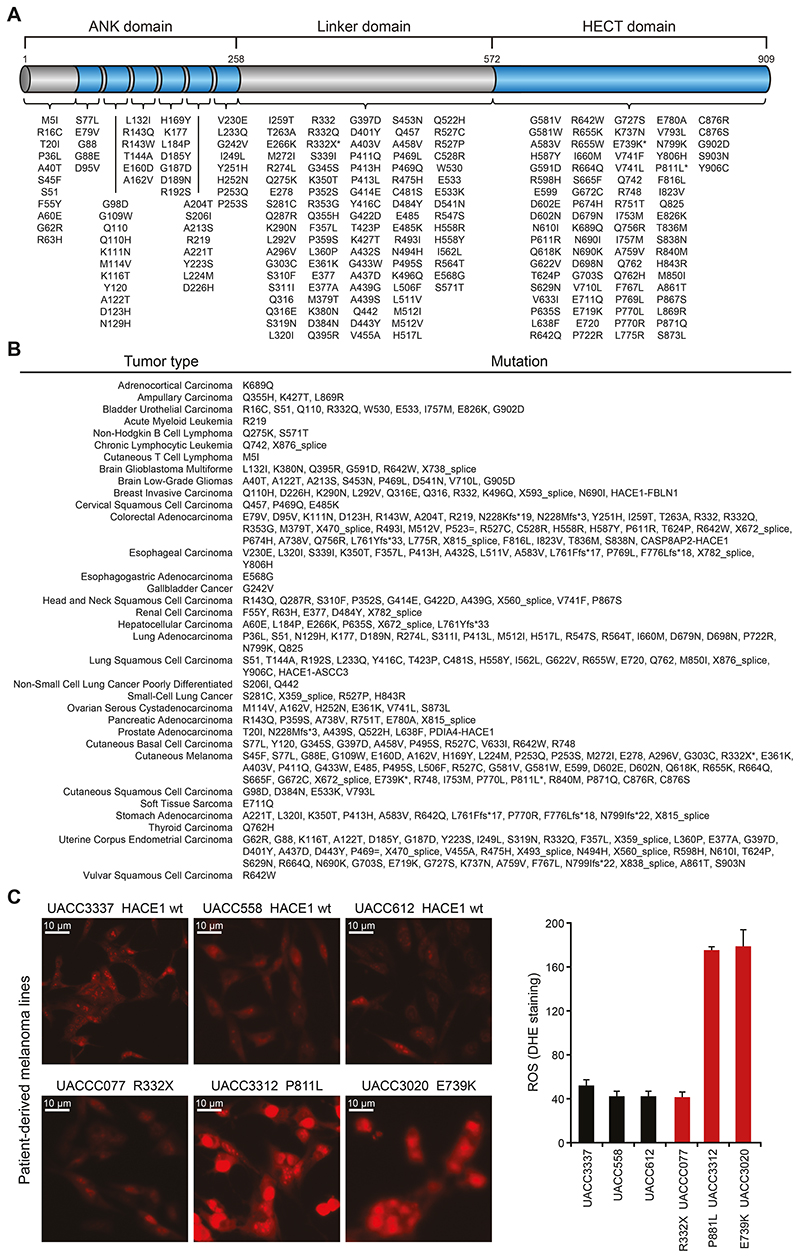
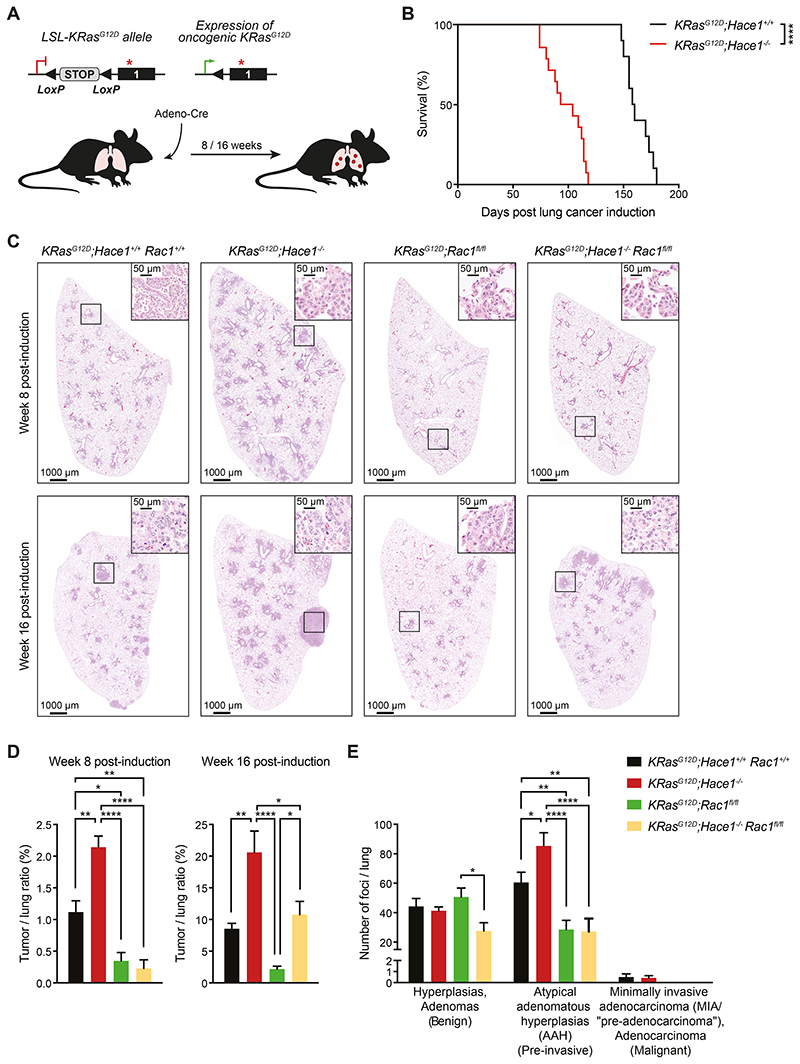
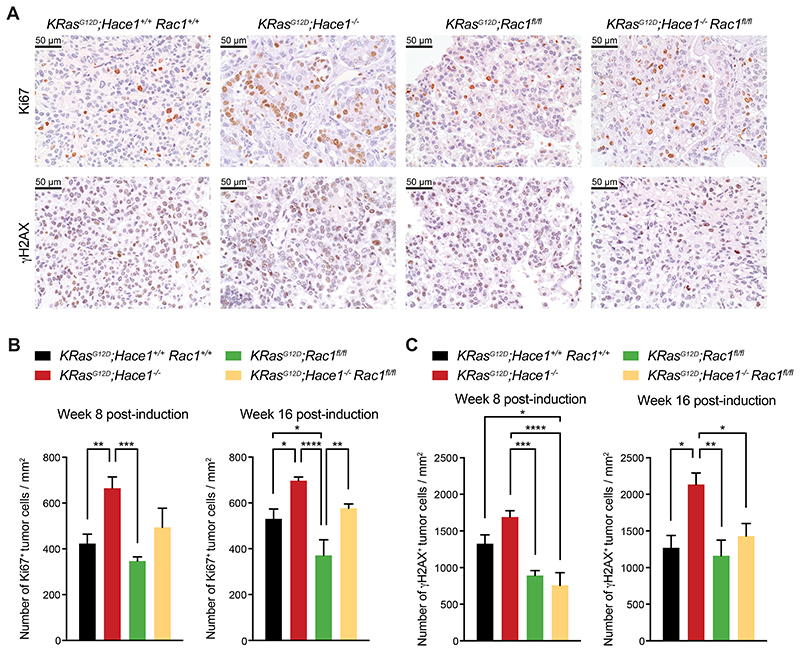
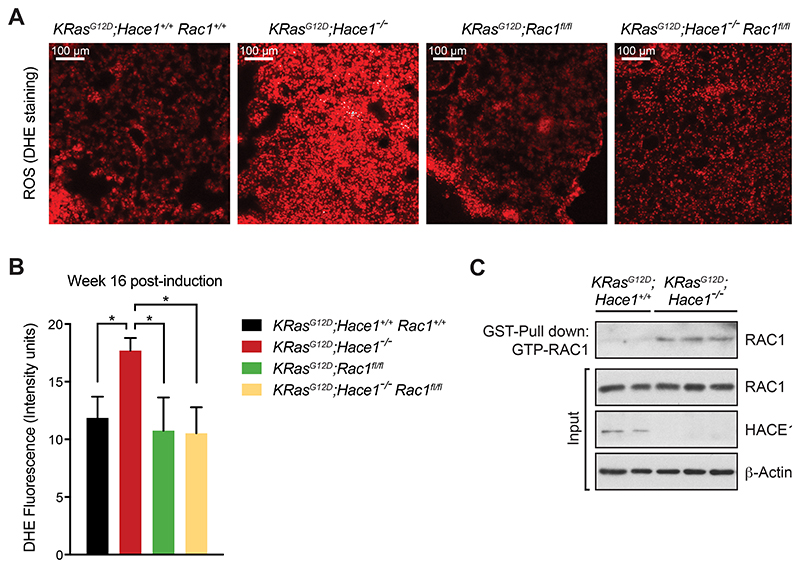
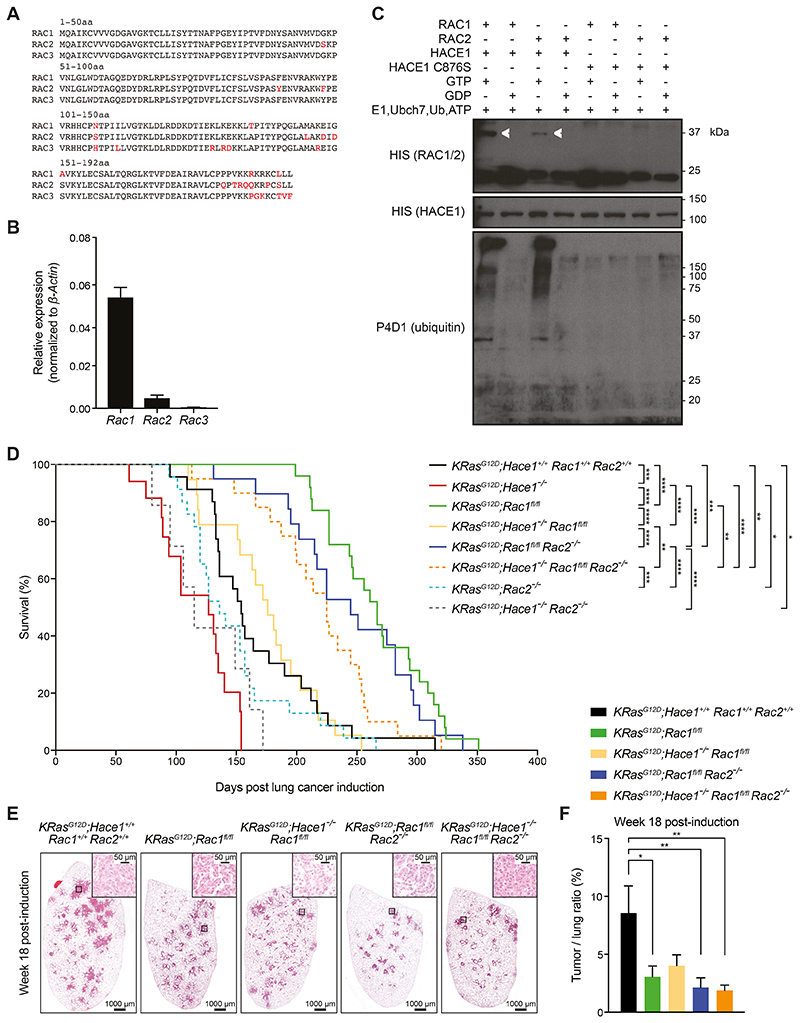
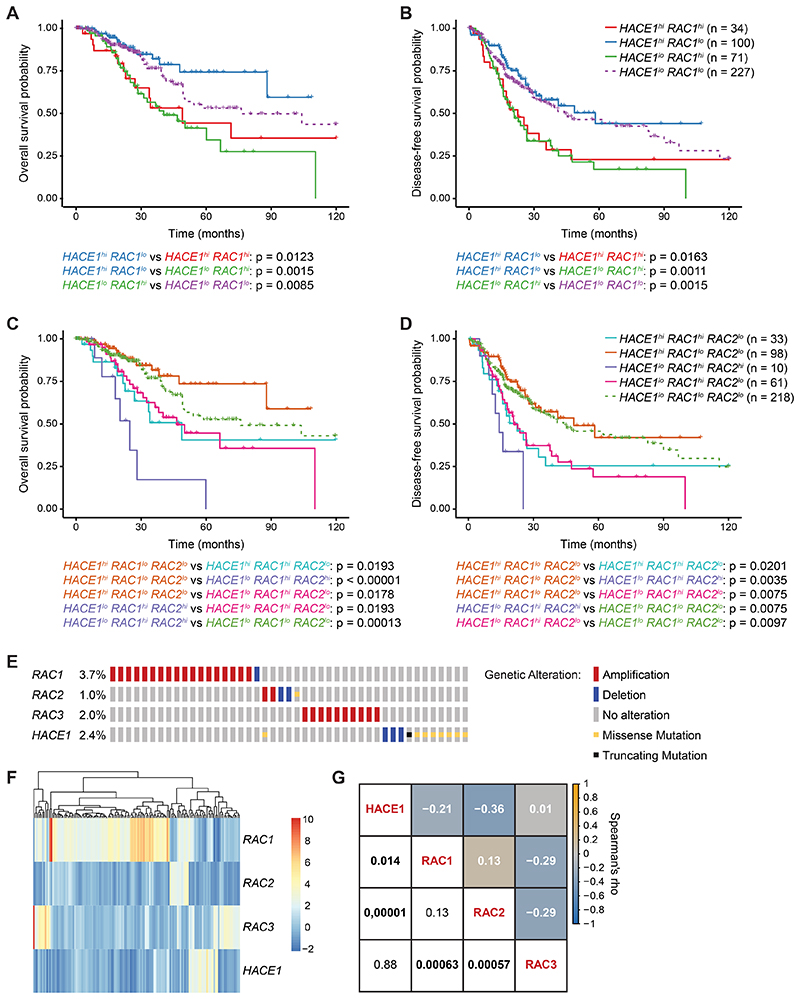
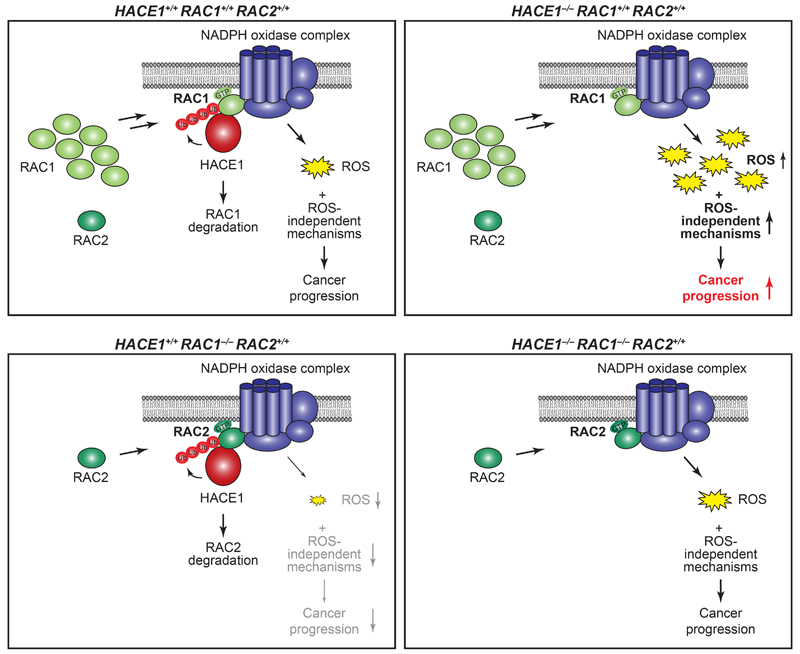
HACE1 is an E3 ubiquitin ligase with important roles in tumor biology and tissue homeostasis. Loss or mutation of HACE1 has been associated with the occurrence of a variety of neoplasms, but the underlying mechanisms have not been defined yet. Here, we report that HACE1 is frequently mutated in human lung cancer. In mice, loss of Hace1 led to enhanced progression of KRasG12D -driven lung tumors. Additional ablation of the oncogenic GTPase Rac1 partially reduced progression of Hace1-/- lung tumors. RAC2, a novel ubiquitylation target of HACE1, could compensate for the absence of its homolog RAC1 in Hace1-deficient, but not in HACE1-sufficient tumors. Accordingly, ablation of both Rac1 and Rac2 fully averted the increased progression of KRasG12D -driven lung tumors in Hace1-/- mice. In patients with lung cancer, increased expression of HACE1 correlated with reduced levels of RAC1 and RAC2 and prolonged survival, whereas elevated expression of RAC1 and RAC2 was associated with poor prognosis. This work defines HACE1 as a crucial regulator of the oncogenic activity of RAC-family GTPases in lung cancer development. SIGNIFICANCE: These findings reveal that mutation of the tumor suppressor HACE1 disrupts its role as a regulator of the oncogenic activity of RAC-family GTPases in human and murine lung cancer. GRAPHICAL ABSTRACT: http://cancerres.aacrjournals.org/content/canres/80/14/3009/F1.large.jpg.


Conflict of interest statement

Conflict of interest: David A. Williams received funding from Bluebird Bio and Novartis. No potential conflicts of interest were disclosed by the other authors.

Figures

Figure 1
Figure 1. The HACE1 mutation landscape of human cancer.
(A) Intra-protein location of HACE1 mutations identified in human cancers as available from datasets on cBioPortal and TGen datasets. The asterisks highlight HACE1 mutations present in patient-derived melanoma cell lines used in (C). The different HACE1 domains are indicated. (B) HACE1 mutation profile in individual cancer types as available from the cBioPortal and TGen datasets. (C) Patient-derived human melanoma cell lines expressing endogenous wildtype HACE1 (wt) or mutated (R332X, P811L, E739K) HACE1, were analyzed for superoxide content by dihydroethidium (DHE) staining. Representative pictures of DHE-stained patient-derived melanoma cells (left) and the quantitative analysis of DHE fluorescence intensity in 200 cells/cell line (right) (Student’s two-tailed t-test, n=3) are shown. Red staining indicates the presence of reactive oxygen species (ROS). Scale bars, 20μm. Data in (C) are presented as mean values SEM.
Figure 2
Figure 2. Genetic deletion of Rac1 reduces the increased lung tumorigenesis of Hace1–/– mice.
(A) Illustration of the KRasG12D-driven lung adenocarcinoma mouse model. Mice carrying the conditional Lox-Stop-Lox (LSL)-KRasG12D allele develop lung adenocarcinomas upon intratracheal instillation of Adeno-Cre which excises the Stop cassette allowing the constitutive expression of oncogenic KRasG12D. (B) Kaplan-Meier survival curve of KRasG12D;Hace1+/+ (n=10) and littermate KRasG12D;Hace1–/– (n=14) mice injected with Adeno-Cre on day 0. **** P<0.0001 (log-rank test). (C) Representative pictures of haematoxylin and eosin (H&E) stained-lung sections and (D) tumor-to-lung ratios at week 8 and 16 post lung cancer induction for KRasG12D;Hace1+/+Rac1+/+, KRasG12D;Hace1–/–, KRasG12D;Rac1fl/fl, and KRasG12D;Hace1–/–Rac1fl/fl mice. Scale bars, 1 mm for 10x images and 50μm for 40x images of lung sections. * P<0.05, ** P<0.01, **** P<0.0001 (One-way ANOVA, Tukey’s post-hoc test, n 5 mice per cohort). (E) Numbers of benign (hyperplasias and adenomas), pre-invasive (atypical adenomatous hyperplasias) and malignant (minimally invasive adenocarcinomas (MIA / “pre-adenocarcinoma”), adenocarcinoma) tumor foci at week 8 post lung cancer induction for KRasG12D;Hace1+/+Rac1+/+, KRasG12D;Hace1–/–, KRasG12D;Rac1fl/fl and KRasG12D;Hace1–/–Rac1fl/fl mice. * P<0.05, ** P<0.01, **** P<0.0001 (Two-way ANOVA, Tukey’s post-hoc test, n≥4 mice per cohort). Data in (D) and (E) are presented as mean values ± SEM.
Figure 3
Figure 3. Elevated proliferation and DNA damage of tumor cells in Hace1–/– mice is reduced upon loss of Rac1.
(A) Representative pictures of Ki67 and γH2AX immunostaining of lungs at week 16 post lung cancer induction for KRasG12D;Hace1+/+Rac1+/+, KRasG12D;Hace1–/–, KRasG12D;Rac1fl/fl and KRasG12D;Hace1–/–Rac1fl/fl mice. Scale bars, 50μm. (B) Quantification of Ki67+ and (C) γH2AX+ tumor cells at week 8 (left panels) and 16 (right) post lung cancer induction for KRasG12D;Hace1+/+Rac1+/+, KRasG12D;Hace1–/–, KRasG12D;Rac1fl/fl and KRasG12D;Hace1–/–Rac1fl/fl mice. * P<0.05, ** P<0.01, *** P<0.001, **** P<0.0001 (One-way ANOVA, Tukey’s post-hoc test, n 3 mice per cohort). Data in (B) and (C) are presented as mean values SEM.
Figure 4
Figure 4. Genetic inactivation of Hace1 results in increased levels of ROS and active GTP-RAC1.
(A) Representative images of DHE-stained lung sections and (B) quantification of the DHE fluorescence intensity at week 16 post lung cancer induction for KRasG12D;Hace1+/+Rac1+/+, KRasG12D;Hace1–/–, KRasG12D;Rac1fl/fl and KRasG12D;Hace1–/–Rac1fl/fl mice (Student’s two-tailed t-test, n≥5 mice per cohort). Red staining indicates the presence of ROS. Scale bars, 100μm. Data in (B) are presented as mean values SEM. (C) Detection of active RAC1 in Hace1 mutant lung tumor cells. Tumor cells, isolated from KRasG12D;Hace1+/+ (n=2) and KRasG12D;Hace1–/– (n=3) mice at week 12 post lung cancer induction, were treated with EGF (50ng/ml) for 5 minutes, followed by GST-PAK pull-down of active GTP-RAC1 and immunoblotting for total RAC1 and HACE1. β-Actin is shown as loading control.
Figure 5
Figure 5. Simultaneous loss of Rac1 and Rac2 improves the survival of Hace1–/– mice.
(A) Amino acid (aa) sequence alignments of murine RAC1, RAC2, and RAC3. Amino acids highlighted in red indicate differences among the family members. The amino acid positions are indicted. (B) Relative mRNA expression of Rac1, Rac2 and Rac3 normalized to β-Actin expression in primary lung tumor cells, isolated from KRasG12D;Hace1+/+Rac1+/+Rac2+/+ mice (n=5) at week 7 post lung cancer induction, followed by RT-qPCR analysis. (C) In vitro ubiquitylation assay. Recombinant GST-HACE1 was incubated with GTP- or GDP-preloaded His-tagged RAC1 or RAC2 in the presence of E1, E2 (Ubch7), ubiquitin and ATP. As a control, catalytic dead HACE1C876S was used. Blots show RAC1 and RAC2 (detected via the His-tag), HACE1 and ubiquitin after 3 h incubation. Ubiquitylated RAC1 and RAC2 are indicated (white arrows). (D) Kaplan-Meier survival curves of KRasG12D;Hace1+/+Rac1+/+Rac2+/+ (n=23), KRasG12D;Hace1–/– (n=15), KRasG12D;Rac1fl/fl (n=25), KRasG12D;Hace1–/–Rac1fl/fl (n=19), KRasG12D;Rac2–/– (n=23) and KRasG12D;Hace1–/–Rac2–/– (n=7), KRasG12D;Rac1fl/flRac2–/– (n=19) and KRasG12D;Hace1–/–Rac1fl/flRac2–/– (n=20) mice. Mice were intratracheally instilled with Adeno-Cre virus on the indicated day 0. * P<0.05, ** P<0.01, *** P<0.001, **** P<0.0001 (log-rank test). (E) Representative H&E stained-lung sections and (F) tumor-to-lung ratios at week 18 post lung cancer induction for KRasG12D;Hace1+/+Rac1+/+Rac2+/+, KRasG12D;Rac1fl/fl, KRasG12D;Hace1–/–Rac1fl/fl, KRasG12D;Rac1fl/flRac2–/– and KRasG12D;Hace1–/–Rac1fl/flRac2–/– mice. Scale bars, 1 mm for 10x images and 50μm for 40x images of lung sections. * P<0.05, ** P<0.01 (One-way ANOVA, Tukey’s post-hoc test, n≥5 mice per cohort). Data in (B) and (F) are presented as mean values ± SEM.
Figure 6
Figure 6. HACE1/RAC are deregulated in lung adenocarcinoma patients.
(A) Kaplan-Meier curves of overall survival and (B) disease-free survival for lung adenocarcinoma patients, based on HACE1 and RAC1 mRNA expression. (C) Kaplan-Meier curves of overall survival and (D) disease-free survival for lung adenocarcinoma patients, based on HACE1, RAC1 and RAC2 mRNA expression. (E) Schematic representation of genetic alterations in HACE1, RAC1, RAC2 and RAC3 in lung adenocarcinoma patients from the TCGA (PanCancer Atlas) data set for 507 cases. Color coding indicates mutation types: red, amplification; blue, homozygous deletion; yellow, missense mutation; black, truncating mutation. Percentages (%) of cases with alteration in HACE1, RAC1, RAC2 and RAC3 are indicated. Only altered cases are shown. (F) Heatmap of gene expression profiles of HACE1, RAC1, RAC2 and RAC3 in lung adenocarcinoma patients. Each row represents the expression of either HACE1, RAC1, RAC2 or RAC3. Each line corresponds to one lung cancer patient. Z-score (RNA Seq V2 RSEM) is shown from 10 (red, highest expression) to -2 (blue, lowest expression). The mRNA expression level in a single sample is depicted according to the color scale. (G) Correlation matrix showing Spearman’s rank correlation of HACE1, RAC1, RAC2 and RAC3 mRNA expression profiles. Correlation coefficients are shown in white and the associated p-values in black (statistically significant values with P<0.05 in bold). Orange and blue colors indicate positive and negative correlations, respectively, beige indicates no correlation.
Figure 7
Figure 7. Schematic representation of HACE1 and RAC-family GTPases driving lung cancer development.
HACE1 ubiquitylates GTP-RAC1 when bound to the NADPH oxidase complex, leading to RAC1 degradation and thereby controlling ROS production (top, left). HACE1 deficiency results in an accumulation of GTP-bound RAC1, increased NADPH oxidase activity and enhanced levels of genotoxic cellular ROS, promoting cancer progression (top, right). Additionally, deregulated RAC1 could promote tumor development by ROS-independent mechanisms. In the absence of the more abundant RAC1, the activity of GTP-RAC2 when bound to the NADPH oxidase complex is controlled by HACE1, leading to decreased cellular ROS levels (bottom, left). When HACE1 and RAC1 are both ablated, active GTP-RAC2 can compensate and promote cancer progression (bottom, right).

References

    1. Bray F, Ferlay J, Soerjomataram I, Siegel RL, Torre LA, Jemal A. Global cancer statistics 2018: GLOBOCAN estimates of incidence and mortality worldwide for 36 cancers in 185 countries. CA: A Cancer Journal for Clinicians. American Cancer Society. 2018;68:394–424. - PubMed
    1. Herbst RS, Morgensztern D, Boshoff C. Nature. Vol. 553. Nature Publishing Group; 2018. The biology and management of non-small cell lung cancer; pp. 446–54. - PubMed
    1. Cronin KA, Lake AJ, Scott S, Sherman RL, Noone A-M, Howlader N, et al. Cancer. 3rd. Vol. 124. John Wiley & Sons, Ltd; 2018. Annual Report to the Nation on the Status of Cancer, part I: National cancer statistics; pp. 2785–800. - PMC - PubMed
    1. Walters S, Maringe C, Coleman MP, Peake MD, Butler J, Young N, et al. Lung cancer survival and stage at diagnosis in Australia, Canada, Denmark, Norway, Sweden and the UK: a population-based study, 2004-2007. Thorax. (7) 2013;68:551–64. - PubMed
    1. Network TCGAR. Nature. Vol. 511. Nature Publishing Group; 2014. Comprehensive molecular profiling of lung adenocarcinoma; pp. 1–9. - PMC - PubMed

Publication types

MeSH terms